Question
+ 2. The management of a line that fills cereal boxes wants to check the quality of the process. The results from the last

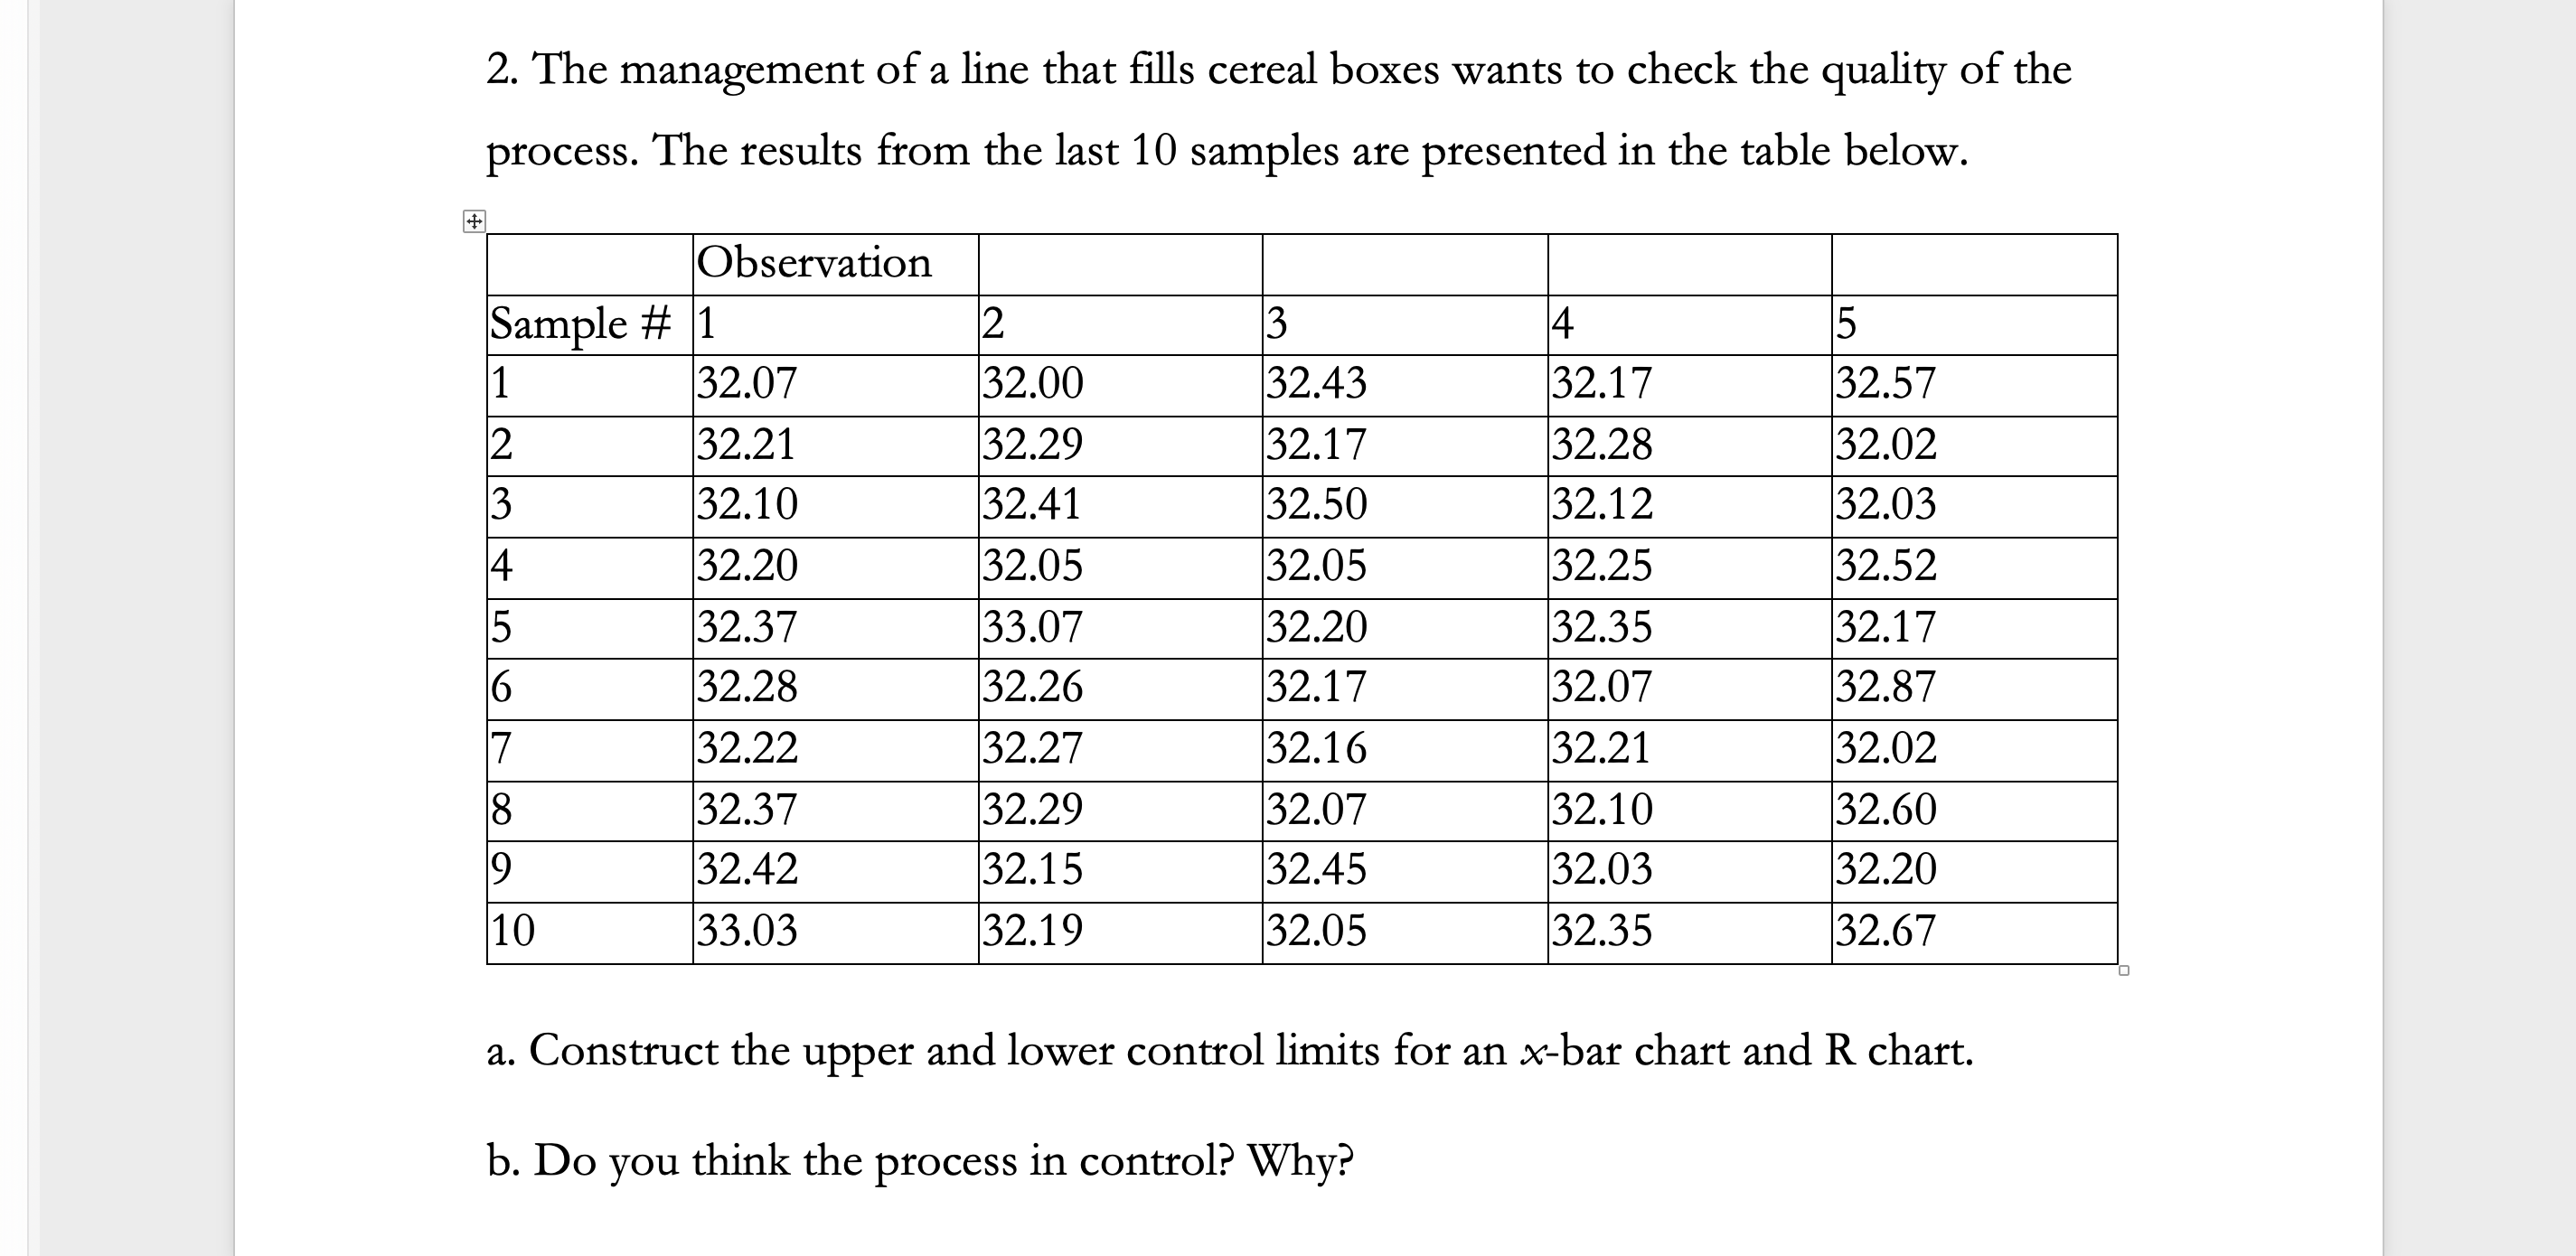
+ 2. The management of a line that fills cereal boxes wants to check the quality of the process. The results from the last 10 samples are presented in the table below. Sample # 1 1 12 13 4 LO Observation 6 17 8 9 10 32.07 32.21 32.10 32.20 32.37 32.28 32.22 32.37 32.42 33.03 12 32.00 32.29 32.41 32.05 33.07 32.26 32.27 32.29 32.15 32.19 3 32.43 32.17 32.50 32.05 32.20 32.17 32.16 32.07 32.45 32.05 4 32.17 32.28 32.12 32.25 32.35 32.07 32.21 32.10 32.03 32.35 15 32.57 32.02 32.03 32.52 32.17 32.87 32.02 32.60 32.20 32.67 a. Construct the upper and lower control limits for an x-bar chart and R chart. b. Do you think the process in control? Why?
Step by Step Solution
There are 3 Steps involved in it
Step: 1

Get Instant Access to Expert-Tailored Solutions
See step-by-step solutions with expert insights and AI powered tools for academic success
Step: 2

Step: 3

Ace Your Homework with AI
Get the answers you need in no time with our AI-driven, step-by-step assistance
Get StartedRecommended Textbook for
Mathematical Statistics With Applications In R
Authors: Chris P. Tsokos, K.M. Ramachandran
2nd Edition
124171133, 978-0124171138
Students also viewed these General Management questions
Question
Answered: 1 week ago
Question
Answered: 1 week ago
Question
Answered: 1 week ago
Question
Answered: 1 week ago
Question
Answered: 1 week ago
Question
Answered: 1 week ago
Question
Answered: 1 week ago
Question
Answered: 1 week ago
Question
Answered: 1 week ago
Question
Answered: 1 week ago
Question
Answered: 1 week ago
Question
Answered: 1 week ago
Question
Answered: 1 week ago
Question
Answered: 1 week ago
Question
Answered: 1 week ago
Question
Answered: 1 week ago
Question
Answered: 1 week ago
Question
Answered: 1 week ago
Question
Answered: 1 week ago
Question
Answered: 1 week ago
Question
Answered: 1 week ago
View Answer in SolutionInn App


