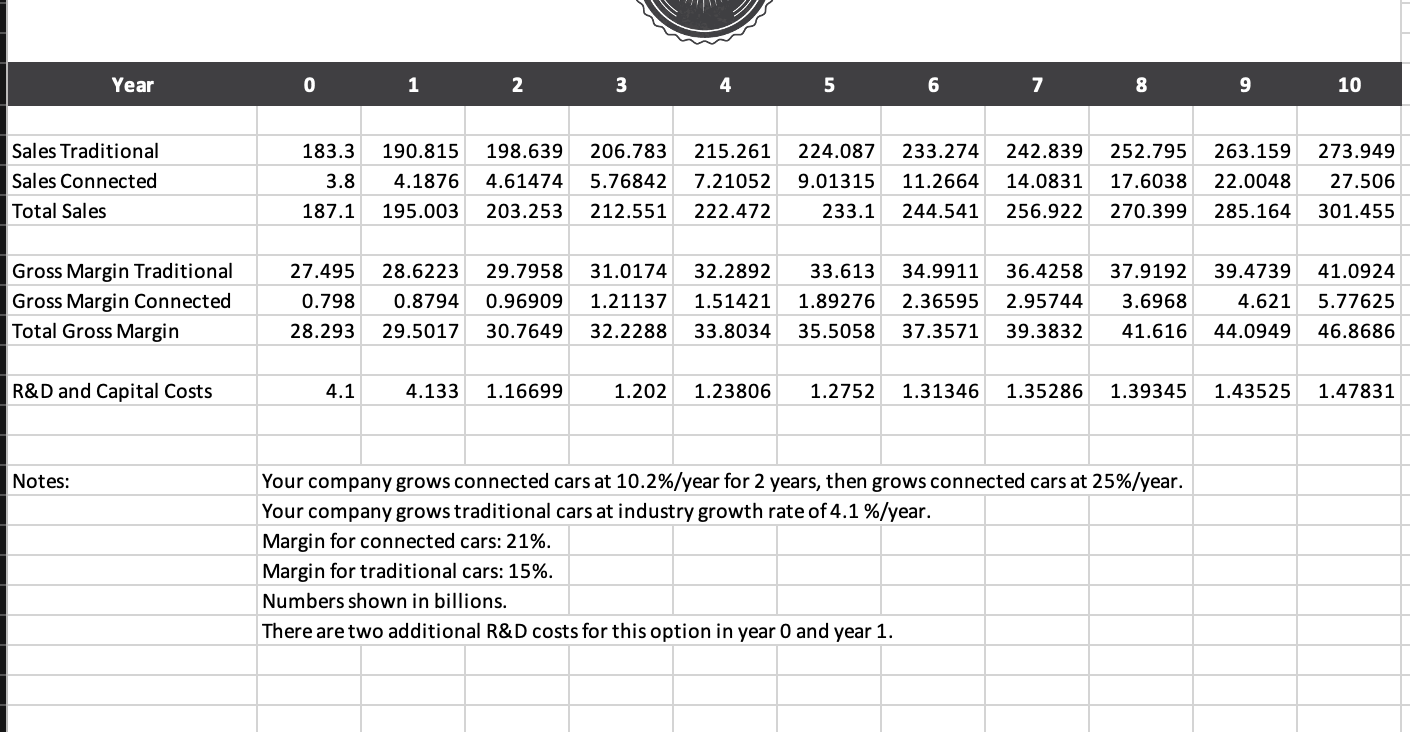
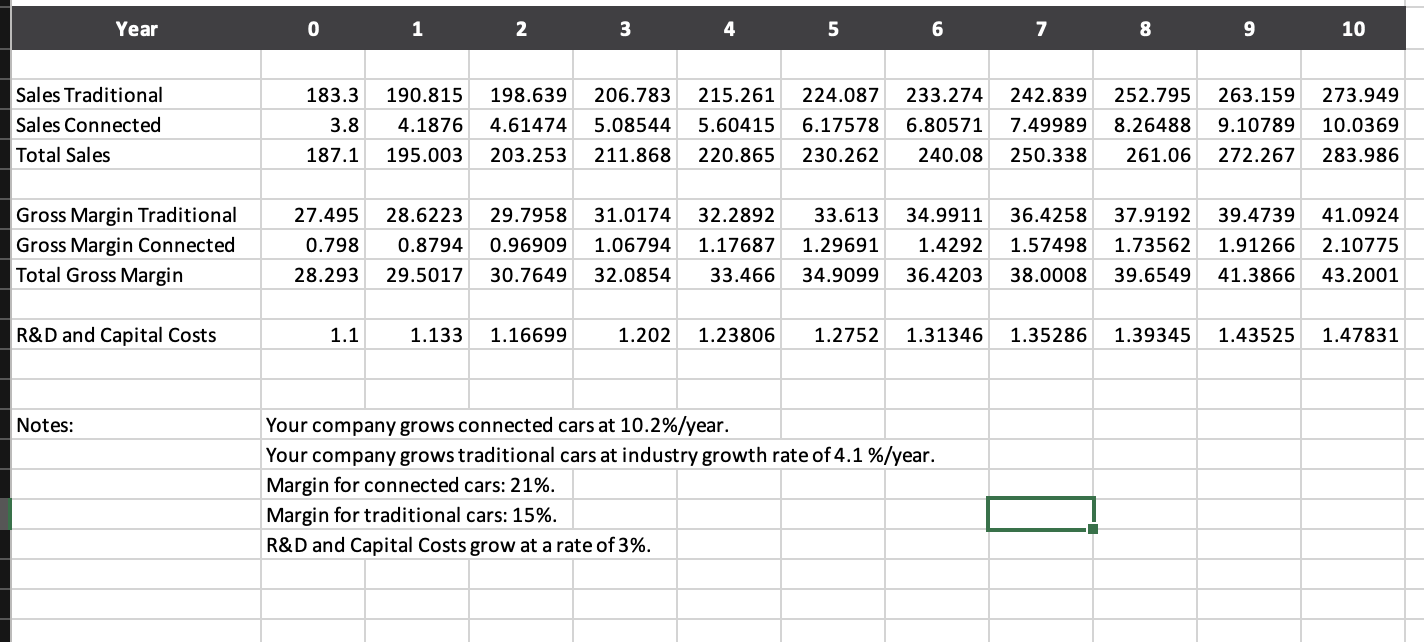
3. Create a chart for gross margin less R&D and capital costs calculations. a. Calculate gross...
Fantastic news! We've Found the answer you've been seeking!
Question:
Transcribed Image Text:
3. Create a chart for gross margin less R&D and capital costs calculations. a. Calculate gross margin less R&D and capital costs for options A and B. b. Graph total gross margin less R&D and capital costs forecasts to compare options A and B on a line chart. Both options should appear on the same chart. Year 0 1 2 3 4 5 6 7 8 9 10 Sales Traditional 183.3 Sales Connected Total Sales 190.815 198.639 206.783 215.261 224.087 233.274 3.8 4.1876 4.61474 5.76842 7.21052 9.01315 187.1 195.003 203.253 212.551 222.472 233.1 242.839 252.795 263.159 273.949 11.2664 14.0831 17.6038 22.0048 27.506 244.541 256.922 270.399 285.164 301.455 Gross Margin Traditional Gross Margin Connected Total Gross Margin 27.495 28.6223 29.7958 31.0174 32.2892 33.613 34.9911 36.4258 37.9192 0.798 0.8794 0.96909 1.21137 1.51421 1.89276 2.36595 2.95744 3.6968 28.293 29.5017 30.7649 32.2288 33.8034 35.5058 37.3571 39.3832 39.4739 41.0924 4.621 5.77625 41.616 44.0949 46.8686 R&D and Capital Costs 4.1 4.133 1.16699 1.202 1.23806 1.2752 1.31346 1.35286 1.39345 1.43525 1.47831 Notes: Your company grows connected cars at 10.2% / year for 2 years, then grows connected cars at 25%/year. Your company grows traditional cars at industry growth rate of 4.1 %/year. Margin for connected cars: 21%. Margin for traditional cars: 15%. Numbers shown in billions. There are two additional R&D costs for this option in year 0 and year 1. Year 0 1 2 3 4 5 6 7 8 9 10 Sales Traditional Sales Connected 183.3 190.815 198.639 206.783 215.261 224.087 233.274 242.839 252.795 263.159 273.949 3.8 4.1876 4.61474 5.08544 5.60415 6.17578 6.80571 7.49989 8.26488 9.10789 10.0369 187.1 195.003 203.253 211.868 220.865 230.262 240.08 250.338 261.06 272.267 283.986 Total Sales Gross Margin Traditional Gross Margin Connected Total Gross Margin 27.495 28.6223 29.7958 31.0174 32.2892 33.613 34.9911 36.4258 37.9192 39.4739 41.0924 0.798 0.8794 0.96909 1.06794 1.17687 1.29691 1.4292 1.57498 1.73562 1.91266 2.10775 28.293 29.5017 30.7649 32.0854 33.466 34.9099 36.4203 38.0008 39.6549 41.3866 43.2001 R&D and Capital Costs 1.1 1.133 1.16699 1.202 1.23806 1.2752 1.31346 1.35286 1.39345 1.43525 1.47831 Notes: Your company grows connected cars at 10.2%/year. Your company grows traditional cars at industry growth rate of 4.1 %/year. Margin for connected cars: 21%. Margin for traditional cars: 15%. R&D and Capital Costs grow at a rate of 3%. 3. Create a chart for gross margin less R&D and capital costs calculations. a. Calculate gross margin less R&D and capital costs for options A and B. b. Graph total gross margin less R&D and capital costs forecasts to compare options A and B on a line chart. Both options should appear on the same chart. Year 0 1 2 3 4 5 6 7 8 9 10 Sales Traditional 183.3 Sales Connected Total Sales 190.815 198.639 206.783 215.261 224.087 233.274 3.8 4.1876 4.61474 5.76842 7.21052 9.01315 187.1 195.003 203.253 212.551 222.472 233.1 242.839 252.795 263.159 273.949 11.2664 14.0831 17.6038 22.0048 27.506 244.541 256.922 270.399 285.164 301.455 Gross Margin Traditional Gross Margin Connected Total Gross Margin 27.495 28.6223 29.7958 31.0174 32.2892 33.613 34.9911 36.4258 37.9192 0.798 0.8794 0.96909 1.21137 1.51421 1.89276 2.36595 2.95744 3.6968 28.293 29.5017 30.7649 32.2288 33.8034 35.5058 37.3571 39.3832 39.4739 41.0924 4.621 5.77625 41.616 44.0949 46.8686 R&D and Capital Costs 4.1 4.133 1.16699 1.202 1.23806 1.2752 1.31346 1.35286 1.39345 1.43525 1.47831 Notes: Your company grows connected cars at 10.2% / year for 2 years, then grows connected cars at 25%/year. Your company grows traditional cars at industry growth rate of 4.1 %/year. Margin for connected cars: 21%. Margin for traditional cars: 15%. Numbers shown in billions. There are two additional R&D costs for this option in year 0 and year 1. Year 0 1 2 3 4 5 6 7 8 9 10 Sales Traditional Sales Connected 183.3 190.815 198.639 206.783 215.261 224.087 233.274 242.839 252.795 263.159 273.949 3.8 4.1876 4.61474 5.08544 5.60415 6.17578 6.80571 7.49989 8.26488 9.10789 10.0369 187.1 195.003 203.253 211.868 220.865 230.262 240.08 250.338 261.06 272.267 283.986 Total Sales Gross Margin Traditional Gross Margin Connected Total Gross Margin 27.495 28.6223 29.7958 31.0174 32.2892 33.613 34.9911 36.4258 37.9192 39.4739 41.0924 0.798 0.8794 0.96909 1.06794 1.17687 1.29691 1.4292 1.57498 1.73562 1.91266 2.10775 28.293 29.5017 30.7649 32.0854 33.466 34.9099 36.4203 38.0008 39.6549 41.3866 43.2001 R&D and Capital Costs 1.1 1.133 1.16699 1.202 1.23806 1.2752 1.31346 1.35286 1.39345 1.43525 1.47831 Notes: Your company grows connected cars at 10.2%/year. Your company grows traditional cars at industry growth rate of 4.1 %/year. Margin for connected cars: 21%. Margin for traditional cars: 15%. R&D and Capital Costs grow at a rate of 3%.
Expert Answer:
Related Book For
Income Tax Fundamentals 2013
ISBN: 9781285586618
31st Edition
Authors: Gerald E. Whittenburg, Martha Altus Buller, Steven L Gill
Posted Date:
Students also viewed these finance questions
-
An alarm is too quiet, so a technician adjusts it to produce a louder note of the same pitch. What effect does this have on the amplitude and on the frequency of the sound? amplitude frequency A...
-
You work as a middle manager for one of the top U.S. producers of luxury and mass-market automobiles and trucks. The company from the course scenario has decided to incorporate internet of things...
-
A bartender employed in a licensed establishment over-serves a patron. As a result of the over-service, the patron physically assaults another patron by striking him with a beer bottle. Identify and...
-
The probability of rolling two odd values in a row. Consider again the three-sided die that gives scores of 1, 2, or 3, each with probability 1/3. Suppose that the results of rolls are independent....
-
Define and discuss the different types of taxes that are as follows. Sales taxes Property taxes Personal Property taxes Excise taxes
-
Assume that $y_{i j}$ are i.i.d and follow a normal distribution with variance $\sigma^{2}$. Under the null hypothesis that a factorial effect 0 , a. Show that \[\frac{\bar{y}_{+}-\bar{y}_{-}}{s / 2}...
-
Three police officers, including Maria Trevizo, were on patrol in Tucson, Arizona, near a neighborhood associated with the Crips gang, when they pulled over a car with a suspended registration. Each...
-
Manchester Company sells equipment on June 1 of the current year for $83,400 cash. Manchester incurred $480 of removal and selling costs on disposal. The equipment cost $150,000 when it was purchased...
-
A buyer purchases 4.5 acres of land for $78,400. An adjoining owner wants to purchase a strip of this land measuring 150 feet by 100 feet. What should this strip cost the adjoining owner if it is...
-
During the second quarter of 2020, real inventories declined by $274 billion, by far the largest decline on record. During the third quarter of 2020, real GDP increased by 35 percent, by far the...
-
In 2023, many firms began using sophisticated artificial intelligence (AI) programs, such as Chat GPT, called chatbots. For example, an article in the Wall Street Journal discussed the use of...
-
An article on barrons.com observed that the U.S. dollar has been droppingand thats good news for the stock market and companies that get a large chunk of their sales from overseas. a. What does the...
-
In 2023, an article in the Financial Times quoted Michael Hicks, an economics professor at Indianas Ball State University, as saying that RVs are a classic disposable income and interest rate...
-
Thor Industries manufactures Airstream and other recreational vehicles (RVs). In In June 2023, an article in the Wall Street Journal stated that the inventories of RVs held by Thor dealers had risen...
-
Discuss the environmental, strategic, and organizational changes that occurred over the life of Andersen. Read the case study Arthur Andersen LLP and answer the following question:
-
Use nodal analysis to determine voltages v1, v2, and v3 in the circuit Fig. 3.76. Figure 3.76 4 S 3i, 2 A 4A
-
This exercise considers the data described in the Section 13.2.2 ratemaking classification example using data in Table 13.3 Table 13.3 . a. Fit a gamma regression model using a log-link function with...
-
This exercise considers data from the Medical Expenditure Panel Survey (MEPS) described in Exercise 1.1 and Section 11.4. Our dependent variable consists of the number of outpatient (COUNTOP) visits....
-
Verify that the Tweedie distribution is a member of the linear exponential family of distributions by checking equation (13.9). In particular, provide an expression for \(S(y, \phi)\) (note that...
Study smarter with the SolutionInn App