

Question
3. The game of baseball is often analyzed using Markov models. The state of the game can be represented by listing bases that have
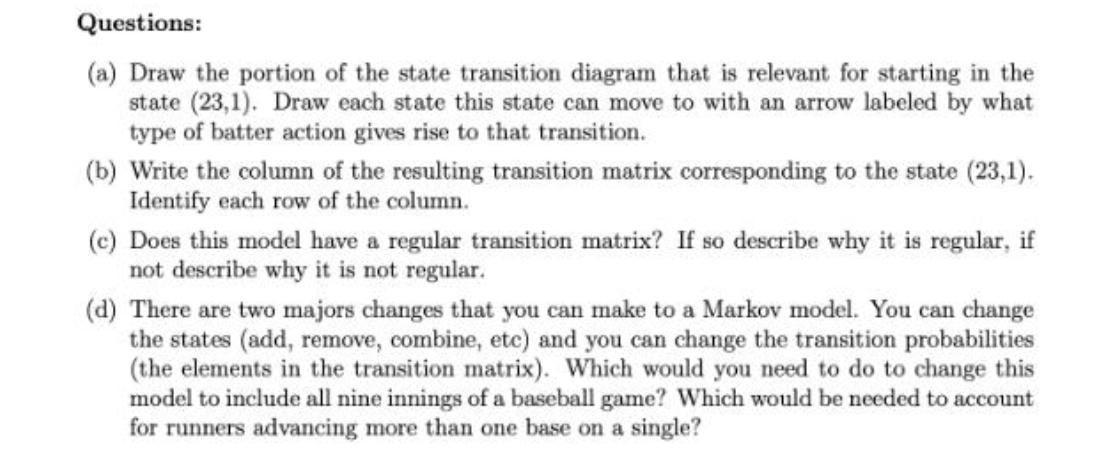
3. The game of baseball is often analyzed using Markov models. The state of the game can be represented by listing bases that have runners and keeping track of how many outs there are. There are three bases that can have a runner, so there are 23 = 8 possible runner configurations. Let's order them as: 0 1 2 3 12 13 23 123 where 0 means no runners, 12 means runners on first and second base, etc. There are 3 outs in an inning so it is possible to be in each of these 8 runner situations with 0, 1 or 2 outs. That makes 24 "live" states. Let's denote states by two numbers, e.g. (12,0) for runners on first and second base with 0 outs; (3,2) for 2 outs and a runner on third base; (123,2) for runners on all bases (bases loaded) and 2 outs. We add one more state to represent the end of the inning. (Each team gets 9 innings total in a standard game.) Here it doesn't matter where runners are, so we only need one state for a total of 25 states. The transition diagram has to account for all possible changes in the states. For simplicity let's ignore for the moment any stolen bases or other exotic changes of state and focus on changes due to the batter. The batter can get out, walk or get a single(go to first base), double(second base), triple (third base) or home run (all bases are cleared). For each of these we have to take into account what happens to the runners as well as the batter. Again to make it simpler let's assume that each runner advances the same amount as the batter. So if the batter gets a double, they go to second base and each runner advances 2 bases. Now for a particular batter we will assume that baseball is a Markov process (history is representative of the future). Specifically, we will use that batter's previous record to find the chance of each batter action. For simplicity we will assume that the batter performs the same in each state (no clutch hitting). Suppose the batter has the following record. Home Run Triple Double Single Walk Outs 38 7.9% 5 1.0% 33 113 194 6.9% 23.5% 20.4% 40.3% 98 Questions: (a) Draw the portion of the state transition diagram that is relevant for starting in the state (23,1). Draw each state this state can move to with an arrow labeled by what type of batter action gives rise to that transition. (b) Write the column of the resulting transition matrix corresponding to the state (23,1). Identify each row of the column. (c) Does this model have a regular transition matrix? If so describe why it is regular, if not describe why it is not regular. (d) There are two majors changes that you can make to a Markov model. You can change the states (add, remove, combine, etc) and you can change the transition probabilities (the elements in the transition matrix). Which would you need to do to change this model to include all nine innings of a baseball game? Which would be needed to account for runners advancing more than one base on a single?
Step by Step Solution
There are 3 Steps involved in it
Step: 1

Get Instant Access with AI-Powered Solutions
See step-by-step solutions with expert insights and AI powered tools for academic success
Step: 2

Step: 3
Ace Your Homework with AI
Get the answers you need in no time with our AI-driven, step-by-step assistance
Get Started
Markov Chains And Decision Processes For Engineers And Manager
Authors: Theodore J. Sheskin
1st Edition
1420051113, 9781420051117