

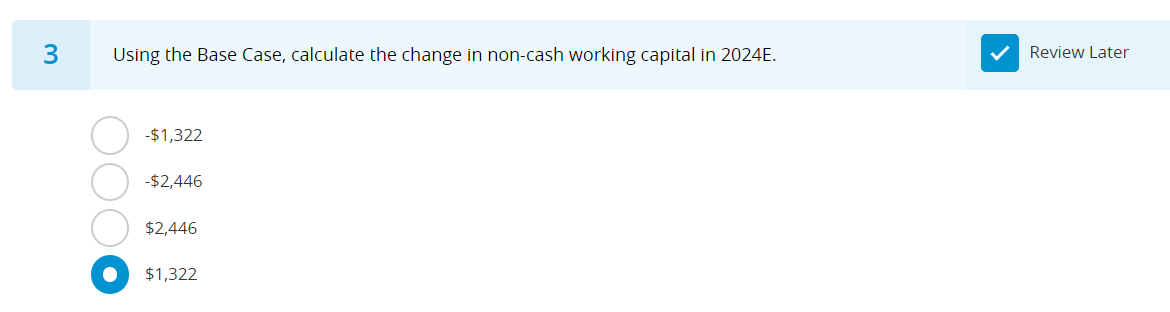
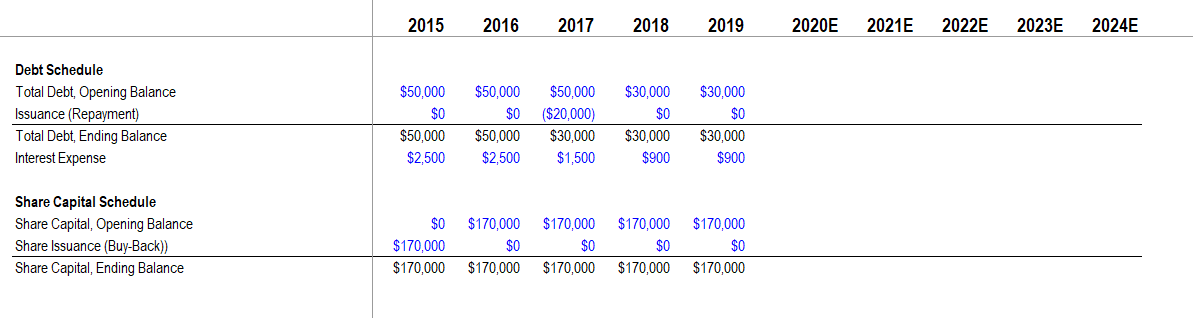
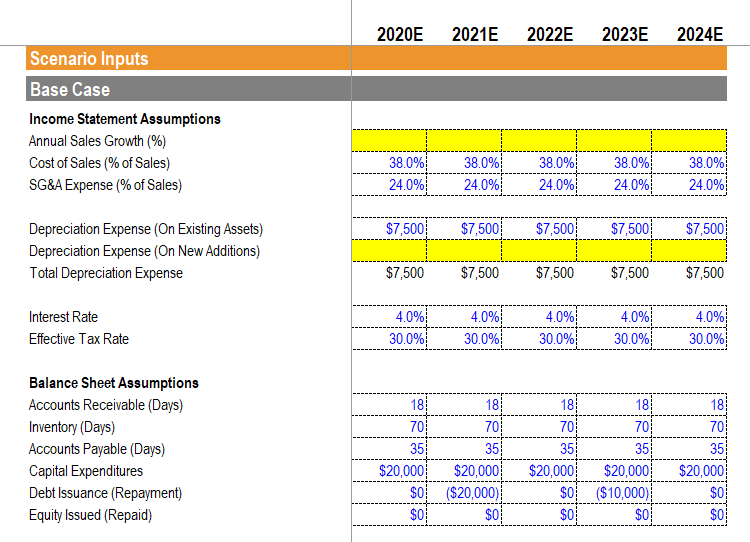
3 Using the Base Case, calculate the change in non-cash working capital in 2024E. -$1,322...
Fantastic news! We've Found the answer you've been seeking!
Question:
Transcribed Image Text:
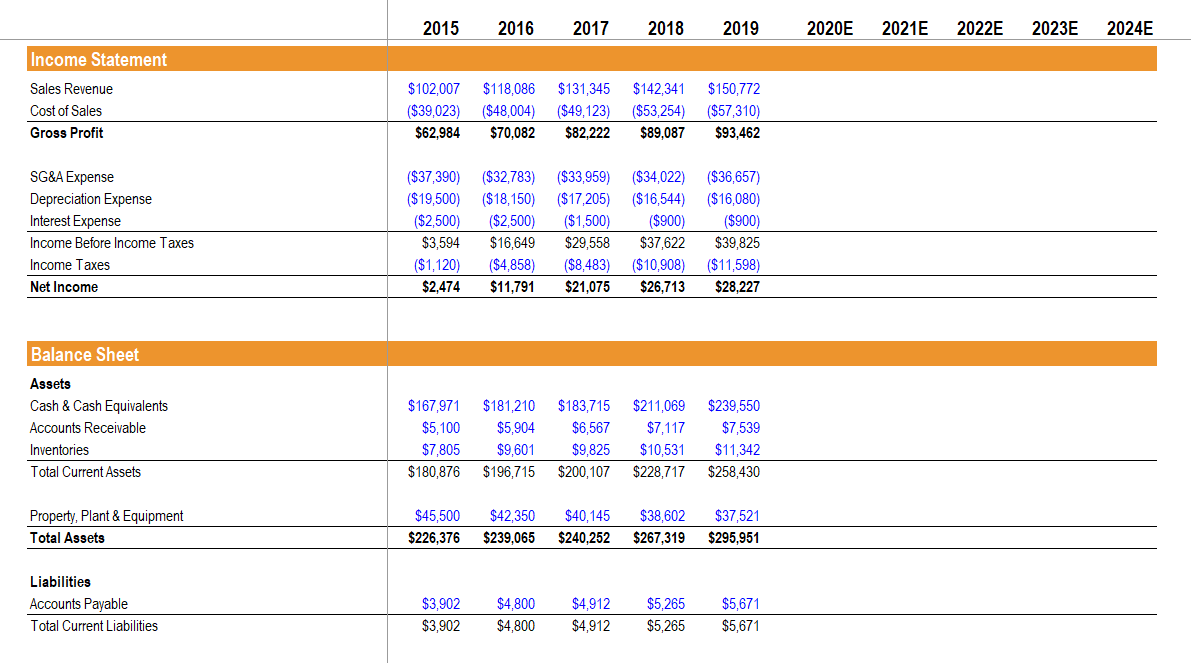
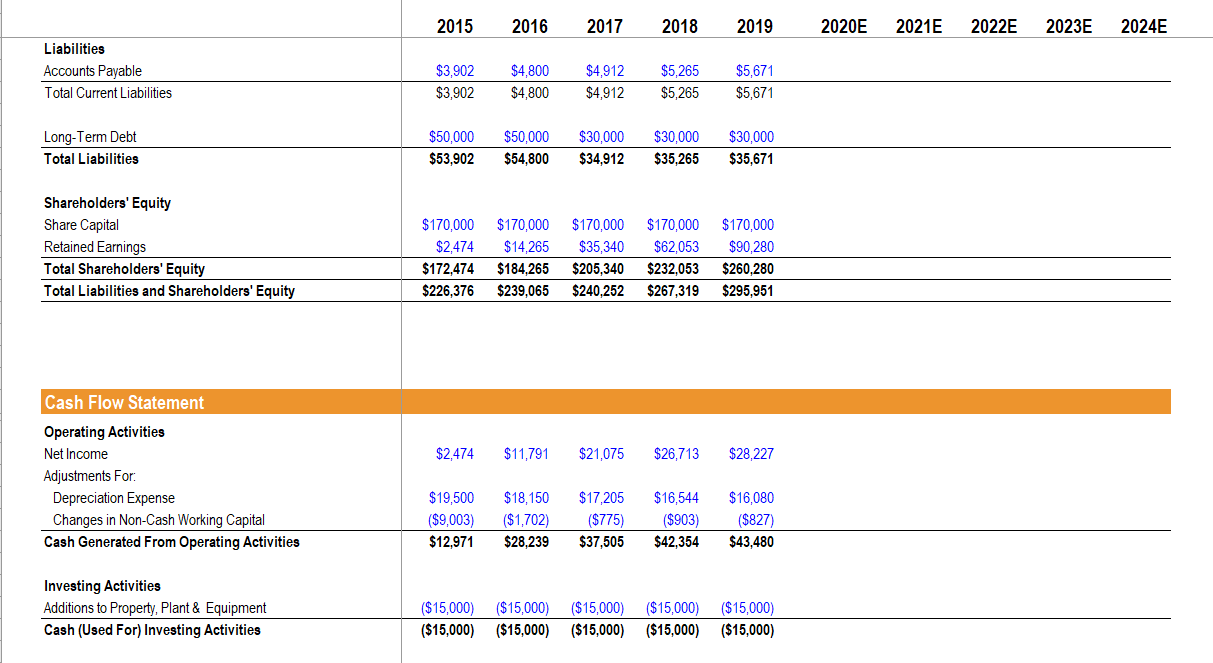
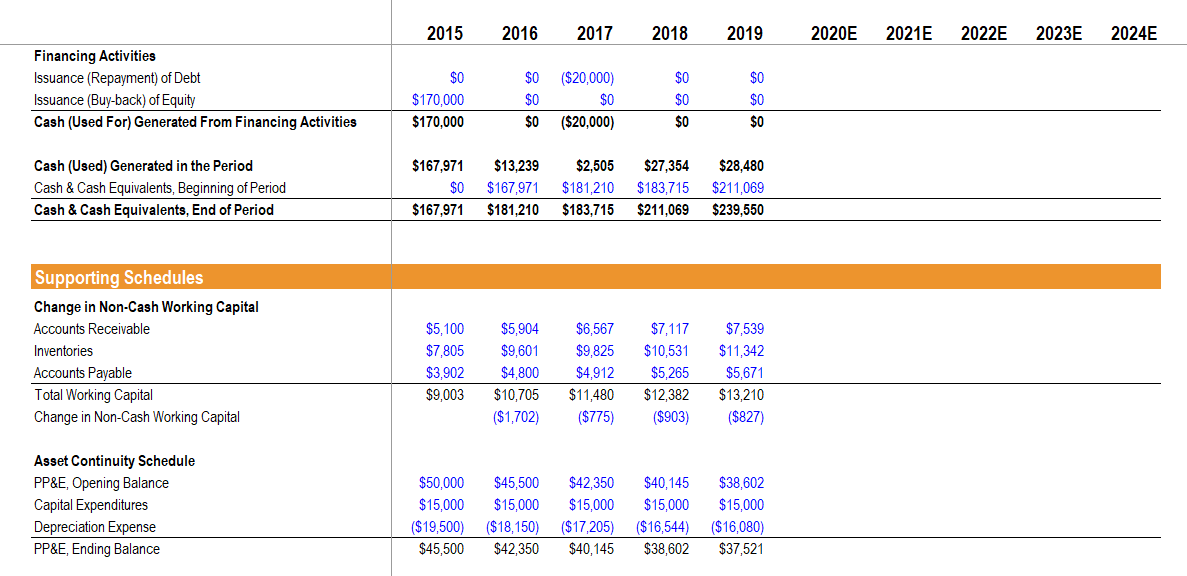
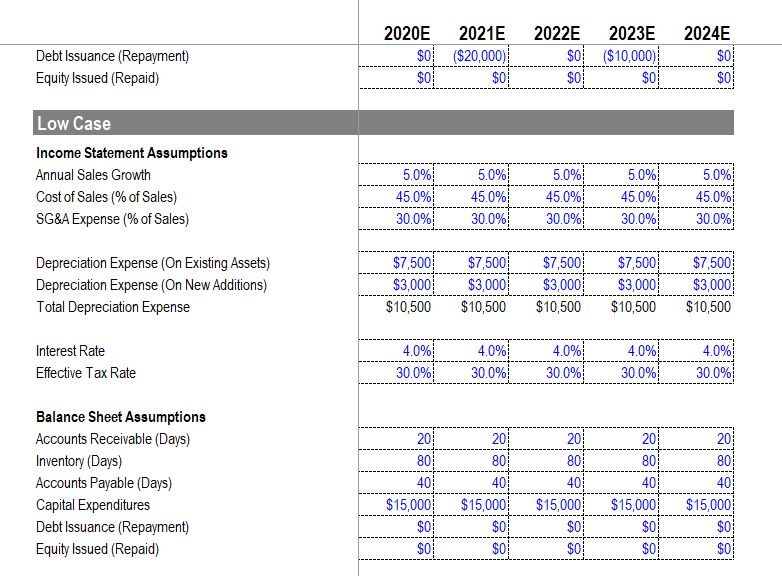
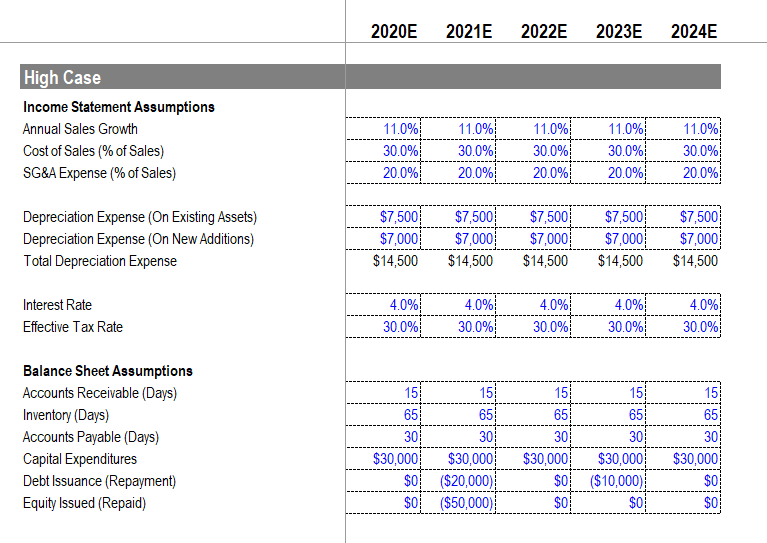
3 Using the Base Case, calculate the change in non-cash working capital in 2024E. ● -$1,322 -$2,446 $2,446 $1,322 Review Later Income Statement Sales Revenue Cost of Sales Gross Profit SG&A Expense Depreciation Expense Interest Expense Income Before Income Taxes Income Taxes Net Income Balance Sheet Assets Cash & Cash Equivalents Accounts Receivable Inventories Total Current Assets Property, Plant & Equipment Total Assets Liabilities Accounts Payable Total Current Liabilities 2015 2016 2017 2018 2019 $102,007 $118,086 $131,345 $142,341 $150,772 ($39,023) ($48,004) ($49,123) ($53,254) ($57,310) $62,984 $70,082 $82,222 $89,087 $93,462 ($16,080) ($37,390) ($32,783) ($33,959) ($34,022) ($36,657) ($19,500) ($18,150) ($17,205) ($16,544) ($2,500) ($1,500) ($900) $16,649 $29,558 $37,622 ($2,500) $3,594 ($1,120) $2,474 $45,500 $226,376 ($4,858) ($8,483) ($10,908) $11,791 $21,075 $26,713 $167,971 $181,210 $183,715 $211,069 $5,904 $6,567 $7,117 $5,100 $7,805 $9,601 $9,825 $10,531 $180,876 $196,715 $200,107 $228,717 $42,350 $40,145 $38,602 $239,065 $240,252 $267,319 ($900) $39,825 ($11,598) $28,227 $239,550 $7,539 $11,342 $258,430 $37,521 $295,951 $3,902 $4,800 $4,912 $5,265 $5,671 $3,902 $4,800 $4,912 $5,265 $5,671 2020E 2021E 2022E 2023E 2024E Liabilities Accounts Payable Total Current Liabilities Long-Term Debt Total Liabilities Shareholders' Equity Share Capital Retained Earnings Total Shareholders' Equity Total Liabilities and Shareholders' Equity Cash Flow Statement Operating Activities Net Income Adjustments For: Depreciation Expense Changes in Non-Cash Working Capital Cash Generated From Operating Activities Investing Activities Additions to Property, Plant & Equipment Cash (Used For) Investing Activities 2015 $3,902 $3,902 $170,000 $2,474 $172,474 $226,376 2016 2017 2018 2019 $50,000 $50,000 $53,902 $54,800 $34,912 $2,474 $4,800 $4,912 $5,265 $5,671 $4,800 $4,912 $5,265 $5,671 $30,000 $30,000 $30,000 $35,265 $35,671 $170,000 $170,000 $170,000 $170,000 $14,265 $35,340 $62,053 $90,280 $260,280 $184,265 $205,340 $232,053 $239,065 $240.252 $267,319 $295,951 $11,791 $21,075 $26,713 $28,227 $19,500 $18,150 $17,205 $16,544 ($9,003) ($1,702) ($775) ($903) $12,971 $28,239 $37,505 $42,354 $16,080 ($827) $43,480 ($15,000) ($15,000) ($15,000) ($15,000) ($15,000) ($15,000) ($15,000) ($15,000) ($15,000) ($15,000) 2020E 2021E 2022E 2023E 2024E Financing Activities Issuance (Repayment) of Debt Issuance (Buy-back) of Equity Cash (Used For) Generated From Financing Activities Cash (Used) Generated in the Period Cash & Cash Equivalents, Beginning of Period Cash & Cash Equivalents, End of Period Supporting Schedules Change in Non-Cash Working Capital Accounts Receivable Inventories Accounts Payable Total Working Capital Change in Non-Cash Working Capital Asset Continuity Schedule PP&E, Opening Balance Capital Expenditures Depreciation Expense PP&E, Ending Balance 2015 $0 $170,000 $170,000 $167,971 $167,971 2016 2017 ($20,000) $0 $3,902 $9,003 $0 $0 $0 ($20,000) 2018 $0 $0 $0 $2,505 $27,354 $28,480 $13,239 $0 $167,971 $181,210 $183,715 $211,069 $181,210 $183,715 $211,069 $239,550 $5,100 $5,904 $6,567 $7,117 $7,805 $9,601 $9,825 $10,531 $4,800 $4,912 $5,265 $10,705 $11,480 $12,382 ($1,702) ($775) ($903) 2019 $0 $0 $0 $7,539 $11,342 $5,671 $13,210 ($827) $50,000 $45,500 $42,350 $40,145 $38,602 $15,000 $15,000 $15,000 $15,000 $15,000 ($19,500) ($18,150) ($17,205) ($16,544) ($16,080) $45,500 $42,350 $40,145 $38,602 $37,521 2020E 2021E 2022E 2023E 2024E Debt Schedule Total Debt, Opening Balance Issuance (Repayment) Total Debt, Ending Balance Interest Expense Share Capital Schedule Share Capital, Opening Balance Share Issuance (Buy-Back)) Share Capital, Ending Balance 2015 $50,000 $0 $50,000 $2,500 2016 2017 2018 $30,000 $50,000 $50,000 $0 ($20,000) $50,000 $30,000 $30,000 $0 $2,500 $1,500 $900 $0 $170,000 $170,000 $0 $170,000 $170,000 $170,000 $170,000 $0 $0 $170,000 $170,000 2019 $30,000 $0 $30,000 $900 $170,000 $0 $170,000 2020E 2021E 2022E 2023E 2024E Scenario Inputs Base Case Income Statement Assumptions Annual Sales Growth (%) Cost of Sales (% of Sales) SG&A Expense (% of Sales) Depreciation Expense (On Existing Assets) Depreciation Expense (On New Additions) Total Depreciation Expense Interest Rate Effective Tax Rate Balance Sheet Assumptions Accounts Receivable (Days) Inventory (Days) Accounts Payable (Days) Capital Expenditures Debt Issuance (Repayment) Equity Issued (Repaid) 2020E 2021E 38.0% 24.0% $7,500 $7,500 4.0% 30.0% 18 70 35 $20,000 $0 $0 38.0% 24.0% $7,500 $7,500 $7,500 4.0% 30.0% 18 70 35 2022E 2023E 2024E $20,000 ($20,000) $0 38.0% 24.0% 4.0%! $7,500 $7,500 30.0% 38.0% 24.0% 18 70 35 $20,000 $0 $0 $7,500 4.0% 30.0% 18 70 35 $20,000 ($10,000) $0 38.0% 24.0% $7,500 $7,500 4.0% 30.0% 18 70 35 $20,000 $0 $0 Debt Issuance (Repayment) Equity Issued (Repaid) Low Case Income Statement Assumptions Annual Sales Growth Cost of Sales (% of Sales) SG&A Expense (% of Sales) Depreciation Expense (On Existing Assets) Depreciation Expense (On New Additions) Total Depreciation Expense Interest Rate Effective Tax Rate Balance Sheet Assumptions Accounts Receivable (Days) Inventory (Days) Accounts Payable (Days) Capital Expenditures Debt Issuance (Repayment) Equity Issued (Repaid) 2020E 2021E ($20,000) $0 $0 $0 5.0% 45.0% 30.0% 4.0% 30.0% 5.0%! 20 80 40 $15,000 $0 $0 45.0% 30.0% 4.0%! 2022E 2023E $0 ($10,000) $0 $0 30.0% 5.0%! $7,500 $7,500 $3,000 $3,000 $7,500 $7,500 $7,500 $3,000 $3,000 $3,000 $10,500 $10,500 $10,500 $10,500 $10,500 20 80 40 45.0% 30.0% 4.0% 30.0% 201 80 40 $15,000 $15,000 $0 $0 5.0% 45.0% 30.0% $0 $0 4.0% 30.0% 2024E $0 $0 20 80 40 $15,000 $0 $0 5.0% 45.0% 30.0% 4.0% 30.0% 20 80 40 $15,000 $0 $0 High Case Income Statement Assumptions Annual Sales Growth Cost of Sales (% of Sales) SG&A Expense (% of Sales) Depreciation Expense (On Existing Assets) Depreciation Expense (On New Additions) Total Depreciation Expense Interest Rate Effective Tax Rate Balance Sheet Assumptions Accounts Receivable (Days) Inventory (Days) Accounts Payable (Days) Capital Expenditures Debt Issuance (Repayment) Equity Issued (Repaid) 2020E 2021E 11.0% 30.0% 20.0% 4.0% 30.0% 11.0% 30.0% 20.0% 15 65 30 $30,000 $0 $0 $7,500 $7,500 $7,500 $7,500 $7,000 $7,000 $7,000 $7,000 $14,500 $14,500 $14,500 $14,500 4.0% 30.0% 15! 65 30 2022E 2023E $30,000 ($20,000) ($50,000) 11.0% 30.0% 20.0% 4.0% 30.0% 11.0% 30.0%! 20.0% 15 65 30 $30,000 $0 $0 4.0% 30.0% 15 65 30 $30,000 ($10,000) $0 2024E 11.0% 30.0% 20.0% $7,500 $7,000 $14,500 4.0% 30.0% 15! 65 30 $30,000 $0 $0 3 Using the Base Case, calculate the change in non-cash working capital in 2024E. ● -$1,322 -$2,446 $2,446 $1,322 Review Later Income Statement Sales Revenue Cost of Sales Gross Profit SG&A Expense Depreciation Expense Interest Expense Income Before Income Taxes Income Taxes Net Income Balance Sheet Assets Cash & Cash Equivalents Accounts Receivable Inventories Total Current Assets Property, Plant & Equipment Total Assets Liabilities Accounts Payable Total Current Liabilities 2015 2016 2017 2018 2019 $102,007 $118,086 $131,345 $142,341 $150,772 ($39,023) ($48,004) ($49,123) ($53,254) ($57,310) $62,984 $70,082 $82,222 $89,087 $93,462 ($16,080) ($37,390) ($32,783) ($33,959) ($34,022) ($36,657) ($19,500) ($18,150) ($17,205) ($16,544) ($2,500) ($1,500) ($900) $16,649 $29,558 $37,622 ($2,500) $3,594 ($1,120) $2,474 $45,500 $226,376 ($4,858) ($8,483) ($10,908) $11,791 $21,075 $26,713 $167,971 $181,210 $183,715 $211,069 $5,904 $6,567 $7,117 $5,100 $7,805 $9,601 $9,825 $10,531 $180,876 $196,715 $200,107 $228,717 $42,350 $40,145 $38,602 $239,065 $240,252 $267,319 ($900) $39,825 ($11,598) $28,227 $239,550 $7,539 $11,342 $258,430 $37,521 $295,951 $3,902 $4,800 $4,912 $5,265 $5,671 $3,902 $4,800 $4,912 $5,265 $5,671 2020E 2021E 2022E 2023E 2024E Liabilities Accounts Payable Total Current Liabilities Long-Term Debt Total Liabilities Shareholders' Equity Share Capital Retained Earnings Total Shareholders' Equity Total Liabilities and Shareholders' Equity Cash Flow Statement Operating Activities Net Income Adjustments For: Depreciation Expense Changes in Non-Cash Working Capital Cash Generated From Operating Activities Investing Activities Additions to Property, Plant & Equipment Cash (Used For) Investing Activities 2015 $3,902 $3,902 $170,000 $2,474 $172,474 $226,376 2016 2017 2018 2019 $50,000 $50,000 $53,902 $54,800 $34,912 $2,474 $4,800 $4,912 $5,265 $5,671 $4,800 $4,912 $5,265 $5,671 $30,000 $30,000 $30,000 $35,265 $35,671 $170,000 $170,000 $170,000 $170,000 $14,265 $35,340 $62,053 $90,280 $260,280 $184,265 $205,340 $232,053 $239,065 $240.252 $267,319 $295,951 $11,791 $21,075 $26,713 $28,227 $19,500 $18,150 $17,205 $16,544 ($9,003) ($1,702) ($775) ($903) $12,971 $28,239 $37,505 $42,354 $16,080 ($827) $43,480 ($15,000) ($15,000) ($15,000) ($15,000) ($15,000) ($15,000) ($15,000) ($15,000) ($15,000) ($15,000) 2020E 2021E 2022E 2023E 2024E Financing Activities Issuance (Repayment) of Debt Issuance (Buy-back) of Equity Cash (Used For) Generated From Financing Activities Cash (Used) Generated in the Period Cash & Cash Equivalents, Beginning of Period Cash & Cash Equivalents, End of Period Supporting Schedules Change in Non-Cash Working Capital Accounts Receivable Inventories Accounts Payable Total Working Capital Change in Non-Cash Working Capital Asset Continuity Schedule PP&E, Opening Balance Capital Expenditures Depreciation Expense PP&E, Ending Balance 2015 $0 $170,000 $170,000 $167,971 $167,971 2016 2017 ($20,000) $0 $3,902 $9,003 $0 $0 $0 ($20,000) 2018 $0 $0 $0 $2,505 $27,354 $28,480 $13,239 $0 $167,971 $181,210 $183,715 $211,069 $181,210 $183,715 $211,069 $239,550 $5,100 $5,904 $6,567 $7,117 $7,805 $9,601 $9,825 $10,531 $4,800 $4,912 $5,265 $10,705 $11,480 $12,382 ($1,702) ($775) ($903) 2019 $0 $0 $0 $7,539 $11,342 $5,671 $13,210 ($827) $50,000 $45,500 $42,350 $40,145 $38,602 $15,000 $15,000 $15,000 $15,000 $15,000 ($19,500) ($18,150) ($17,205) ($16,544) ($16,080) $45,500 $42,350 $40,145 $38,602 $37,521 2020E 2021E 2022E 2023E 2024E Debt Schedule Total Debt, Opening Balance Issuance (Repayment) Total Debt, Ending Balance Interest Expense Share Capital Schedule Share Capital, Opening Balance Share Issuance (Buy-Back)) Share Capital, Ending Balance 2015 $50,000 $0 $50,000 $2,500 2016 2017 2018 $30,000 $50,000 $50,000 $0 ($20,000) $50,000 $30,000 $30,000 $0 $2,500 $1,500 $900 $0 $170,000 $170,000 $0 $170,000 $170,000 $170,000 $170,000 $0 $0 $170,000 $170,000 2019 $30,000 $0 $30,000 $900 $170,000 $0 $170,000 2020E 2021E 2022E 2023E 2024E Scenario Inputs Base Case Income Statement Assumptions Annual Sales Growth (%) Cost of Sales (% of Sales) SG&A Expense (% of Sales) Depreciation Expense (On Existing Assets) Depreciation Expense (On New Additions) Total Depreciation Expense Interest Rate Effective Tax Rate Balance Sheet Assumptions Accounts Receivable (Days) Inventory (Days) Accounts Payable (Days) Capital Expenditures Debt Issuance (Repayment) Equity Issued (Repaid) 2020E 2021E 38.0% 24.0% $7,500 $7,500 4.0% 30.0% 18 70 35 $20,000 $0 $0 38.0% 24.0% $7,500 $7,500 $7,500 4.0% 30.0% 18 70 35 2022E 2023E 2024E $20,000 ($20,000) $0 38.0% 24.0% 4.0%! $7,500 $7,500 30.0% 38.0% 24.0% 18 70 35 $20,000 $0 $0 $7,500 4.0% 30.0% 18 70 35 $20,000 ($10,000) $0 38.0% 24.0% $7,500 $7,500 4.0% 30.0% 18 70 35 $20,000 $0 $0 Debt Issuance (Repayment) Equity Issued (Repaid) Low Case Income Statement Assumptions Annual Sales Growth Cost of Sales (% of Sales) SG&A Expense (% of Sales) Depreciation Expense (On Existing Assets) Depreciation Expense (On New Additions) Total Depreciation Expense Interest Rate Effective Tax Rate Balance Sheet Assumptions Accounts Receivable (Days) Inventory (Days) Accounts Payable (Days) Capital Expenditures Debt Issuance (Repayment) Equity Issued (Repaid) 2020E 2021E ($20,000) $0 $0 $0 5.0% 45.0% 30.0% 4.0% 30.0% 5.0%! 20 80 40 $15,000 $0 $0 45.0% 30.0% 4.0%! 2022E 2023E $0 ($10,000) $0 $0 30.0% 5.0%! $7,500 $7,500 $3,000 $3,000 $7,500 $7,500 $7,500 $3,000 $3,000 $3,000 $10,500 $10,500 $10,500 $10,500 $10,500 20 80 40 45.0% 30.0% 4.0% 30.0% 201 80 40 $15,000 $15,000 $0 $0 5.0% 45.0% 30.0% $0 $0 4.0% 30.0% 2024E $0 $0 20 80 40 $15,000 $0 $0 5.0% 45.0% 30.0% 4.0% 30.0% 20 80 40 $15,000 $0 $0 High Case Income Statement Assumptions Annual Sales Growth Cost of Sales (% of Sales) SG&A Expense (% of Sales) Depreciation Expense (On Existing Assets) Depreciation Expense (On New Additions) Total Depreciation Expense Interest Rate Effective Tax Rate Balance Sheet Assumptions Accounts Receivable (Days) Inventory (Days) Accounts Payable (Days) Capital Expenditures Debt Issuance (Repayment) Equity Issued (Repaid) 2020E 2021E 11.0% 30.0% 20.0% 4.0% 30.0% 11.0% 30.0% 20.0% 15 65 30 $30,000 $0 $0 $7,500 $7,500 $7,500 $7,500 $7,000 $7,000 $7,000 $7,000 $14,500 $14,500 $14,500 $14,500 4.0% 30.0% 15! 65 30 2022E 2023E $30,000 ($20,000) ($50,000) 11.0% 30.0% 20.0% 4.0% 30.0% 11.0% 30.0%! 20.0% 15 65 30 $30,000 $0 $0 4.0% 30.0% 15 65 30 $30,000 ($10,000) $0 2024E 11.0% 30.0% 20.0% $7,500 $7,000 $14,500 4.0% 30.0% 15! 65 30 $30,000 $0 $0
Expert Answer:

Related Book For 
Managerial Accounting
ISBN: 978-0078025518
2nd edition
Authors: Stacey Whitecotton, Robert Libby, Fred Phillips
Posted Date:
Students also viewed these finance questions
-
Using the base case parameters, plot the implied volatility curve you obtain for the base case against that for the case where there is a jump to zero, with the same .
-
Using the base case parameters, plot the implied volatility curve you obtain for the base case against that for the case where there is a jump to zero, with the same . As a base case, assume S =...
-
Using the base case data in question 10, analyze how the value of a loyal customer (VLC) will change if the average customer defection rate varies between 15 and 40 percent (in increments of 5...
-
Carl contributes equipment with a $50,000 adjusted basis and an $80,000 FMV to Cook Corporation for 50 of its 100 shares of stock. His son, Carl Jr., contributes $20,000 cash for the remaining 50...
-
Juicyfruit, Inc., signs a five-year lease for office equipment with Office Solutions. The present value of the lease payments is $20,859. Prepare the journal entry that Juicyfruit records at the...
-
What are the five forms of term insurance?
-
Use the coefficients of the multiple regression equation in Figure 13.5 to predict the lung capacity for a 10-year-old who is 57 inches tall and weighs 90 pounds, at a pressure of 30.2 inches and a...
-
A pump is required for 10 years at a remote location. The pump can be driven by an electric motor if a power line is extended to the site. Otherwise, a gasoline engine will be used. Use an annual...
-
Discuss the implementation of advanced construction automation technologies, including robotics, 3D printing, and autonomous construction vehicles, in improving productivity, efficiency, and safety...
-
As Lush UK implemented the change, how could it measure the effects of leaving and then returning to social media on the achievement of its marketing goals? Lush Fresh Handmade Cosmetics UK sells...
-
Royal Rockrider (RR) purchased land that will be the site of a new luxury condominium complex. RR commissioned preliminary drawings for three different projects: one with 20 condominiums (a small...
-
Luthan Company uses a plantwide predetermined overhead rate of $22.70 per direct labor-hour. This predetermined rate was based on a cost formula that estimated $272,400 of total manufacturing...
-
The Partnership Agreement is critical to a successful business operation as it governs all rights and responsibilities between the partners (owners). In this course, we learned that careful attention...
-
PART 1: Short Answers. Answer any 15 of the following. (Extra credit will be given for answers to questions beyond the required 15) Describe the process by which a site becomes a CERCLAsite. Define...
-
What is the amount of increase in Wright Stewart's total stockholders' equity for the year ended December 31, 2022?
-
Prepare the entry on June 1. (Credit account titles are automatically indented when amount is entered. Do not indent manually.) Date Account Titles and Explanation June 1 Cash Notes Payable eTextbook...
-
It is known that the magnitude of the magnetic field created by a Helmholtz coil is proportional to the current passing through it. For the coils used in our experiment set, the proportionality...
-
Four GWU students have been selected to taste food sold by 3 different food trucks labeled as food truck A, B and C on H & 22nd Streets every Monday for 3-weeks. For each student, food trucks are...
-
Acoma, Inc., has determined a standard direct materials cost per unit of $8(2feetx $4per foot). Last month, Acoma purchased and used 4,200 feet of direct materials for which it paid $15,750. The...
-
How does excess capacity impact a special-order decision?
-
What is a strategic plan and how does it relate to short-and long-term goals?
-
Consider the binary variable version of the fixed effects model in Equation (10.11) except with an additional regressor, \(D 1_{i}\); that is, let \[ Y_{i t}=\beta_{0}+\beta_{1} X_{i t}+\gamma_{1} D...
-
Using the regression in Equation (10.11), what are the slope and intercept for a. Entity 1 in time period 1? b. Entity 1 in time period 3? c. Entity 3 in time period 1? d. Entity 3 in time period 3?...
-
Do the fixed effects regression assumptions in Key Concept 10.3 imply that \(\operatorname{cov}\left(\widetilde{v}_{i t}, \widetilde{v}_{i s} ight)=0\) for \(t eq s\) in Equation (10.28)? Explain....

Study smarter with the SolutionInn App