

30. [-19 Points] DETAILS DEVORESTAT9 7.3.037. A study of the ability of individuals to walk in...
Fantastic news! We've Found the answer you've been seeking!
Question:
Transcribed Image Text:
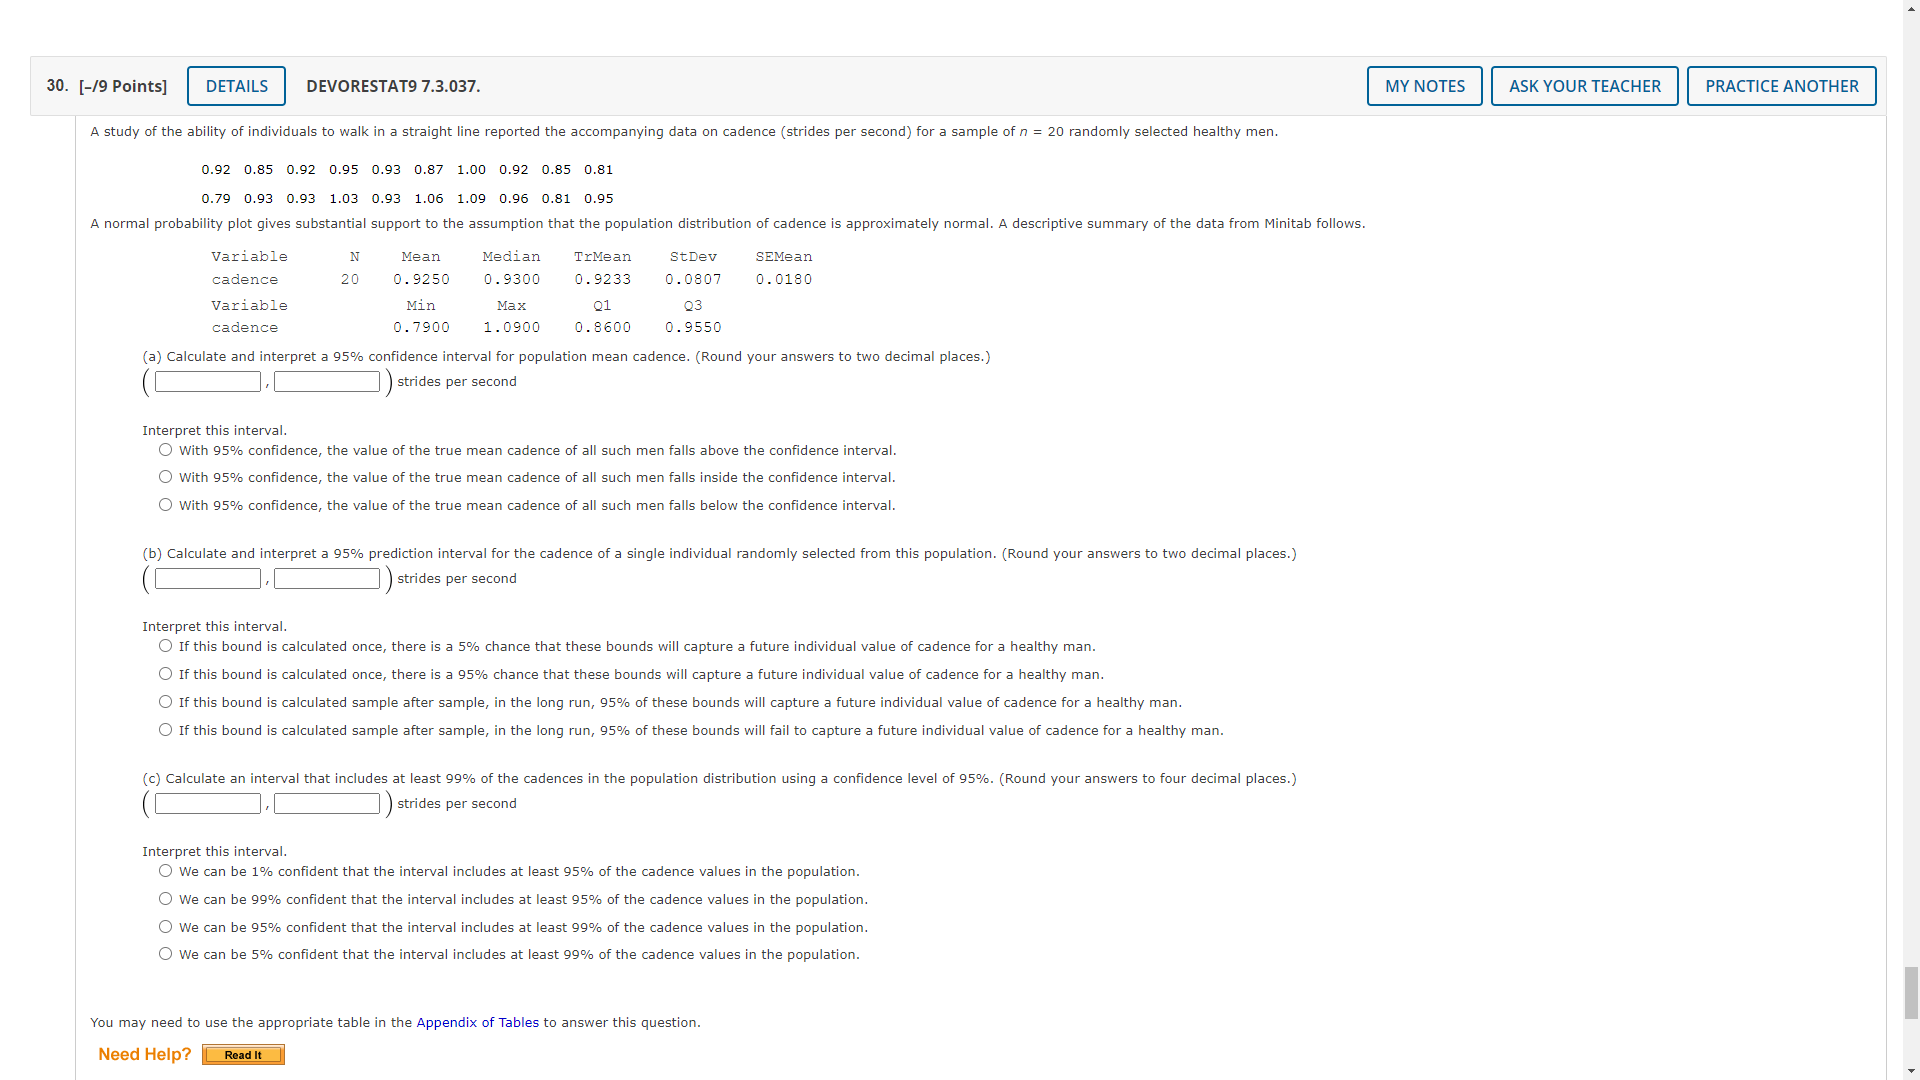
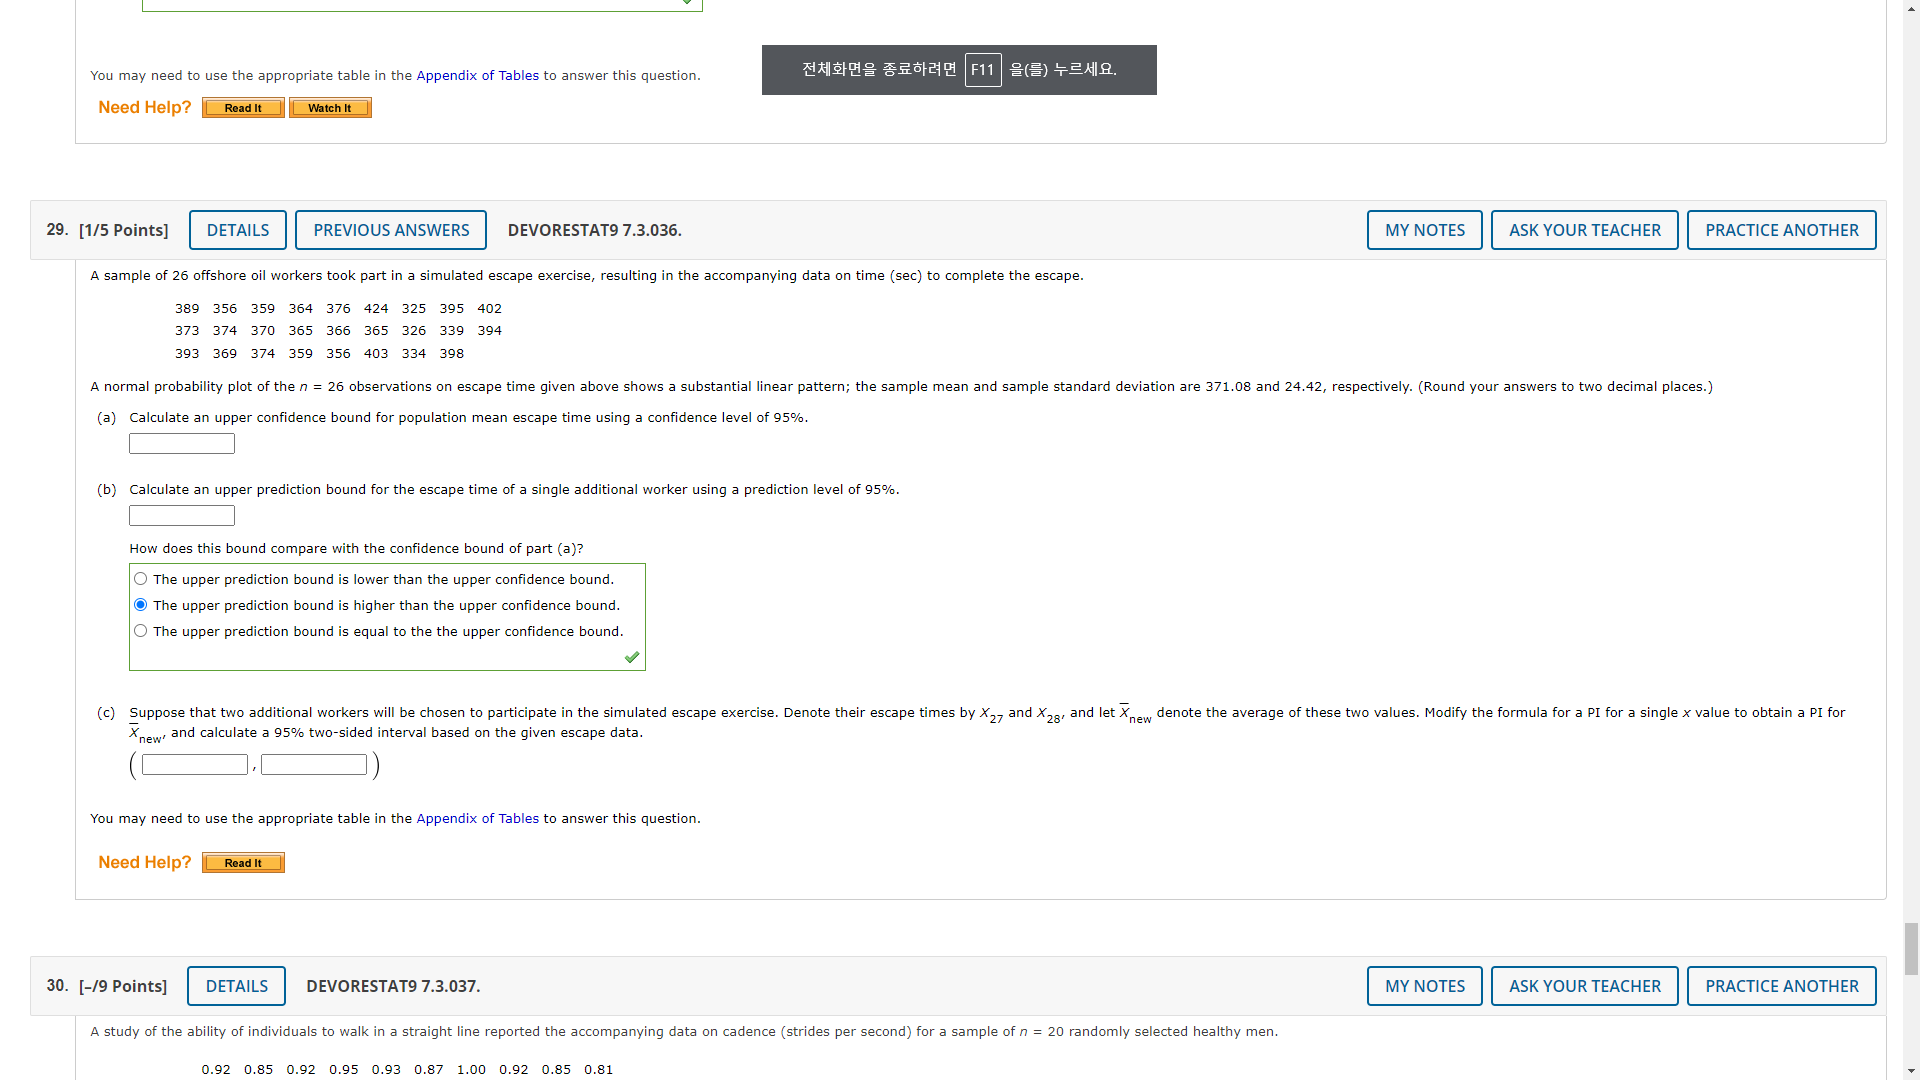
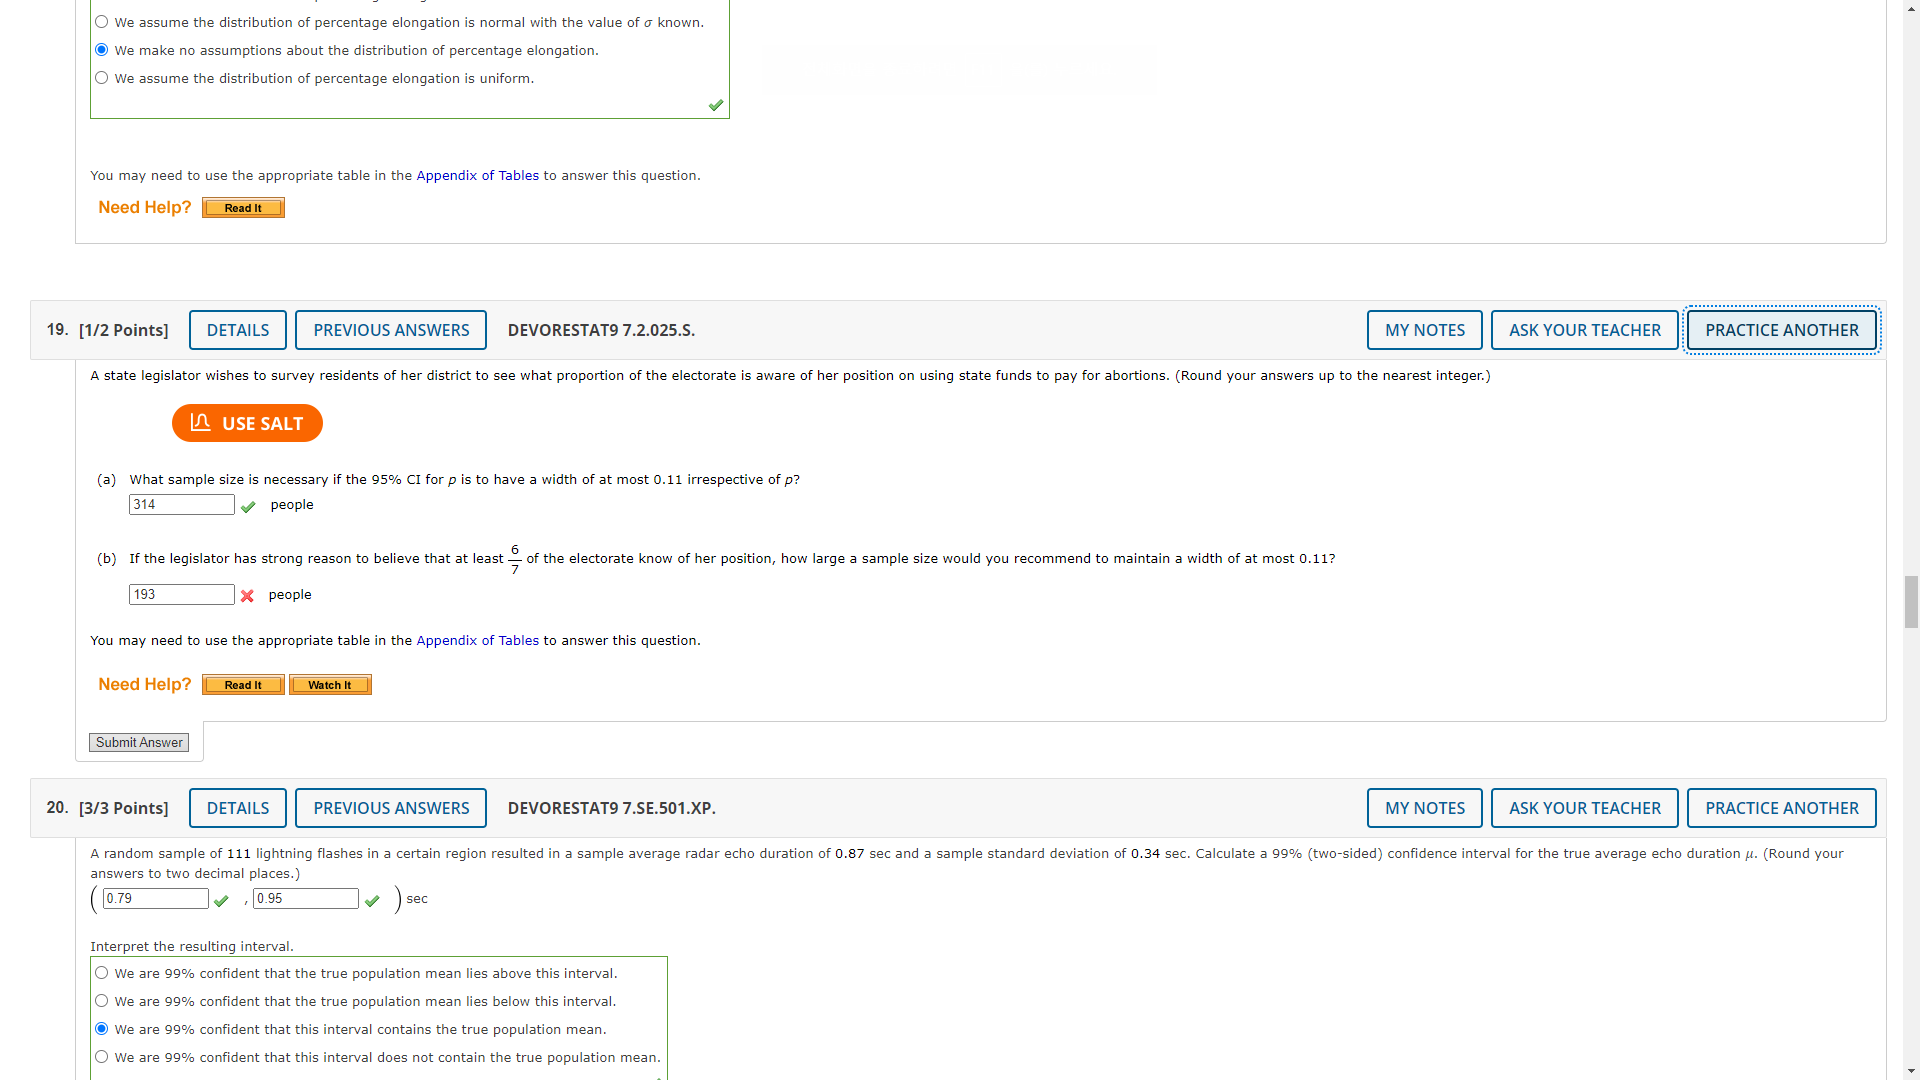
30. [-19 Points] DETAILS DEVORESTAT9 7.3.037. A study of the ability of individuals to walk in a straight line reported the accompanying data on cadence (strides per second) for a sample of n = 20 randomly selected healthy men. 0.92 0.85 0.92 0.95 0.93 0.87 1.00 0.92 0.85 0.81 0.79 0.93 0.93 1.03 0.93 1.06 1.09 0.96 0.81 0.95 A normal probability plot gives substantial support to the assumption that the population distribution of cadence is approximately normal. A descriptive summary of the data from Minitab follows. Variable cadence Variable N Mean 20 0.9250 cadence Min 0.7900 Median 0.9300 Max 1.0900 TrMean 0.9233 Q1 0.8600 StDev 0.0807 Q3 0.9550 SEMean 0.0180 (a) Calculate and interpret a 95% confidence interval for population mean cadence. (Round your answers to two decimal places.) strides per second Interpret this interval. With 95% confidence, the value of the true mean cadence of all such men falls above the confidence interval. With 95% confidence, the value of the true mean cadence of all such men falls inside the confidence interval. with 95% confidence, the value of the true mean cadence of all such men falls below the confidence interval. (b) Calculate and interpret a 95% prediction interval for the cadence of a single individual randomly selected from this population. (Round your answers to two decimal places.) strides per second Interpret this interval. If this bound is calculated once, there is a 5% chance that these bounds will capture a future individual value of cadence for a healthy man. If this bound is calculated once, there is a 95% chance that these bounds will capture a future individual value of cadence for a healthy man. If this bound is calculated sample after sample, in the long run, 95% of these bounds will capture a future individual value of cadence for a healthy man. If this bound is calculated sample after sample, in the long run, 95% of these bounds will fail to capture a future individual value of cadence for a healthy man. (c) Calculate an interval that includes at least 99% of the cadences in the population distribution using a confidence level of 95%. (Round your answers to four decimal places.) strides per second ]): Interpret this interval. We can be 1% confident that the interval includes at least 95% of the cadence values in the population. We can be 99% confident that the interval includes at least 95% of the cadence values in the population. We can be 95% confident that the interval includes at least 99% of the cadence values in the population. We can be 5% confident that the interval includes at least 99% of the cadence values in the population. You may need to use the appropriate table in the Appendix of Tables to answer this question. Need Help? Read It MY NOTES ASK YOUR TEACHER PRACTICE ANOTHER You may need to use the appropriate table in the Appendix of Tables to answer this question. Need Help? 29. [1/5 Points] Read It DETAILS Watch It PREVIOUS ANSWERS DEVORESTAT9 7.3.036. F11 () . MY NOTES ASK YOUR TEACHER PRACTICE ANOTHER A sample of 26 offshore oil workers took part in a simulated escape exercise, resulting in the accompanying data on time (sec) to complete the escape. 389 356 359 364 376 424 325 395 402 373 374 370 365 366 365 326 339 394 393 369 374 359 356 403 334 398 A normal probability plot of the n = 26 observations on escape time given above shows a substantial linear pattern; the sample mean and sample standard deviation are 371.08 and 24.42, respectively. (Round your answers to two decimal places.) (a) Calculate an upper confidence bound for population mean escape time using a confidence level of 95%. (b) Calculate an upper prediction bound for the escape time of a single additional worker using a prediction level of 95%. How does this bound compare with the confidence bound of part (a)? The upper prediction bound is lower than the upper confidence bound. The upper prediction bound is higher than the upper confidence bound. The upper prediction bound is equal to the the upper confidence bound. (c) Suppose that two additional workers will be chosen to participate in the simulated escape exercise. Denote their escape times by X27 and X 28, and let X new denote the average of these two values. Modify the formula for a PI for a single x value to obtain a PI for Xnew and calculate a 95% two-sided interval based on the given escape data. You may need to use the appropriate table in the Appendix of Tables to answer this question. Need Help? Read It 30. [-19 Points] DETAILS DEVORESTAT9 7.3.037. A study of the ability of individuals to walk in a straight line reported the accompanying data on cadence (strides per second) for a sample of n = 20 randomly selected healthy men. 0.92 0.85 0.92 0.95 0.93 0.87 1.00 0.92 0.85 0.81 MY NOTES ASK YOUR TEACHER PRACTICE ANOTHER We assume the distribution of percentage elongation is normal with the value of known. We make no assumptions about the distribution of percentage elongation. We assume the distribution of percentage elongation is uniform. You may need to use the appropriate table in the Appendix of Tables to answer this question. Need Help? Read It 19. [1/2 Points] DETAILS PREVIOUS ANSWERS DEVORESTAT9 7.2.025.S. MY NOTES ASK YOUR TEACHER PRACTICE ANOTHER A state legislator wishes to survey residents of her district to see what proportion of the electorate is aware of her position on using state funds to pay for abortions. (Round your answers up to the nearest integer.) USE SALT (a) What sample size is necessary if the 95% CI for p is to have a width of at most 0.11 irrespective of p? 314 people (b) If the legislator has strong reason to believe that at least- 6 of the electorate know of her position, how large a sample size would you recommend to maintain a width of at most 0.11? 193 X people You may need to use the appropriate table in the Appendix of Tables to answer this question. Need Help? Read It Watch It Submit Answer 20. [3/3 Points] DETAILS PREVIOUS ANSWERS DEVORESTAT9 7.SE.501.XP. MY NOTES ASK YOUR TEACHER PRACTICE ANOTHER A random sample of 111 lightning flashes in a certain region resulted in a sample average radar echo duration of 0.87 sec and a sample standard deviation of 0.34 sec. Calculate a 99% (two-sided) confidence interval for the true average echo duration . (Round your answers to two decimal places.) 0.79 0.95 ) sec sec Interpret the resulting interval. We are 99% confident that the true population mean lies above this interval. We are 99% confident that the true population mean lies below this interval. We are 99% confident that this interval contains the true population mean. We are 99% confident that this interval does not contain the true population mean. 30. [-19 Points] DETAILS DEVORESTAT9 7.3.037. A study of the ability of individuals to walk in a straight line reported the accompanying data on cadence (strides per second) for a sample of n = 20 randomly selected healthy men. 0.92 0.85 0.92 0.95 0.93 0.87 1.00 0.92 0.85 0.81 0.79 0.93 0.93 1.03 0.93 1.06 1.09 0.96 0.81 0.95 A normal probability plot gives substantial support to the assumption that the population distribution of cadence is approximately normal. A descriptive summary of the data from Minitab follows. Variable cadence Variable N Mean 20 0.9250 cadence Min 0.7900 Median 0.9300 Max 1.0900 TrMean 0.9233 Q1 0.8600 StDev 0.0807 Q3 0.9550 SEMean 0.0180 (a) Calculate and interpret a 95% confidence interval for population mean cadence. (Round your answers to two decimal places.) strides per second Interpret this interval. With 95% confidence, the value of the true mean cadence of all such men falls above the confidence interval. With 95% confidence, the value of the true mean cadence of all such men falls inside the confidence interval. with 95% confidence, the value of the true mean cadence of all such men falls below the confidence interval. (b) Calculate and interpret a 95% prediction interval for the cadence of a single individual randomly selected from this population. (Round your answers to two decimal places.) strides per second Interpret this interval. If this bound is calculated once, there is a 5% chance that these bounds will capture a future individual value of cadence for a healthy man. If this bound is calculated once, there is a 95% chance that these bounds will capture a future individual value of cadence for a healthy man. If this bound is calculated sample after sample, in the long run, 95% of these bounds will capture a future individual value of cadence for a healthy man. If this bound is calculated sample after sample, in the long run, 95% of these bounds will fail to capture a future individual value of cadence for a healthy man. (c) Calculate an interval that includes at least 99% of the cadences in the population distribution using a confidence level of 95%. (Round your answers to four decimal places.) strides per second ]): Interpret this interval. We can be 1% confident that the interval includes at least 95% of the cadence values in the population. We can be 99% confident that the interval includes at least 95% of the cadence values in the population. We can be 95% confident that the interval includes at least 99% of the cadence values in the population. We can be 5% confident that the interval includes at least 99% of the cadence values in the population. You may need to use the appropriate table in the Appendix of Tables to answer this question. Need Help? Read It MY NOTES ASK YOUR TEACHER PRACTICE ANOTHER You may need to use the appropriate table in the Appendix of Tables to answer this question. Need Help? 29. [1/5 Points] Read It DETAILS Watch It PREVIOUS ANSWERS DEVORESTAT9 7.3.036. F11 () . MY NOTES ASK YOUR TEACHER PRACTICE ANOTHER A sample of 26 offshore oil workers took part in a simulated escape exercise, resulting in the accompanying data on time (sec) to complete the escape. 389 356 359 364 376 424 325 395 402 373 374 370 365 366 365 326 339 394 393 369 374 359 356 403 334 398 A normal probability plot of the n = 26 observations on escape time given above shows a substantial linear pattern; the sample mean and sample standard deviation are 371.08 and 24.42, respectively. (Round your answers to two decimal places.) (a) Calculate an upper confidence bound for population mean escape time using a confidence level of 95%. (b) Calculate an upper prediction bound for the escape time of a single additional worker using a prediction level of 95%. How does this bound compare with the confidence bound of part (a)? The upper prediction bound is lower than the upper confidence bound. The upper prediction bound is higher than the upper confidence bound. The upper prediction bound is equal to the the upper confidence bound. (c) Suppose that two additional workers will be chosen to participate in the simulated escape exercise. Denote their escape times by X27 and X 28, and let X new denote the average of these two values. Modify the formula for a PI for a single x value to obtain a PI for Xnew and calculate a 95% two-sided interval based on the given escape data. You may need to use the appropriate table in the Appendix of Tables to answer this question. Need Help? Read It 30. [-19 Points] DETAILS DEVORESTAT9 7.3.037. A study of the ability of individuals to walk in a straight line reported the accompanying data on cadence (strides per second) for a sample of n = 20 randomly selected healthy men. 0.92 0.85 0.92 0.95 0.93 0.87 1.00 0.92 0.85 0.81 MY NOTES ASK YOUR TEACHER PRACTICE ANOTHER We assume the distribution of percentage elongation is normal with the value of known. We make no assumptions about the distribution of percentage elongation. We assume the distribution of percentage elongation is uniform. You may need to use the appropriate table in the Appendix of Tables to answer this question. Need Help? Read It 19. [1/2 Points] DETAILS PREVIOUS ANSWERS DEVORESTAT9 7.2.025.S. MY NOTES ASK YOUR TEACHER PRACTICE ANOTHER A state legislator wishes to survey residents of her district to see what proportion of the electorate is aware of her position on using state funds to pay for abortions. (Round your answers up to the nearest integer.) USE SALT (a) What sample size is necessary if the 95% CI for p is to have a width of at most 0.11 irrespective of p? 314 people (b) If the legislator has strong reason to believe that at least- 6 of the electorate know of her position, how large a sample size would you recommend to maintain a width of at most 0.11? 193 X people You may need to use the appropriate table in the Appendix of Tables to answer this question. Need Help? Read It Watch It Submit Answer 20. [3/3 Points] DETAILS PREVIOUS ANSWERS DEVORESTAT9 7.SE.501.XP. MY NOTES ASK YOUR TEACHER PRACTICE ANOTHER A random sample of 111 lightning flashes in a certain region resulted in a sample average radar echo duration of 0.87 sec and a sample standard deviation of 0.34 sec. Calculate a 99% (two-sided) confidence interval for the true average echo duration . (Round your answers to two decimal places.) 0.79 0.95 ) sec sec Interpret the resulting interval. We are 99% confident that the true population mean lies above this interval. We are 99% confident that the true population mean lies below this interval. We are 99% confident that this interval contains the true population mean. We are 99% confident that this interval does not contain the true population mean.
Expert Answer:

Posted Date:
Students also viewed these mathematics questions
-
The following information was drawn from the 2016 accounting records of Ozark Merchandisers: 1. Inventory that had cost $21,200 was sold for $39,900 under terms 2/20, net/30. 2. Customers returned...
-
In Appendix 12B you learned that accounting for other-than-temporary impairments has changed recently. You also learned that these changes were controversial. In fact, two of the five members of the...
-
Use the Binomial Theorem to find the indicated coefficient or term. The coefficient x 3 in the expansion of (2x + 1) 12
-
Which of the following is most likely to be an example of a natural, executable workload model? a. A kernel program b. An instruction mix c. A benchmark d. A synthetic job
-
Hampton Company is considering the addition of a new product to its cosmetics line. The company has three distinctly different options: a skin cream, a bath oil, or a hair coloring gel. Relevant...
-
While running, your heart's stroke volume can increase by what two mechanisms?
-
Give an example how a flight operational quality assurance (FOQA) be used to improve aviation safety. The data gathered should explain how FOQA would benefit the aviation industry? What are the major...
-
True or False. For a multi-degree-of-freedom system, one equation of motion can be written for each degree of freedom.
-
Matthew (who was born on 1 October 1934) dies on 23 December 2023. His only income in tax year 2023-24 is a retirement pension of 35,130. He made a Gift Aid donation of 200 in July 2023. His wife has...
-
True or False. The product of stiffness and flexibility matrices of a system is always an identity matrix.
-
True or False. The mass, stiffness, and damping matrices of a multi-degree-of-freedom system are always symmetric.
-
In 2023-24, Raj has dividend income of 63,670. He has no other income. He makes a qualifying Gift Aid donation of 440 during the year. Show his 2023-24 income tax computation.
-
1. DFC valuation requires a large number of assumptions, while multiples valuation requires only one assumption: that the valuation ratio for a comparable firm be the same as the ratio for the target...
-
How do individual companies respond to economic forces throughout the globe? One way to explore this is to see how well rates of return for stock of individual companies can be explained by stock...

Study smarter with the SolutionInn App