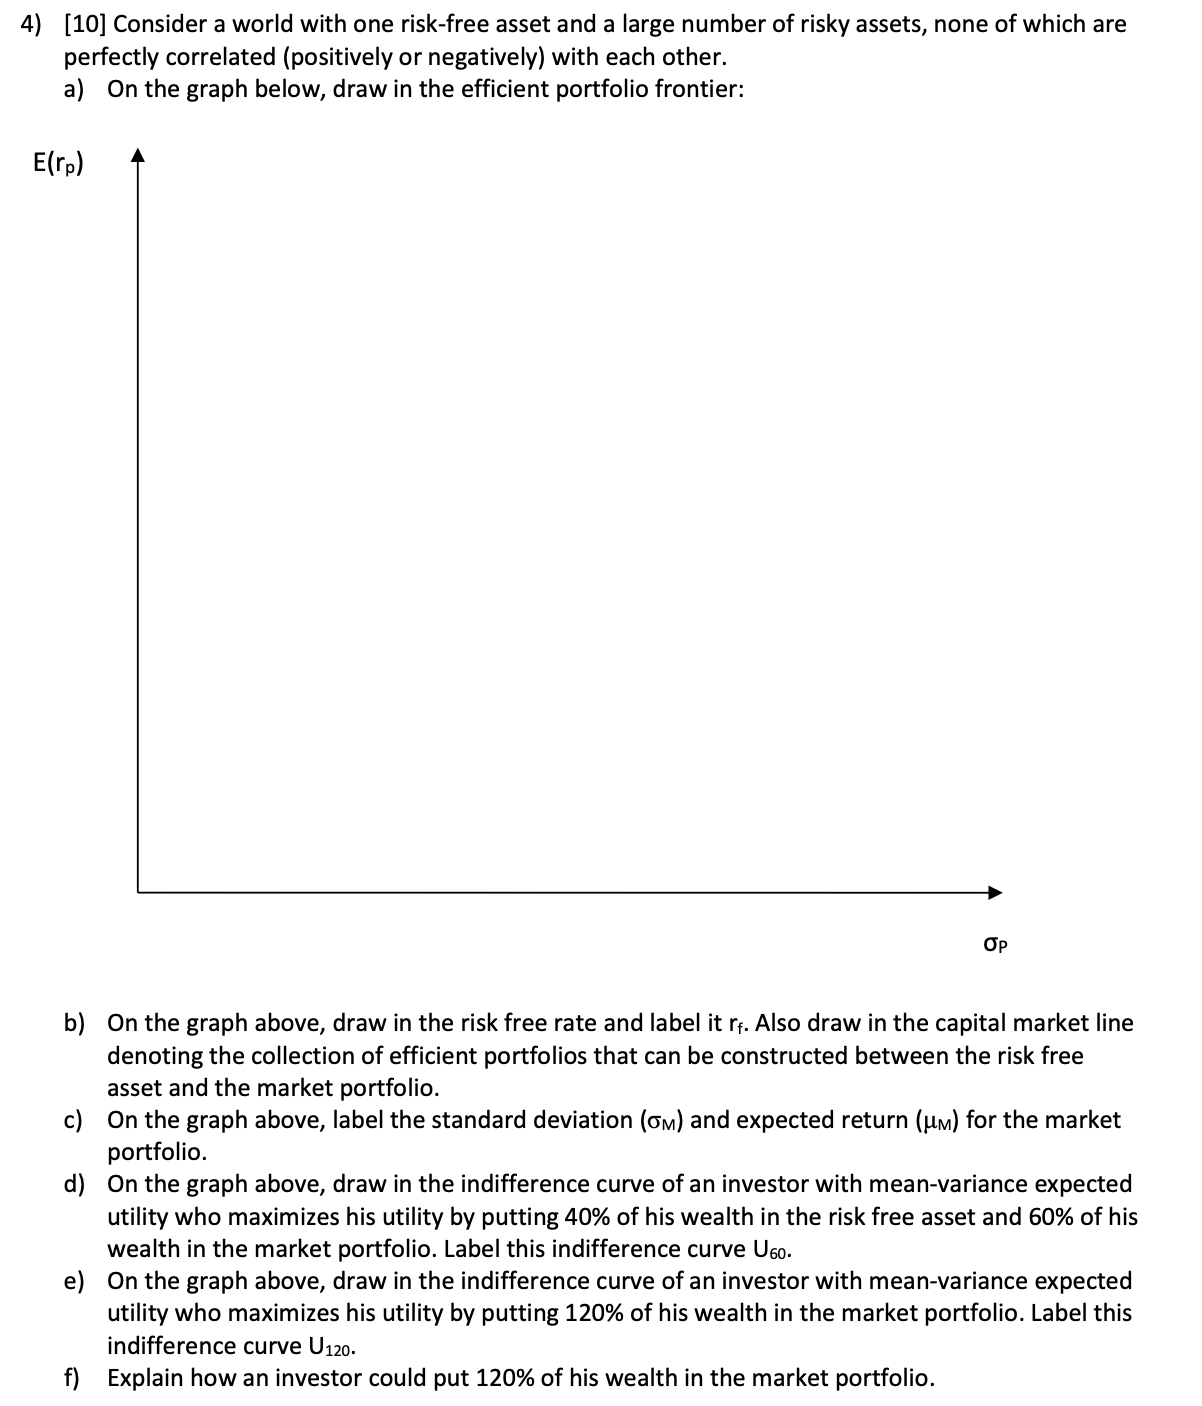
4) [10] Consider a world with one risk-free asset and a large number of risky assets,...
Fantastic news! We've Found the answer you've been seeking!
Question:
Transcribed Image Text:
4) [10] Consider a world with one risk-free asset and a large number of risky assets, none of which are perfectly correlated (positively or negatively) with each other. a) On the graph below, draw in the efficient portfolio frontier: E(rp) Op b) On the graph above, draw in the risk free rate and label it rf. Also draw in the capital market line denoting the collection of efficient portfolios that can be constructed between the risk free asset and the market portfolio. c) On the graph above, label the standard deviation (OM) and expected return (m) for the market portfolio. d) On the graph above, draw in the indifference curve of an investor with mean-variance expected utility who maximizes his utility putting 40% of his wealth in the risk free asset and 60% of his wealth in the market portfolio. Label this indifference curve U60. e) On the graph above, draw in the indifference curve of an investor with mean-variance expected utility who maximizes his utility by putting 120% of his wealth in the market portfolio. Label this indifference curve U120. f) Explain how an investor could put 120% of his wealth in the market portfolio. 4) [10] Consider a world with one risk-free asset and a large number of risky assets, none of which are perfectly correlated (positively or negatively) with each other. a) On the graph below, draw in the efficient portfolio frontier: E(rp) Op b) On the graph above, draw in the risk free rate and label it rf. Also draw in the capital market line denoting the collection of efficient portfolios that can be constructed between the risk free asset and the market portfolio. c) On the graph above, label the standard deviation (OM) and expected return (m) for the market portfolio. d) On the graph above, draw in the indifference curve of an investor with mean-variance expected utility who maximizes his utility putting 40% of his wealth in the risk free asset and 60% of his wealth in the market portfolio. Label this indifference curve U60. e) On the graph above, draw in the indifference curve of an investor with mean-variance expected utility who maximizes his utility by putting 120% of his wealth in the market portfolio. Label this indifference curve U120. f) Explain how an investor could put 120% of his wealth in the market portfolio. 4) [10] Consider a world with one risk-free asset and a large number of risky assets, none of which are perfectly correlated (positively or negatively) with each other. a) On the graph below, draw in the efficient portfolio frontier: E(rp) Op b) On the graph above, draw in the risk free rate and label it rf. Also draw in the capital market line denoting the collection of efficient portfolios that can be constructed between the risk free asset and the market portfolio. c) On the graph above, label the standard deviation (OM) and expected return (m) for the market portfolio. d) On the graph above, draw in the indifference curve of an investor with mean-variance expected utility who maximizes his utility putting 40% of his wealth in the risk free asset and 60% of his wealth in the market portfolio. Label this indifference curve U60. e) On the graph above, draw in the indifference curve of an investor with mean-variance expected utility who maximizes his utility by putting 120% of his wealth in the market portfolio. Label this indifference curve U120. f) Explain how an investor could put 120% of his wealth in the market portfolio.
Expert Answer:
Answer rating: 100% (QA)
a On the graph the efficient portfolio frontier represents the set of portfolios that offer the high... View the full answer
Related Book For
Posted Date:
Students also viewed these finance questions
-
Managing Scope Changes Case Study Scope changes on a project can occur regardless of how well the project is planned or executed. Scope changes can be the result of something that was omitted during...
-
KYC's stock price can go up by 15 percent every year, or down by 10 percent. Both outcomes are equally likely. The risk free rate is 5 percent, and the current stock price of KYC is 100. (a) Price a...
-
Determine the force P needed to support the 100 lb weight. Each pulley has a weight of 10 lb. Also determine the reactions at A and B. Figure 2 in
-
Explain why more standardized product specifications across countries can increase global competition.
-
During a presentations question-and-answer session, it is a good practice to repeat a question to the entire audience before you answer it. Name at least three advantages you gain by repeating a...
-
What are the various methods used for temperature measurement? Explain any one of them.
-
QSR magazine reports on the largest quick serve and fast casual restaurants in the United States. Do the various market segments (burger, chicken, sandwich, and pizza) differ in their mean sales per...
-
1 2 Part 2 of 15 points Skipped eBook P Deferences Required information The Foundational 15 (Algo) [LO14-2, LO14-3, LO14-4, LO14-5, LO14-6] [The following information applies to the questions...
-
2. (20 points) The gravitational force between two objects is F = 100N, determine the following: (a) The force between the objects is the distance is twice the original distance. (b) The force...
-
What is the difference between a Tax Court regular decision and a Tax Court memorandum decision? What are the similarities?
-
In 2022, if the taxpayer's child's interest, dividends, and other unearned income total more than what amount, it may be subject to a specific tax on the unearned income of certain children (kiddie...
-
Verlon Mills thinks the following mistakes may have been made in his accounting records: (i) a credit sale was recorded at the wrong value in the sales account (ii) a cheque issued to a credit...
-
5. Sharon has a convertible bond with a face value of $1,000 that can be converted into 40 shares of common stock of Mountain Ice Corporation. If the current price of the stock is $20, what is the...
-
The mixing department has 23,000 units and $50,000 in costs for which to account. Of the 23,000 units 10,000 were completed and transferred to the next department. The 13,000 remaining were 25%...
-
FDM is a filament-based extrusion 3D printing method that is the most widely used. In the FDM process, an object is built by selectively depositing melted material in a pre-determined path...
-
What are multinational corporations (MNCs) and what economic roles do they play?
-
Bernices preferences can be represented by u(x, y) = min{x, y}, where x is pairs of earrings and y is dollars to spend on other things. She faces prices (px, py) = (2, 1) and her income is 12. (a)...
-
Consider the cost function c(y) = 4y2 + 16. (a) The average cost function is ______________. (b) The marginal cost function is ______________. (c) The level of output that yields the minimum average...
-
Ms. Lynch has a choice of two assets: The first is a risk-free asset that offers a rate of return of rf, and the second is a risky asset (a china shop that caters to large mammals) that has an...
-
a. Show that the mean-squared forecast error \(E\left[\left(\hat{y}_{T+1}-y_{T+1} ight)^{2} \mid I_{T} ight]\) for a forecast \(\hat{y}_{T+1}\), that depends only on past information \(I_{T}\), can...
-
Consider the AR(1) model \(y_{t}=\delta+\theta y_{t-1}+e_{t}\) where \(|\theta|)=0\) and \(\operatorname{var}\left(e_{t} \mid I_{t-1} ight)=\sigma^{2}\). Let \(\bar{y}_{-1}=\sum_{t=2}^{T} y_{t}...
-
Consider a stationary model that combines the \(\operatorname{AR}(2)\) model \(y_{t}=\delta+\theta_{1} y_{t-1}+\theta_{2} y_{t-2}+e_{t}\) with an \(\mathrm{AR}(1)\) error model \(e_{t}=ho...
Study smarter with the SolutionInn App