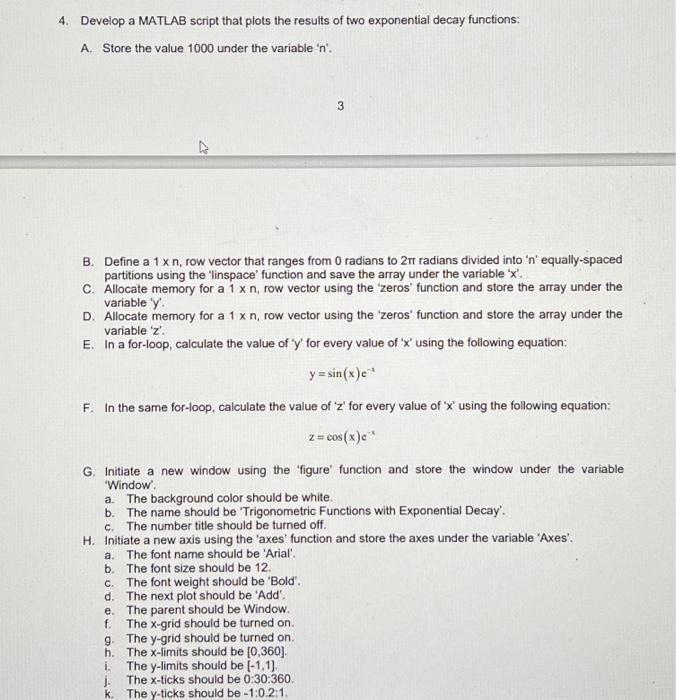
4. Develop a MATLAB script that plots the results of two exponential decay functions: A. Store...
Fantastic news! We've Found the answer you've been seeking!
Question:
Transcribed Image Text:
4. Develop a MATLAB script that plots the results of two exponential decay functions: A. Store the value 1000 under the variable 'n'. 3 B. Define a 1 x n, row vector that ranges from 0 radians to 2π radians divided into 'n' equally-spaced partitions using the 'linspace' function and save the array under the variable 'x'. C. Allocate memory for a 1 x n, row vector using the 'zeros' function and store the array under the variable 'y'. D. Allocate memory for a 1 x n, row vector using the 'zeros' function and store the array under the variable 'z'. E. In a for-loop, calculate the value of 'y' for every value of 'x' using the following equation: y=sin(x) e¹ F. In the same for-loop, calculate the value of 'z' for every value of 'x' using the following equation: z = cos(x) e* G. Initiate a new window using the 'figure' function and store the window under the variable 'Window'. a. The background color should be white. b. The name should be 'Trigonometric Functions with Exponential Decay'. C. The number title should be turned off. H. Initiate a new axis using the 'axes' function and store the axes under the variable 'Axes'. a. The font name should be 'Arial'. b. The font size should be 12. C. The font weight should be "Bold'. d. The next plot should be 'Add'. e. The parent should be Window. f. The x-grid should be turned on. g. The y-grid should be turned on. h. The x-limits should be [0,360]. i. The y-limits should be [-1,1]. j. The x-ticks should be 0:30:360. The y-ticks should be -1:0.2:1. k. 1. Initiate a new title. a. The string should be 'Trigonometric-Exponential Decay'. b. The font size should be 20. c. The parent should be Axes. J. Initiate a new x-label. a. The string should be 'x (\circ)'. b. The font size should be 16. c. The parent should be Axes. K. Initiate a new y-label. a. The string should be 'Function Value'. The font size should be 16. b. c. The parent should be Axes. L. Convert all the values of the 'x' array from radians to degrees. M. Initiate a new plot that shows the result of 'y vs. x'. a. The color should be black. b. The line style should be '-. C. The line width should be 2. d. The markers should be turned off. e. The parent should be Axes. N. Initiate a new plot that shows the result of 'z vs. x'. a. The color should be red. b. The line style should be '-'. c. The line width should be 2. d. The markers should be turned off. e. The parent should be Axes. 4 O. Initiate a new legend. a. The strings should be ('sin(x) e^(-x)', 'cos(\theta) e^(-x)}. b. The font size should be 16. c. The location should be 'NorthEast'. d. The parent should be Window. The command window output should look as shown in Figure 4. ndow Function V Begin Simulation... Plot generation complete! ===========‒‒‒‒‒‒‒‒‒‒‒es Simulation Complete! (0.4e5 seconds) fx»> Figure 4: Problem 4 Command Window Output The plot should look as shown in Figure 5. Trigonometric-Exponential Decay *D Figure 4: Problem Figure Output "(x) 4. Develop a MATLAB script that plots the results of two exponential decay functions: A. Store the value 1000 under the variable 'n'. 3 B. Define a 1 x n, row vector that ranges from 0 radians to 2π radians divided into 'n' equally-spaced partitions using the 'linspace' function and save the array under the variable 'x'. C. Allocate memory for a 1 x n, row vector using the 'zeros' function and store the array under the variable 'y'. D. Allocate memory for a 1 x n, row vector using the 'zeros' function and store the array under the variable 'z'. E. In a for-loop, calculate the value of 'y' for every value of 'x' using the following equation: y=sin(x) e¹ F. In the same for-loop, calculate the value of 'z' for every value of 'x' using the following equation: z = cos(x) e* G. Initiate a new window using the 'figure' function and store the window under the variable 'Window'. a. The background color should be white. b. The name should be 'Trigonometric Functions with Exponential Decay'. C. The number title should be turned off. H. Initiate a new axis using the 'axes' function and store the axes under the variable 'Axes'. a. The font name should be 'Arial'. b. The font size should be 12. C. The font weight should be "Bold'. d. The next plot should be 'Add'. e. The parent should be Window. f. The x-grid should be turned on. g. The y-grid should be turned on. h. The x-limits should be [0,360]. i. The y-limits should be [-1,1]. j. The x-ticks should be 0:30:360. The y-ticks should be -1:0.2:1. k. 1. Initiate a new title. a. The string should be 'Trigonometric-Exponential Decay'. b. The font size should be 20. c. The parent should be Axes. J. Initiate a new x-label. a. The string should be 'x (\circ)'. b. The font size should be 16. c. The parent should be Axes. K. Initiate a new y-label. a. The string should be 'Function Value'. The font size should be 16. b. c. The parent should be Axes. L. Convert all the values of the 'x' array from radians to degrees. M. Initiate a new plot that shows the result of 'y vs. x'. a. The color should be black. b. The line style should be '-. C. The line width should be 2. d. The markers should be turned off. e. The parent should be Axes. N. Initiate a new plot that shows the result of 'z vs. x'. a. The color should be red. b. The line style should be '-'. c. The line width should be 2. d. The markers should be turned off. e. The parent should be Axes. 4 O. Initiate a new legend. a. The strings should be ('sin(x) e^(-x)', 'cos(\theta) e^(-x)}. b. The font size should be 16. c. The location should be 'NorthEast'. d. The parent should be Window. The command window output should look as shown in Figure 4. ndow Function V Begin Simulation... Plot generation complete! ===========‒‒‒‒‒‒‒‒‒‒‒es Simulation Complete! (0.4e5 seconds) fx»> Figure 4: Problem 4 Command Window Output The plot should look as shown in Figure 5. Trigonometric-Exponential Decay *D Figure 4: Problem Figure Output "(x)
Expert Answer:
Answer rating: 100% (QA)
Answer A Store the value 1000 under the variable n n 1000 B Define a 1 x n row vector that ranges from 0 radians to 2 radians divided into n equallysp... View the full answer
Related Book For
Posted Date:
Students also viewed these programming questions
-
Bounty Inc. has outstanding a fixed coupon, $1,000 par value bond with 20 years remaining until maturity. The bond makes semi-annual coupon payments and the annual coupon rate is 8 percent. If the...
-
Develop a MATLAB script that plots the function dy/dx versus x (with appropriate labels) and use bisect new to determine the point of maximum deflection (i.e., the value of x where dy/dx = 0). Then...
-
Which cultures and co-cultures does she identify as ones to which she belongs? How can we be more aware of the assumptions that we make about others and work to seek to eliminate these unconscious...
-
Wilburton Hospital is investigating the possibility of investing in new dialysis equipment. Two local manufacturers of this equipment are being considered as sources of the equipment. After-tax cash...
-
Two traveling sinusoidal waves are described by the wave functions y1 = (5.00 m) sin [ (4.00x 1 200t)] And y2 = (5.00 m) sin [ (4.00x 1 200t 0.250)] Where x, y1, and y2 are in meters and t is in...
-
New Wave Shelving's Inventory Manager would like to start using an ABC inventory classification system. The following table shows the annual inventory usage of all the 19 component items that the...
-
Under appropriate conditions, water flowing from a faucet, onto a flat plate, and over the edge of the plate can produce a circular hydraulic jump as shown in Fig. P10.77 and Video V10.12. Consider a...
-
Assume that Dover Hospital performs the following activities in providing outpatient service: a. Verifying patients insurance coverage b. Scheduling patients arrival date and time c. Scheduling staff...
-
Calculate the free air flow requirements for the following applications: 1. A 2 inch bore cylinder with a 10 inch stroke extends in 0.5 seconds when supplied with 83 PSIG air. The compressor intake...
-
For the circuit in Fig. 2.95, determine i1 to i5. Figure 2.95 For Prob. 2.31 3 ( 2 --> i 13 12 40 V
-
Briefly describe the universe of situations in which a hospital must make a report to the National Practitioner Data Bank.
-
Consider Kotter's 8 steps for change. From your perspective, which step would be the easiest to work through. Give your reason for choosing this step. Then consider which step would be the most...
-
In 2008 and 2011, the PCAOB issued Staff Audit Practice Alerts to assist auditors in identifying economic factors that could affect a client's material misstatement risk. Please discuss (1) why it is...
-
c) (4) Below are three schematic tests curves obtained by multiple Charpy tests from three different materials. Label the axis, the important points of the curves and which curve was obtained from an...
-
What role does strategic portfolio management play in maximizing synergies within diversified business portfolios, including portfolio rationalization, resource allocation, and strategic divestitures...
-
What were the results achieved? please provide with an explained answer with APA references.
-
Which of the following about a value-stream analysis are true? (Select all that apply.) Activities can be classified as either "value-added", "pure waste", or "necessary but wasteful." The Six Sigma...
-
Read Case Study Google: Dont Be Evil Unless and answer the following: Given its mission of providing information to the world, should Google censor searches in China?
-
A diagonalization of the matrix A is given in the form P -1 AP = D. List the eigenvalues of A and bases for the corresponding eigenspaces. 3 1 3 1. -1 -1 6. -2 -2 || 3. 3. 3. H|00 MI43/8
-
If u, v, and w are vectors in R n , n 2, and c is a scalar, explain why the following expressions make no sense: (a) u v (b) u v + w (c) u (v w) (d) c (u + w)
-
(a) If A is the adjacency matrix of a graph G, show that A is irreducible if and only if G is connected. (A graph is connected if there is a path between every pair of vertices.) (b) Which of the...
-
Give some examples of how CRM-enabled sales analytics can provide valuable insights at each of these stages of the customer journey: prospect (lead), initial customer contact, engagement with the...
-
Someone says: Our firm focuses on maintaining long-term relationships with our customers. We dont have to do any prospecting. Evaluate this statement.
-
Why do some salespeople not immediately embrace the use of the newest technologies? What are some ways in which a salesperson who is reluctant to adopt new technologies might be influenced to do so?
Study smarter with the SolutionInn App