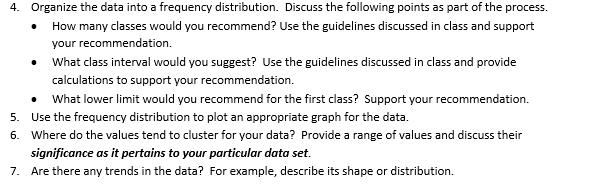
4. Organize the data into a frequency distribution. Discuss the following points as part of the...
Fantastic news! We've Found the answer you've been seeking!
Question:
Transcribed Image Text:
4. Organize the data into a frequency distribution. Discuss the following points as part of the process. How many classes would you recommend? Use the guidelines discussed in class and support your recommendation. • What class interval would you suggest? Use the guidelines discussed in class and provide calculations to support your recommendation. • What lower limit would you recommend for the first class? Support your recommendation. 5. Use the frequency distribution to plot an appropriate graph for the data. 6. Where do the values tend to cluster for your data? Provide a range of values and discuss their significance as it pertains to your particular data set. 7. Are there any trends in the data? For example, describe its shape or distribution. K R U V Lower Class Limit Upper Class Limit Bin 100 1000 1000 1000 2000 2000 2000 3000 3000 3000 4000 4000 4000 5000 5000 5000 6000 6000 The COVID 19 Cases of Afghanistan starting April 1 to May 20, 6000 7000 7000 2020 for a sample of 50 data points is summarized below: 7000 8000 8000 8000 9000 9000 Number of Class Class Interval (COVID-19 CASES) Frequency Midpoint Product Relative Frequenc Relative Frequency (% Cumulative Frequency 1. 100 to under 1000 19 600 11400 0.38 38% 19 1000 to under 2000 10 2000 20000 0.2 20% 29 The mean minimum cases is 173,900/50=3478. The median class is 4. The modal class is 3000 to under 4000. It is positively skewed. 3 2000 to under 3000 3500 17500 0.1 10% 15 4 3000 to under 4000 4 5000 20000 0.08 8% 4000 to under 5000 4 6500 26000 0.08 8% 8 6 5000 to under 6000 2 8000 16000 0.04 4% 6 7 6000 to under 7000 9500 28500 0.06 6% 5 7000 to under 8000 2 11000 22000 0.04 4% 9 8000 to under 9000 12500 12500 0.02 2% 45 50 173900 1 100% 4. Organize the data into a frequency distribution. Discuss the following points as part of the process. How many classes would you recommend? Use the guidelines discussed in class and support your recommendation. • What class interval would you suggest? Use the guidelines discussed in class and provide calculations to support your recommendation. • What lower limit would you recommend for the first class? Support your recommendation. 5. Use the frequency distribution to plot an appropriate graph for the data. 6. Where do the values tend to cluster for your data? Provide a range of values and discuss their significance as it pertains to your particular data set. 7. Are there any trends in the data? For example, describe its shape or distribution. K R U V Lower Class Limit Upper Class Limit Bin 100 1000 1000 1000 2000 2000 2000 3000 3000 3000 4000 4000 4000 5000 5000 5000 6000 6000 The COVID 19 Cases of Afghanistan starting April 1 to May 20, 6000 7000 7000 2020 for a sample of 50 data points is summarized below: 7000 8000 8000 8000 9000 9000 Number of Class Class Interval (COVID-19 CASES) Frequency Midpoint Product Relative Frequenc Relative Frequency (% Cumulative Frequency 1. 100 to under 1000 19 600 11400 0.38 38% 19 1000 to under 2000 10 2000 20000 0.2 20% 29 The mean minimum cases is 173,900/50=3478. The median class is 4. The modal class is 3000 to under 4000. It is positively skewed. 3 2000 to under 3000 3500 17500 0.1 10% 15 4 3000 to under 4000 4 5000 20000 0.08 8% 4000 to under 5000 4 6500 26000 0.08 8% 8 6 5000 to under 6000 2 8000 16000 0.04 4% 6 7 6000 to under 7000 9500 28500 0.06 6% 5 7000 to under 8000 2 11000 22000 0.04 4% 9 8000 to under 9000 12500 12500 0.02 2% 45 50 173900 1 100%
Expert Answer:
Answer rating: 100% (QA)
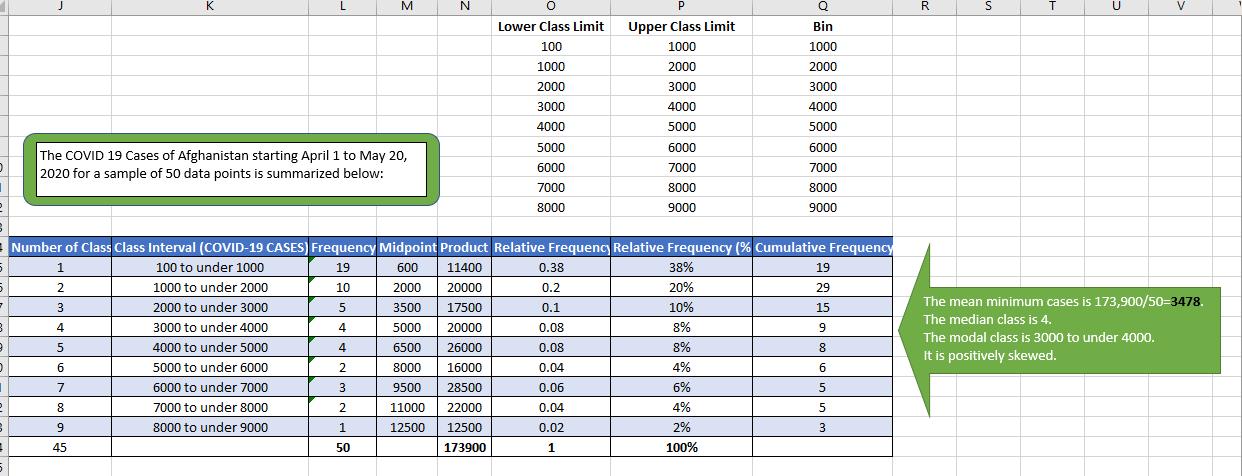
We use above given frequency distribution to plot the relative frequency histogram i... View the full answer
Related Book For
Statistical Techniques in Business and Economics
ISBN: 9781260239478
18th Edition
Authors: Douglas Lind, William Marchal, Samuel Wathen
Posted Date:
Students also viewed these accounting questions
-
A set of data consists of 38 observations. How many classes would you recommend for the frequency distribution?
-
As part of a process to build a new automotive portfolio, you have been asked to determine the beta coefficients for AB Volvo and General Motors. Data for this task are contained in the data file...
-
Aside from past smoking related lawsuits, are there any trends that encouraged Krafts independence?
-
Using examples outline the main advantages and disadvantages of one of the following models of corporate governance: i) The principal/agent model ii) The stakeholder mode
-
Suppose that a person believes that his last years weight was normally distributed with mean of 165 lb and standard deviation of 5 lb. That is, the prior pdf of is N(165, 25), or () ~ N(165, 25). He...
-
In Drosophila, the genes sr (stripe thorax) and e (ebony body) are located at 62 and 70 cM, respectively, from the left end of chromosome 3. A striped female homozygous for e+ was mated with an ebony...
-
If an impulse is delivered to a system, is work necessarily done on the system?
-
Denton Company manufactures and sells a single product. Cost data for the product are given below: Variable costs per unit: Direct materials . . . . . . . . . . . . . . . . . . . . . . . . $ 7 Direct...
-
2) [25 pnts] The manager of the marketing department of Supersale Groceries believes that the male customers are buying in larger quantities compared to the female customers. Also the manager thinks...
-
Top Quality Appliance-Long Beach has just purchased a franchise from Top Quality Appliance (TQA). TQA is a manufacturer of kitchen appliances. TQA markets its products via retail stores that are...
-
A company uses the percent of sales method to determine its bad debts expense. At the end of the current year, the company's unadjusted trial balance reported the following selected amounts: Accounts...
-
How is the profitability of an investment calculated with the annuity method?
-
What recycling and recovery alternatives exist for industrial waste?
-
What are the main responsibilities of human resource management?
-
What are substitute and complementary goods?
-
What four methods exist for need fulfilment?
-
The "difference" in the buy term and invest the difference strategy is the difference in insurance and whole life insurance. dividends O expense loads O premiums sales commission O average insured's...
-
The graph of an equation is given. (a) Find the intercepts. (b) Indicate whether the graph is symmetric with respect to the x-axis, the y-axis, or the origin. -3 6 -6 3 x
-
Following are the quantities and prices for the years 2010 and 2018 for Kinzua Valley Geriatrics. Use 2010 as the base period. a. Determine the simple price indexes. b. Determine the simple aggregate...
-
Fruit prices and the amounts consumed for 2010 and 2018 are shown. Use 2010 as the base. a. Determine the simple price indexes. b. Determine the simple aggregate price index for the two years. c....
-
Using the same time series data and trend forecast model as in exercise 13, respond to the following items. a. Plot the residuals associated with the trend model for this data. b. T est for...
-
Consider the following cash flow profile: What is the present worth equivalent for the cash flow series with an interest rate of 12 percent? EOY Cash Flow EOY Cash Flow EOY Cash Flow 0 -$50,000 3...
-
In Problem 102, using an interest rate of 10 percent, what uniform series over the closed interval [1,8] is equivalent to the cash flow profile shown? Data from problem 102 Consider the following...
-
In Problem 102, using an interest rate of 8 percent, what single sum of money occurring at the end of year 8 is equivalent to the cash flow profile shown? Data from problem 102 Consider the following...
Study smarter with the SolutionInn App