

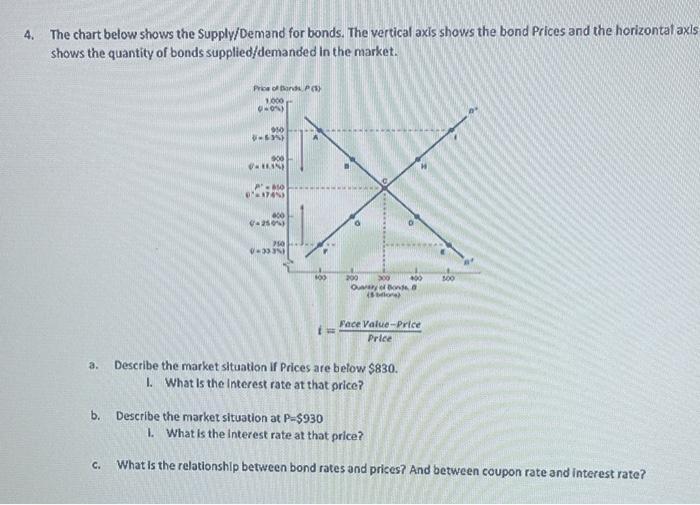
4. The chart below shows the Supply/Demand for bonds. The vertical axis shows the bond Prices...
Fantastic news! We've Found the answer you've been seeking!
Question:
Expert Answer:

Related Book For 

Posted Date:
