

5. 6. Insert a text box (10%) Include your brief comments on which of all your...
Fantastic news! We've Found the answer you've been seeking!
Question:
Transcribed Image Text:
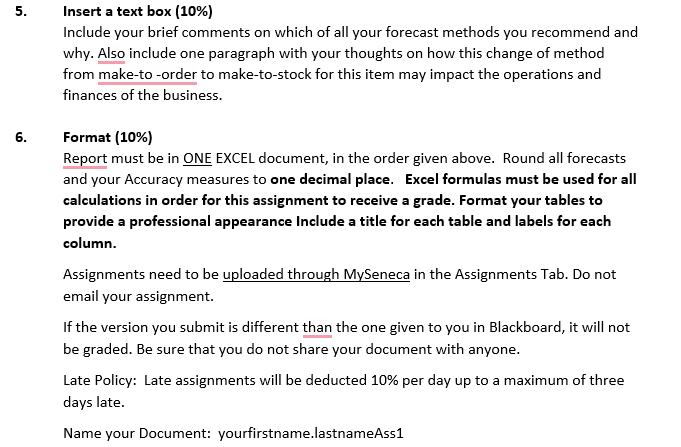
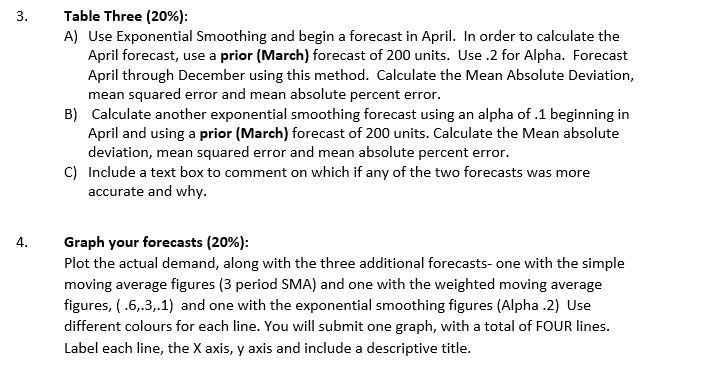
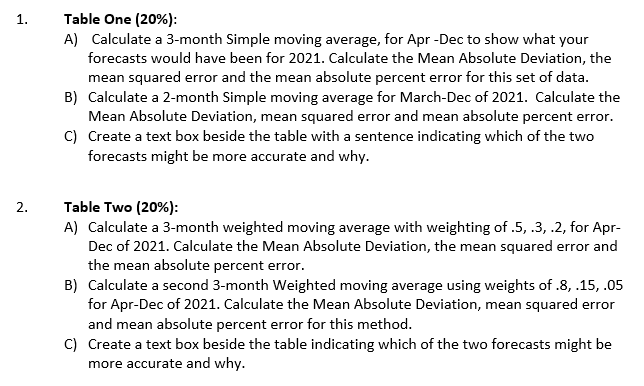
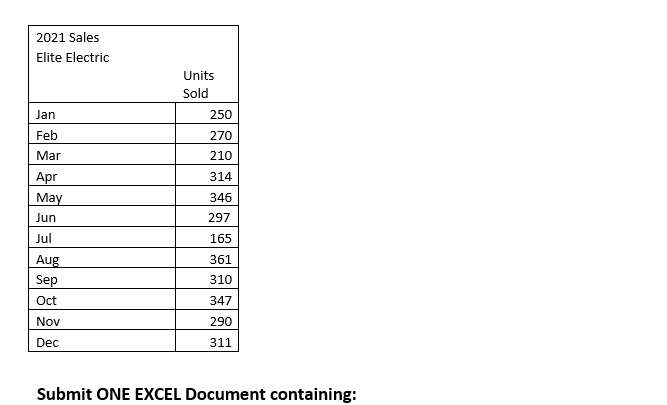
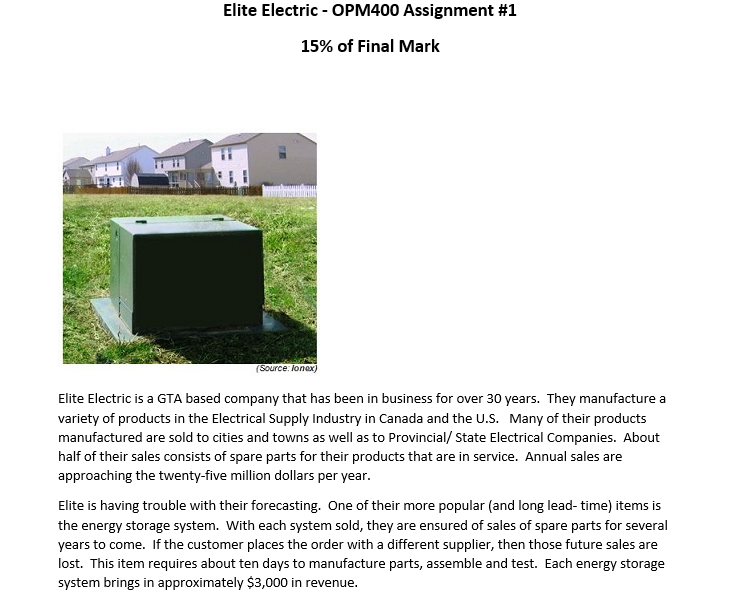
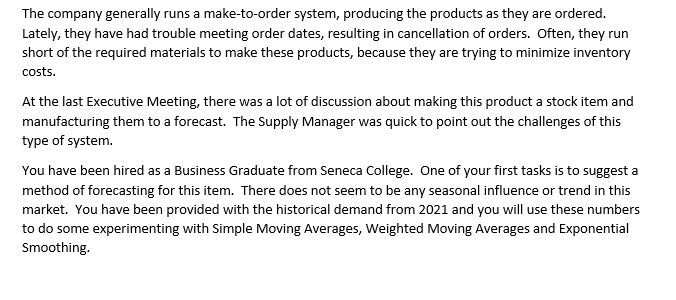
5. 6. Insert a text box (10%) Include your brief comments on which of all your forecast methods you recommend and why. Also include one paragraph with your thoughts on how this change of method from make-to-order to make-to-stock for this item may impact the operations and finances of the business. Format (10%) Report must be in ONE EXCEL document, in the order given above. Round all forecasts and your Accuracy measures to one decimal place. Excel formulas must be used for all calculations in order for this assignment to receive a grade. Format your tables to provide a professional appearance Include a title for each table and labels for each column. Assignments need to be uploaded through MySeneca in the Assignments Tab. Do not email your assignment. If the version you submit is different than the one given to you in Blackboard, it will not be graded. Be sure that you do not share your document with anyone. Late Policy: Late assignments will be deducted 10% per day up to a maximum of three days late. Name your Document: yourfirstname.lastnameAss1 3. Table Three (20%): A) Use Exponential Smoothing and begin a forecast in April. In order to calculate the April forecast, use a prior (March) forecast of 200 units. Use .2 for Alpha. Forecast April through December using this method. Calculate the Mean Absolute Deviation, mean squared error and mean absolute percent error. B) Calculate another exponential smoothing forecast using an alpha of .1 beginning in April and using a prior (March) forecast of 200 units. Calculate the Mean absolute deviation, mean squared error and mean absolute percent error. C) Include a text box to comment on which if any of the two forecasts was more accurate and why. 4. Graph your forecasts (20%): Plot the actual demand, along with the three additional forecasts- one with the simple moving average figures (3 period SMA) and one with the weighted moving average figures, (.6,.3,.1) and one with the exponential smoothing figures (Alpha .2) Use different colours for each line. You will submit one graph, with a total of FOUR lines. Label each line, the X axis, y axis and include a descriptive title. 1. 2. Table One (20%): A) Calculate a 3-month Simple moving average, for Apr -Dec to show what your forecasts would have been for 2021. Calculate the Mean Absolute Deviation, the mean squared error and the mean absolute percent error for this set of data. B) Calculate a 2-month Simple moving average for March-Dec of 2021. Calculate the Mean Absolute Deviation, mean squared error and mean absolute percent error. C) Create a text box beside the table with a sentence indicating which of the two forecasts might be more accurate and why. Table Two (20%): A) Calculate a 3-month weighted moving average with weighting of .5, .3, .2, for Apr- Dec of 2021. Calculate the Mean Absolute Deviation, the mean squared error and the mean absolute percent error. B) Calculate a second 3-month Weighted moving average using weights of .8, .15, .05 for Apr-Dec of 2021. Calculate the Mean Absolute Deviation, mean squared error and mean absolute percent error for this method. C) Create a text box beside the table indicating which of the two forecasts might be more accurate and why. 2021 Sales Elite Electric Units Sold Jan 250 Feb 270 Mar 210 Apr 314 May 346 Jun 297 Jul 165 Aug 361 Sep 310 Oct 347 Nov 290 Dec 311 Submit ONE EXCEL Document containing: Elite Electric - OPM400 Assignment #1 15% of Final Mark (Source: Ionex) Elite Electric is a GTA based company that has been in business for over 30 years. They manufacture a variety of products in the Electrical Supply Industry in Canada and the U.S. Many of their products manufactured are sold to cities and towns as well as to Provincial/State Electrical Companies. About half of their sales consists of spare parts for their products that are in service. Annual sales are approaching the twenty-five million dollars per year. Elite is having trouble with their forecasting. One of their more popular (and long lead-time) items is the energy storage system. With each system sold, they are ensured of sales of spare parts for several years to come. If the customer places the order with a different supplier, then those future sales are lost. This item requires about ten days to manufacture parts, assemble and test. Each energy storage system brings in approximately $3,000 in revenue. The company generally runs a make-to-order system, producing the products as they are ordered. Lately, they have had trouble meeting order dates, resulting in cancellation of orders. Often, they run short of the required materials to make these products, because they are trying to minimize inventory costs. At the last Executive Meeting, there was a lot of discussion about making this product a stock item and manufacturing them to a forecast. The Supply Manager was quick to point out the challenges of this type of system. You have been hired as a Business Graduate from Seneca College. One of your first tasks is to suggest a method of forecasting for this item. There does not seem to be any seasonal influence or trend in this market. You have been provided with the historical demand from 2021 and you will use these numbers to do some experimenting with Simple Moving Averages, Weighted Moving Averages and Exponential Smoothing. 5. 6. Insert a text box (10%) Include your brief comments on which of all your forecast methods you recommend and why. Also include one paragraph with your thoughts on how this change of method from make-to-order to make-to-stock for this item may impact the operations and finances of the business. Format (10%) Report must be in ONE EXCEL document, in the order given above. Round all forecasts and your Accuracy measures to one decimal place. Excel formulas must be used for all calculations in order for this assignment to receive a grade. Format your tables to provide a professional appearance Include a title for each table and labels for each column. Assignments need to be uploaded through MySeneca in the Assignments Tab. Do not email your assignment. If the version you submit is different than the one given to you in Blackboard, it will not be graded. Be sure that you do not share your document with anyone. Late Policy: Late assignments will be deducted 10% per day up to a maximum of three days late. Name your Document: yourfirstname.lastnameAss1 3. Table Three (20%): A) Use Exponential Smoothing and begin a forecast in April. In order to calculate the April forecast, use a prior (March) forecast of 200 units. Use .2 for Alpha. Forecast April through December using this method. Calculate the Mean Absolute Deviation, mean squared error and mean absolute percent error. B) Calculate another exponential smoothing forecast using an alpha of .1 beginning in April and using a prior (March) forecast of 200 units. Calculate the Mean absolute deviation, mean squared error and mean absolute percent error. C) Include a text box to comment on which if any of the two forecasts was more accurate and why. 4. Graph your forecasts (20%): Plot the actual demand, along with the three additional forecasts- one with the simple moving average figures (3 period SMA) and one with the weighted moving average figures, (.6,.3,.1) and one with the exponential smoothing figures (Alpha .2) Use different colours for each line. You will submit one graph, with a total of FOUR lines. Label each line, the X axis, y axis and include a descriptive title. 1. 2. Table One (20%): A) Calculate a 3-month Simple moving average, for Apr -Dec to show what your forecasts would have been for 2021. Calculate the Mean Absolute Deviation, the mean squared error and the mean absolute percent error for this set of data. B) Calculate a 2-month Simple moving average for March-Dec of 2021. Calculate the Mean Absolute Deviation, mean squared error and mean absolute percent error. C) Create a text box beside the table with a sentence indicating which of the two forecasts might be more accurate and why. Table Two (20%): A) Calculate a 3-month weighted moving average with weighting of .5, .3, .2, for Apr- Dec of 2021. Calculate the Mean Absolute Deviation, the mean squared error and the mean absolute percent error. B) Calculate a second 3-month Weighted moving average using weights of .8, .15, .05 for Apr-Dec of 2021. Calculate the Mean Absolute Deviation, mean squared error and mean absolute percent error for this method. C) Create a text box beside the table indicating which of the two forecasts might be more accurate and why. 2021 Sales Elite Electric Units Sold Jan 250 Feb 270 Mar 210 Apr 314 May 346 Jun 297 Jul 165 Aug 361 Sep 310 Oct 347 Nov 290 Dec 311 Submit ONE EXCEL Document containing: Elite Electric - OPM400 Assignment #1 15% of Final Mark (Source: Ionex) Elite Electric is a GTA based company that has been in business for over 30 years. They manufacture a variety of products in the Electrical Supply Industry in Canada and the U.S. Many of their products manufactured are sold to cities and towns as well as to Provincial/State Electrical Companies. About half of their sales consists of spare parts for their products that are in service. Annual sales are approaching the twenty-five million dollars per year. Elite is having trouble with their forecasting. One of their more popular (and long lead-time) items is the energy storage system. With each system sold, they are ensured of sales of spare parts for several years to come. If the customer places the order with a different supplier, then those future sales are lost. This item requires about ten days to manufacture parts, assemble and test. Each energy storage system brings in approximately $3,000 in revenue. The company generally runs a make-to-order system, producing the products as they are ordered. Lately, they have had trouble meeting order dates, resulting in cancellation of orders. Often, they run short of the required materials to make these products, because they are trying to minimize inventory costs. At the last Executive Meeting, there was a lot of discussion about making this product a stock item and manufacturing them to a forecast. The Supply Manager was quick to point out the challenges of this type of system. You have been hired as a Business Graduate from Seneca College. One of your first tasks is to suggest a method of forecasting for this item. There does not seem to be any seasonal influence or trend in this market. You have been provided with the historical demand from 2021 and you will use these numbers to do some experimenting with Simple Moving Averages, Weighted Moving Averages and Exponential Smoothing.
Expert Answer:

Posted Date:
Students also viewed these general management questions
-
The credit rating for bonds issued by a company is CCC . Then we know these bonds A . have investment quality ratings, B . pay a lower coupon rate, C . are zero coupon bonds, D . are called junk...
-
Abco Electric is a GTA-based company that has been in business for over 30 years. They manufacture a variety of products in the Electrical Supply Industry in Canada and the U.S. Many of their...
-
Question: What as the average weekly safety inventory level of refined sugar from the beginning January 2022 to the end of July 2022? A. 512,465.9691 metric tons per week B. 316,002.1474 metric tons...
-
Consider the 70 households that purchased a DVD player, 48 households are satisfied with their purchase and 22 households are dissatisfied. Suppose two households are randomly selected from the...
-
The Compton effect can occur for scattering from any particle for example, from a proton. (a) Compared with the Compton wavelength for an electron, the Compton wavelength for a proton is (1) longer,...
-
Allied Industries uses the direct write-off method to account for bad debts. Record the following transactions that occurred during the year: Feb 3 Aug 8 Nov 10 Provided $600 of services to Bill...
-
What is meant by the processor queuing discipline? How does the queuing discipline affect the nature of jobs awaiting service at the processor?
-
Mesa Companys fixed budget for the first quarter of calendar year 2011 reveals the following. Prepare flexible budgets following the format of Exhibit 24.3 that show variable costs per unit, fixed...
-
Quality Progress, February 2005, reports on improvements in customer satisfaction and loyalty made by Bank of America. A key measure of customer satisfaction is the response (on a scale from 1 to 10)...
-
Mr. Kofi Nyamekye, the General Manager of Agyengo Ltd has been nomination by the president to be the Municipal Chief Executive of Ho Municipal Assembly. He is required to obtain a Tax Clearance from...
-
Hyperbolic process is also an isothermal process in the super heat region. Say true or false.
-
What are saturation states ?
-
What remains constant during isentropic process ?
-
What is the triple point?
-
What are the limitations on \(\iota\), which is the nondimensional value of the ratio of the force causing Coulomb friction to the amplitude of the excitation force?
-
Use Python and use the following imports: import numpy as np import scipy.linalg as la import matplotlib.pyplot as plt 1. Choose a value and set the variable x to that value. 2. What is command to...
-
As water moves through the hydrologic cycle, water quality changes are common because of natural phenomena or anthropogenic pollution. Using Figure 11.1, describe how water-quality changes occur...
-
Refer to the information for Tweety Company in E5-1. Tweety Companys owner, Sylvester, believes that he can sell 2,000 birdbaths during the month of April and has predicted a contribu tion margin...
-
Valley Dental Services is a specialized dental practice whose only service is filling cavities. Valley has recorded the following for the past nine months. Required: 1. Use the high-low method to...
-
Refer to the information in E5-4 regarding Valley Dental. Required: 1. Create a scattergraph using Valleys activity and cost information and draw a line on the graph that you believe has the best...

Study smarter with the SolutionInn App