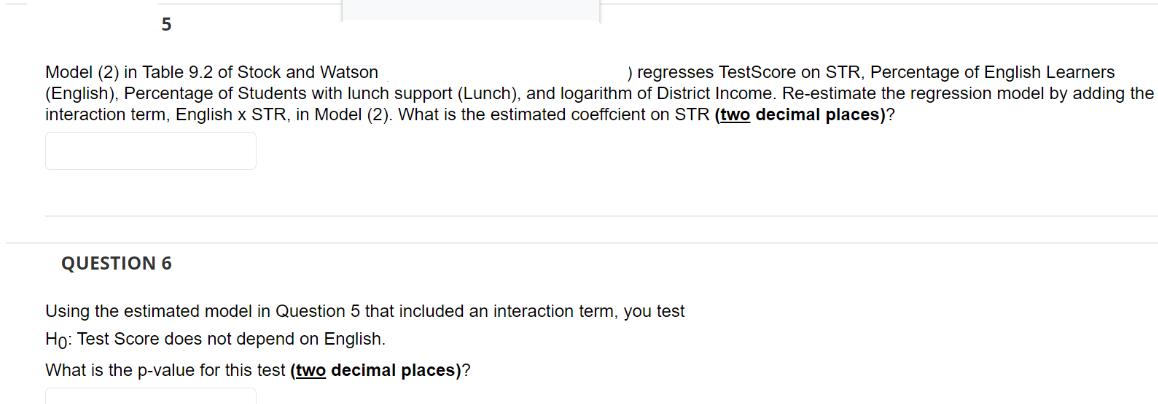
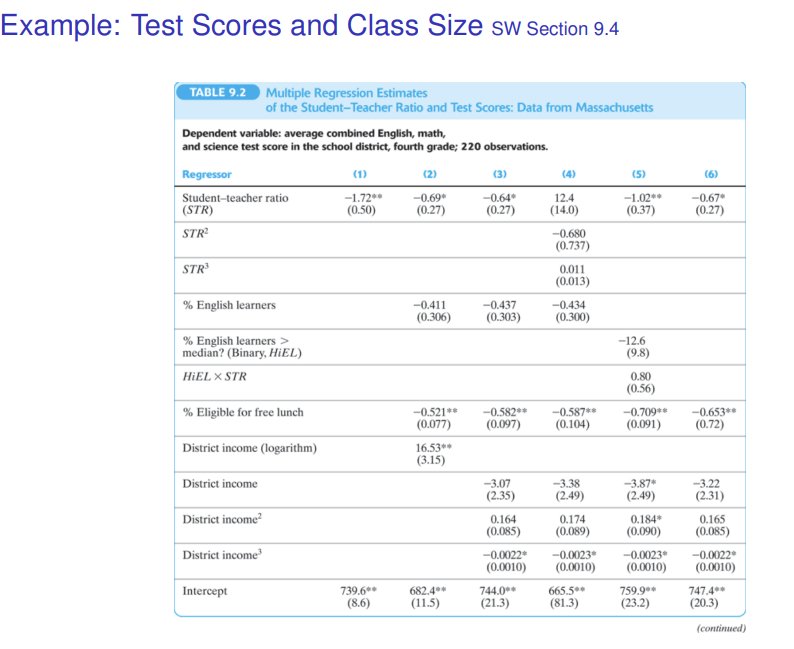
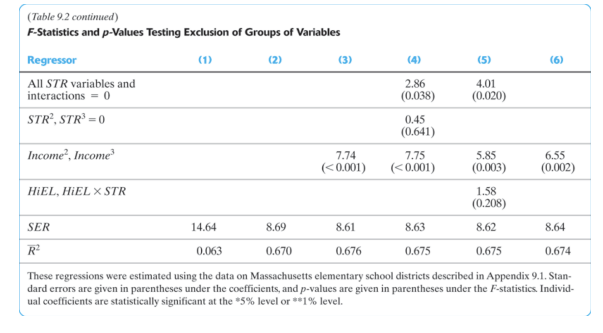
5 Model (2) in Table 9.2 of Stock and Watson ) regresses TestScore on STR, Percentage...
Fantastic news! We've Found the answer you've been seeking!
Question:
Transcribed Image Text:
5 Model (2) in Table 9.2 of Stock and Watson ) regresses TestScore on STR, Percentage of English Learners (English), Percentage of Students with lunch support (Lunch), and logarithm of District Income. Re-estimate the regression model by adding the interaction term, English x STR, in Model (2). What is the estimated coeffcient on STR (two decimal places)? QUESTION 6 Using the estimated model in Question 5 that included an interaction term, you test Ho: Test Score does not depend on English. What is the p-value for this test (two decimal places)? Example: Test Scores and Class Size Sw Section 9.4 TABLE 9.2 Multiple Regression Estimates of the Student-Teacher Ratio and Test Scores: Data from Massachusetts Dependent variable: average combined English, math, and science test score in the school district, fourth grade; 220 observations. Regressor (1) (2) (3) (4) (5) (6) Student-teacher ratio -1.72** -0.69* -0.64 12.4 -1.02** -0.67 (STR) (0.50) (0.27) (0.27) (14.0) (0.37) (0.27) STR -0.680 (0.737) STR 0.011 (0.013) % English learners -0.411 (0.306) -0.437 -0.434 (0.303) (0.300) % English learners > -12.6 median? (Binary, HiEL) (9.8) HIEL XSTR 0.80 (0.56) % Eligible for free lunch -0.521** (0.077) -0.582** -0.587** -0.709** -0.653** (0.097) (0.104) (0.091) (0.72) District income (logarithm) 16.53** (3.15) District income -3.07 -3.38 -3.87* -3.22 (2.35) (2.49) (2.49) (2.31) District income 0.164 0.174 0.184* 0.165 (0.085) (0.089) (0.090) (0.085) District income -0.0022* -0.0023 -0.0023 -0.0022 (0.0010) (0.0010) (0.0010) (0.0010) Intercept 739.6** 682.4** 744.0** 665.5** 759.9** 747.4** (8.6) (11.5) (21.3) (81.3) (23.2) (20.3) (continued) (Table 9.2 continued) F-Statistics and p-Values Testing Exclusion of Groups of Variables Regressor All STR variables and interactions = 0 STR, STR=0 Income, Income HiEL, HIEL STR SER R (1) (2) (3) (4) (5) (6) 2.86 (0.038) 4.01 (0.020) 0.45 (0.641) 7.74 ( <0.001) 7.75 ( <0.001) 5.85 (0.003) 6.55 (0.002) 1.58 (0.208) 14.64 8.69 8.61 8.63 8.62 8.64 0.063 0.670 0.676 0.675 0.675 0.674 These regressions were estimated using the data on Massachusetts elementary school districts described in Appendix 9.1. Stan- dard errors are given in parentheses under the coefficients, and p-values are given in parentheses under the F-statistics. Individ- ual coefficients are statistically significant at the *5% level or **1% level. 5 Model (2) in Table 9.2 of Stock and Watson ) regresses TestScore on STR, Percentage of English Learners (English), Percentage of Students with lunch support (Lunch), and logarithm of District Income. Re-estimate the regression model by adding the interaction term, English x STR, in Model (2). What is the estimated coeffcient on STR (two decimal places)? QUESTION 6 Using the estimated model in Question 5 that included an interaction term, you test Ho: Test Score does not depend on English. What is the p-value for this test (two decimal places)? Example: Test Scores and Class Size Sw Section 9.4 TABLE 9.2 Multiple Regression Estimates of the Student-Teacher Ratio and Test Scores: Data from Massachusetts Dependent variable: average combined English, math, and science test score in the school district, fourth grade; 220 observations. Regressor (1) (2) (3) (4) (5) (6) Student-teacher ratio -1.72** -0.69* -0.64 12.4 -1.02** -0.67 (STR) (0.50) (0.27) (0.27) (14.0) (0.37) (0.27) STR -0.680 (0.737) STR 0.011 (0.013) % English learners -0.411 (0.306) -0.437 -0.434 (0.303) (0.300) % English learners > -12.6 median? (Binary, HiEL) (9.8) HIEL XSTR 0.80 (0.56) % Eligible for free lunch -0.521** (0.077) -0.582** -0.587** -0.709** -0.653** (0.097) (0.104) (0.091) (0.72) District income (logarithm) 16.53** (3.15) District income -3.07 -3.38 -3.87* -3.22 (2.35) (2.49) (2.49) (2.31) District income 0.164 0.174 0.184* 0.165 (0.085) (0.089) (0.090) (0.085) District income -0.0022* -0.0023 -0.0023 -0.0022 (0.0010) (0.0010) (0.0010) (0.0010) Intercept 739.6** 682.4** 744.0** 665.5** 759.9** 747.4** (8.6) (11.5) (21.3) (81.3) (23.2) (20.3) (continued) (Table 9.2 continued) F-Statistics and p-Values Testing Exclusion of Groups of Variables Regressor All STR variables and interactions = 0 STR, STR=0 Income, Income HiEL, HIEL STR SER R (1) (2) (3) (4) (5) (6) 2.86 (0.038) 4.01 (0.020) 0.45 (0.641) 7.74 ( <0.001) 7.75 ( <0.001) 5.85 (0.003) 6.55 (0.002) 1.58 (0.208) 14.64 8.69 8.61 8.63 8.62 8.64 0.063 0.670 0.676 0.675 0.675 0.674 These regressions were estimated using the data on Massachusetts elementary school districts described in Appendix 9.1. Stan- dard errors are given in parentheses under the coefficients, and p-values are given in parentheses under the F-statistics. Individ- ual coefficients are statistically significant at the *5% level or **1% level.
Expert Answer:
Related Book For
Principles Of Econometrics
ISBN: 9781118452271
5th Edition
Authors: R Carter Hill, William E Griffiths, Guay C Lim
Posted Date:
Students also viewed these mathematics questions
-
CANMNMM January of this year. (a) Each item will be held in a record. Describe all the data structures that must refer to these records to implement the required functionality. Describe all the...
-
The new line character is utilized solely as the last person in each message. On association with the server, a client can possibly (I) question the situation with a client by sending the client's...
-
It was reported that 23% of U.S. adult cellphone owners called a friend for advice about a purchase while in a store. If a sample of 15 U.S adult cellphone owners is selected, what is the probability...
-
Given: There is a significant linear correlation between personal income and years of education. Conclusion: More education causes a person's income to rise.
-
The graph of a function is shown below. (a) Sketch '. (b) Use the graphs to estimate (c) Explain the answers you gave in part (b). -4 -2 6 4 2 -2 y f ++ +xx 2 4
-
Consider the plot of power as a function of the allocation ratio, $r$, for the two-sample z-test shown in Figure 4.4 and the $\mathrm{R}$ code for generating plot. a. Recall that $\mathrm{n}$ is the...
-
1. Do you agree with Cairnss assertion that classifications of accounting are simplistic and of little relevance in todays world? Are attempts to classify accounting futile and outmoded? Why or why...
-
Pelican Paint Maufacturers, Inc. uses process costing for its mixing department. It mixed 5 , 0 0 0 units of paint during the period and has 6 0 0 are still being processed ( ending WIP ) in the...
-
If you were assigned to prepare a capital expenditure budget request to add a retail pharmacy in the hospital, which two individuals from your department(s) would you want to have on your team to...
-
Develop a sales forecast for the LED light bulb. Consider some quantitative analysis for this case such as what might be the size of this market? How many households are there? How many potential...
-
One of the criticisms of oligopolies is the adverse impacts these firms have on income distribution. Do you believe that is a valid criticism? Discuss with appropriate examples.
-
If the exchange rate is defined by AUD/USD. According to the purchasing power parity, how does the exchange rate change if the price level in Australia increases relative to that in the US? Explain...
-
Two fishermen on Lake Ontario use a fish finder to help them fish. If sound travels at 1440m/s in the water and it takes 0.086s for the pulse to return. What is the depth of the water where they are...
-
Steph Curry is practicing for the 3-point shooting competition at the All-Star Game. Curry releases the basketball at 10 feet above the ground, and 80 feet away from the basketball hoop. Based on a...
-
Shade the region or regions representing the following set. (AUC) NB
-
Three forces with magnitudes of 70pounds, 40 pounds, and 60 pounds act on an object at angles of 30, 45, and 135, respectively, with the positive x-axis. Find the direction and magnitude of the...
-
If youd like to have $5,000,000 at retirement in 45 years and you expect to earn 10 percent annually, which is around the average return over the past 50 years, what lump sum would you have to invest...
-
Obaidullah Hamzah, who recently sold his Ford Mustang, placed $15,000 in a savings account paying annual compound interest of 7 percent. a. Calculate the amount of money that will be accrued if he...
-
How many years will the following take? a. \($550\) to grow to \($1,049.50\) if invested at 6 percent compounded annually b. \($37\) to grow to \($63.87\) if invested at 9 percent compounded annually...
Study smarter with the SolutionInn App