

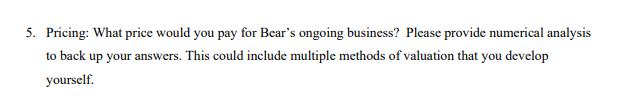
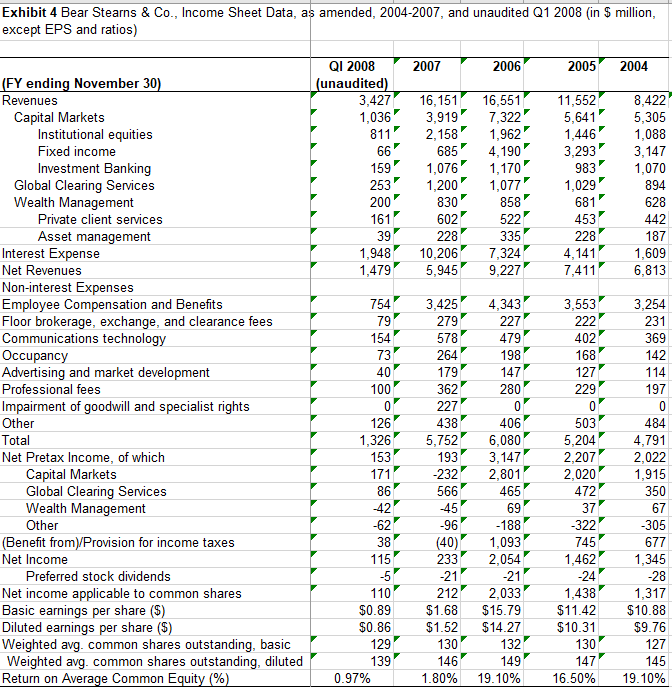
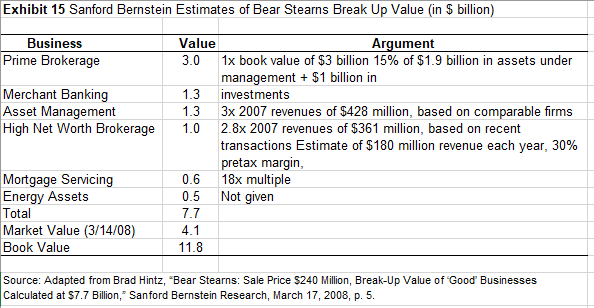
5. Pricing: What price would you pay for Bear's ongoing business? Please provide numerical analysis to...
Fantastic news! We've Found the answer you've been seeking!
Question:
Expert Answer:
To determine the value of Bears ongoing business various valuation methods can be considered Below a... View the full answer

Related Book For 

Cost management a strategic approach
ISBN: 978-0073526942
5th edition
Authors: Edward J. Blocher, David E. Stout, Gary Cokins
Posted Date:
