

5. The graph below illustrates the effects on the population of an animal species beginning with colonization
Fantastic news! We've Found the answer you've been seeking!
Question:
5. The graph below illustrates the effects on the population of an animal species beginning with colonization and ending with the establishment of itself within the ecosystem. Identify three factors that affect the shape of the curve. Explain the effects of these factors throughout the entire time period. (6 points) 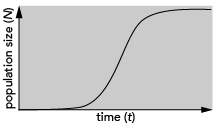
Expert Answer:
Ecological sustainability is the process of changing the animal structure of an ecological community ... View the full answer

Related Book For 

Molecular Cell Biology
ISBN: 978-1429234139
7th edition
Authors: Harvey Lodish, Arnold Berk, Chris A. Kaiser, Monty Krieger, Anthony Bretscher, Hidde Ploegh, Angelika Amon, Matthew P. Scott
Posted Date:
