

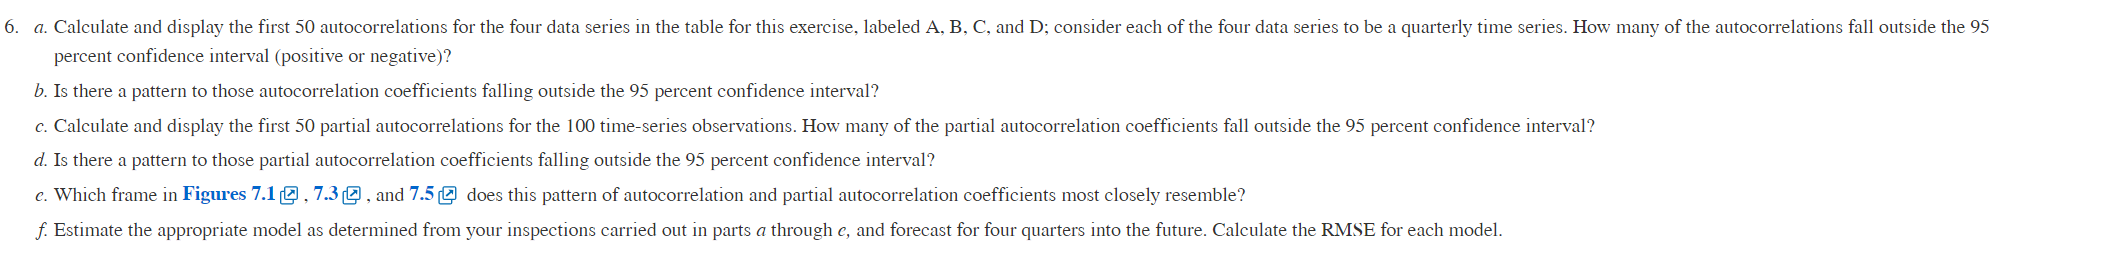
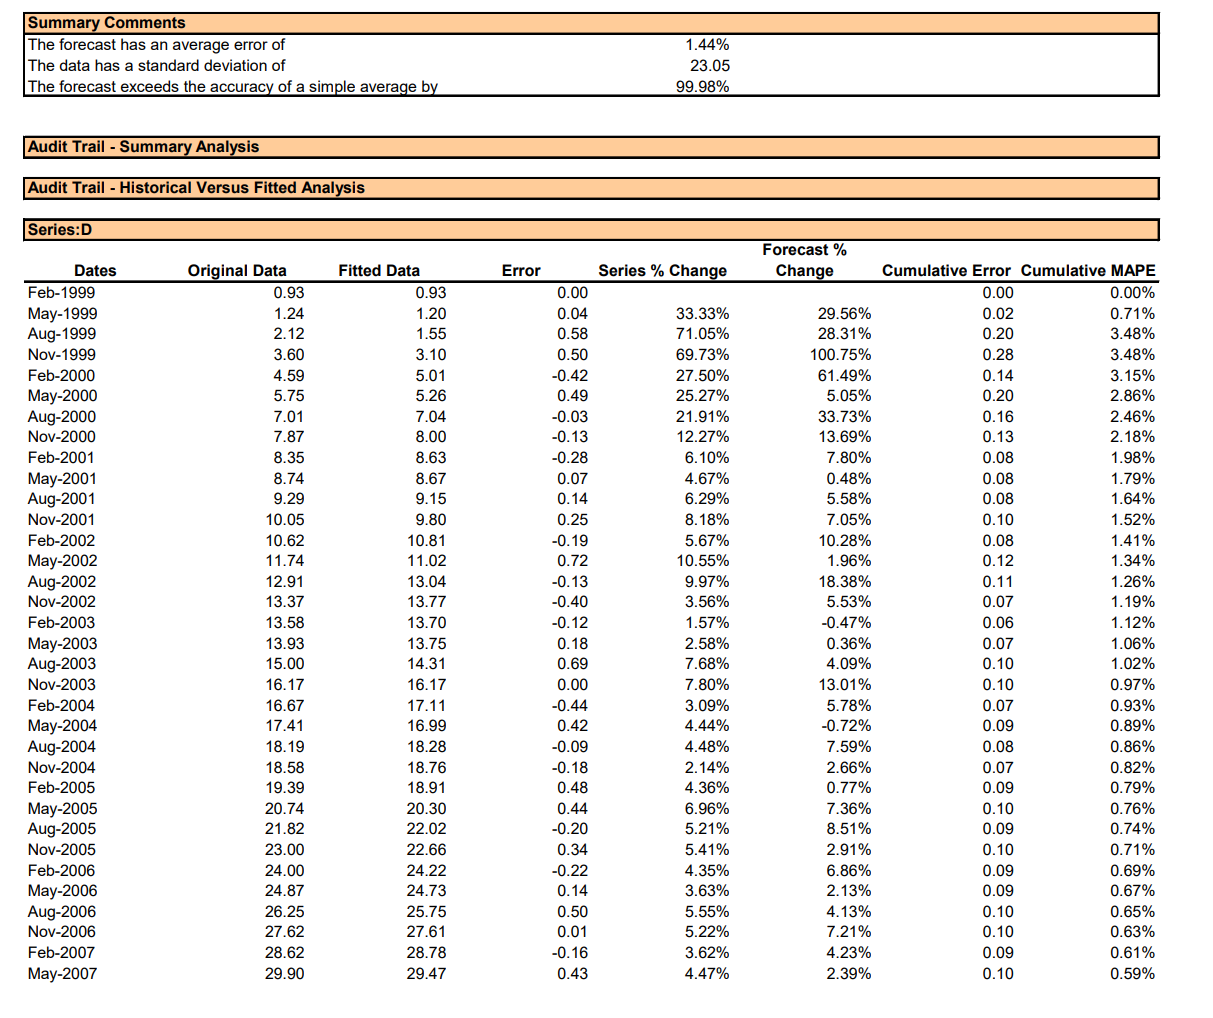
6. a. Calculate and display the first 50 autocorrelations for the four data series in the...
Fantastic news! We've Found the answer you've been seeking!
Question:
Transcribed Image Text:
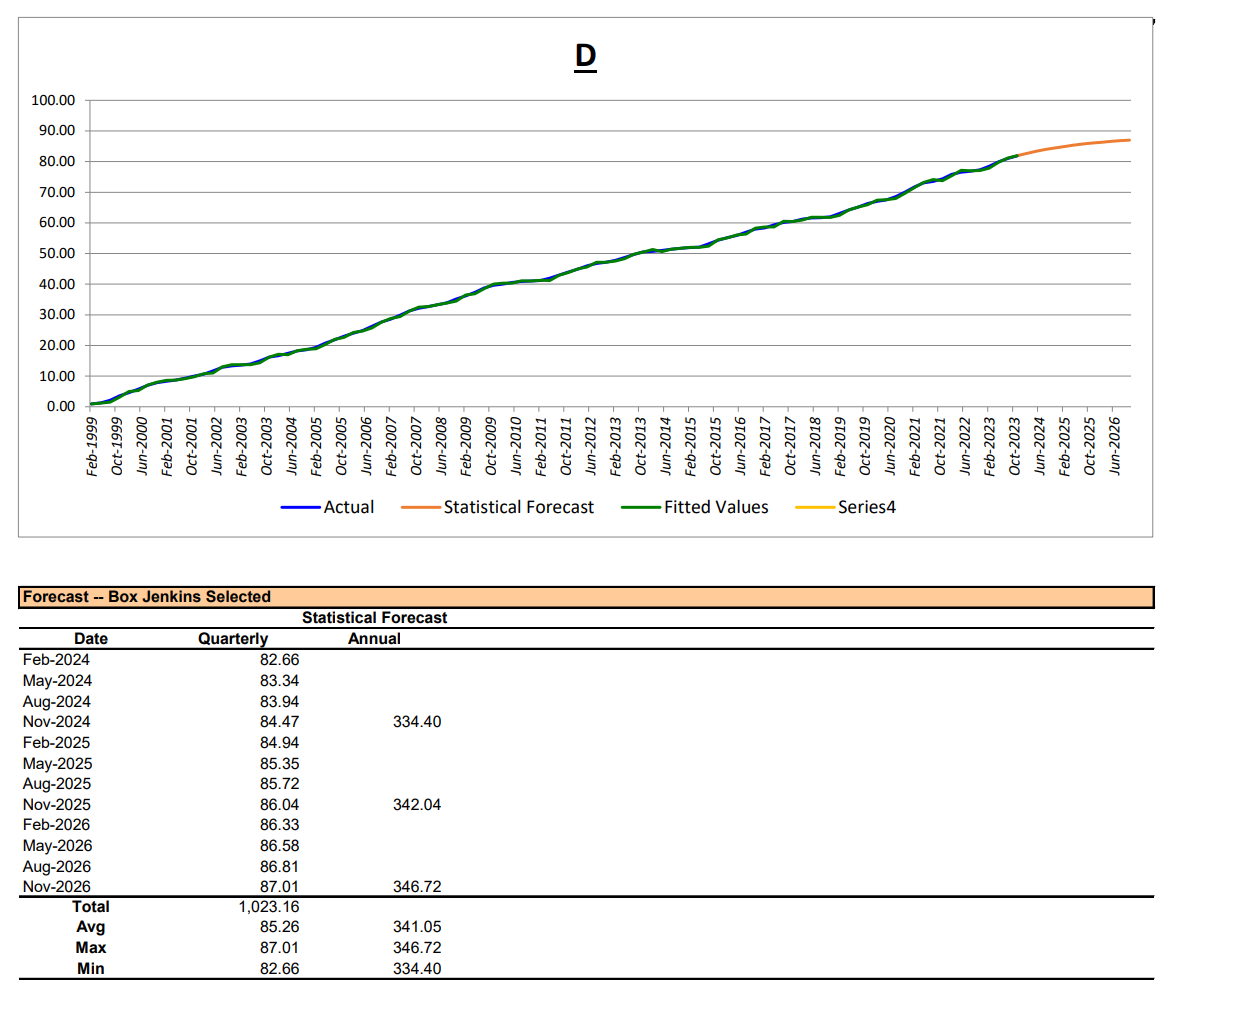
6. a. Calculate and display the first 50 autocorrelations for the four data series in the table for this exercise, labeled A, B, C, and D; consider each of the four data series to be a quarterly time series. How many of the autocorrelations fall outside the 95 percent confidence interval (positive or negative)? b. Is there a pattern to those autocorrelation coefficients falling outside the 95 percent confidence interval? c. Calculate and display the first 50 partial autocorrelations for the 100 time-series observations. How many of the partial autocorrelation coefficients fall outside the 95 percent confidence interval? d. Is there a pattern to those partial autocorrelation coefficients falling outside the 95 percent confidence interval? e. Which frame in Figures 7.1 , 7.3, and 7.5 does this pattern of autocorrelation and partial autocorrelation coefficients most closely resemble? f. Estimate the appropriate model as determined from your inspections carried out in parts a through e, and forecast for four quarters into the future. Calculate the RMSE for each model. 60.00 50.00 40.00 30.00 20.00 10.00 0.00 Feb-1999 Oct-1999 Jun-2000 Feb-2001 Oct-2001 Jun-2002 Feb-2003 100.00 90.00 80.00 70.00 D Oct-2003 Jun-2004 Feb-2005 Oct-2005 Jun-2006 Feb-2007- Oct-2007 Jun-2008 Feb-2009 Oct-2009 Jun-2010 Feb-2011 Oct-2011 Jun-2012 Feb-2013 -Actual _ Statistical Forecast Forecast - Box Jenkins Selected Date Quarterly Statistical Forecast Annual Feb-2024 82.66 May-2024 83.34 Aug-2024 83.94 Nov-2024 84.47 334.40 Feb-2025 84.94 May-2025 85.35 Aug-2025 85.72 Nov-2025 86.04 342.04 Feb-2026 86.33 May-2026 86.58 Aug-2026 86.81 Nov-2026 87.01 346.72 Total 1,023.16 Avg 85.26 341.05 Max 87.01 346.72 Min 82.66 334.40 Oct-2013 Jun-2014 Feb-2015 Oct-2015 Jun-2016 Feb-2017 Fitted Values Series4 Oct-2017- Jun-2018 Feb-2019 Oct-2019 Jun-2020 Feb-2021 Oct-2021 Jun-2022 Feb-2023 Oct-2023 Jun-2024 Feb-2025 Oct-2025 Jun-2026 Summary Comments The forecast has an average error of The data has a standard deviation of The forecast exceeds the accuracy of a simple average by Audit Trail - Summary Analysis Audit Trail - Historical Versus Fitted Analysis 1.44% 23.05 99.98% Series:D Dates Original Data Fitted Data Error Series % Change Forecast % Change Cumulative Error Cumulative MAPE Feb-1999 0.93 0.93 0.00 0.00 0.00% May-1999 1.24 1.20 0.04 33.33% 29.56% 0.02 0.71% Aug-1999 2.12 1.55 0.58 71.05% 28.31% 0.20 3.48% Nov-1999 3.60 3.10 0.50 69.73% 100.75% 0.28 3.48% Feb-2000 4.59 5.01 -0.42 27.50% 61.49% 0.14 3.15% May-2000 5.75 5.26 0.49 25.27% 5.05% 0.20 2.86% Aug-2000 7.01 7.04 -0.03 21.91% 33.73% 0.16 2.46% Nov-2000 7.87 8.00 -0.13 12.27% 13.69% 0.13 2.18% Feb-2001 8.35 8.63 -0.28 6.10% 7.80% 0.08 1.98% May-2001 8.74 8.67 0.07 4.67% 0.48% 0.08 1.79% Aug-2001 9.29 9.15 0.14 6.29% 5.58% 0.08 1.64% Nov-2001 10.05 9.80 0.25 8.18% 7.05% 0.10 1.52% Feb-2002 10.62 10.81 -0.19 5.67% 10.28% 0.08 1.41% May-2002 11.74 11.02 0.72 10.55% 1.96% 0.12 1.34% Aug-2002 12.91 13.04 -0.13 9.97% 18.38% 0.11 1.26% Nov-2002 13.37 13.77 -0.40 3.56% 5.53% 0.07 1.19% Feb-2003 13.58 13.70 -0.12 1.57% -0.47% 0.06 1.12% May-2003 13.93 13.75 0.18 2.58% 0.36% 0.07 1.06% Aug-2003 15.00 14.31 0.69 7.68% 4.09% 0.10 1.02% Nov-2003 16.17 16.17 0.00 7.80% 13.01% 0.10 0.97% Feb-2004 16.67 17.11 -0.44 3.09% 5.78% 0.07 0.93% May-2004 17.41 16.99 0.42 4.44% -0.72% 0.09 0.89% Aug-2004 18.19 18.28 -0.09 4.48% 7.59% 0.08 0.86% Nov-2004 18.58 18.76 -0.18 2.14% 2.66% 0.07 0.82% Feb-2005 19.39 18.91 0.48 4.36% 0.77% 0.09 0.79% May-2005 20.74 20.30 0.44 6.96% 7.36% 0.10 0.76% Aug-2005 21.82 22.02 -0.20 5.21% 8.51% 0.09 0.74% Nov-2005 23.00 22.66 0.34 5.41% 2.91% 0.10 0.71% Feb-2006 24.00 24.22 -0.22 4.35% 6.86% 0.09 0.69% May-2006 24.87 24.73 0.14 3.63% 2.13% 0.09 0.67% Aug-2006 26.25 25.75 0.50 5.55% 4.13% 0.10 0.65% Nov-2006 27.62 27.61 0.01 5.22% 7.21% 0.10 0.63% Feb-2007 28.62 28.78 -0.16 3.62% 4.23% 0.09 0.61% May-2007 29.90 29.47 0.43 4.47% 2.39% 0.10 0.59% Audit Trail -- Out of Sample Table (Box JenkinsSelected) Date Feb-2023 May-2023 Aug-2023 Nov-2023 Avg Max Min StDev Var Median Audit Trail - Statistics Accuracy Measures Original Data Fitted Data MAD Cumulative MAD MAPE Cumulative MAPE Cumulative SSE 78.51 77.84 0.67 0.67 0.85% 0.85% 0.44 79.95 78.27 1.68 1.17 2.10% 1.48% 1.64 81.03 78.65 2.38 1.57 2.93% 1.96% 2.97 81.89 78.99 2.90 1.91 3.54% 2.36% 4.33 80.35 78.44 1.91 1.33 2.36% 1.66% 2.34 81.89 78.99 2.90 1.91 3.54% 2.36% 4.33 78.51 77.84 0.67 0.67 0.85% 0.85% 0.44 1.46 0.49 0.97 0.53 1.17% 0.65% 1.68 2.13 0.24 0.93 0.29 0.01% 0.00% 2.82 80.49 78.46 2.03 1.37 2.52% 1.72% 2.30 Value Forecast Statistics Mean Standard Deviation WMAPE R-Square Method Statistics Method Selected Model Selected 0.01% 99.98% Value Box Jenkins ARIMA(2,1,1) * (0,0,0) T-Test For Non Seasonal AR T-Test For Non Seasonal AR T-Test For Non Seasonal MA 1.90 1.55 -2.93 ForecastX Configuration Parameters Item Data range selected Time scale for data Periods to forecast Seasonal Length Replace Outliers Activated Replace Outliers Standard Deviations Replace Outliers Forecasting Technique Replace Missing Values Replace Missing Values (Lower Limit) Replace Missing Values (Upper Limit) Remove Leading Zeroes Value [C7P6.xlsx]Sheet1!$A$1:$D$101 Quarterly 12.00 No No Remove Trailing Zeroes Use Holdback Evaluation Holdback Evaluation Period Apply Tracking Signal Apply Tracking Signal (Under Forecast Percentage) Apply Tracking Signal (Over Forecast Percentage) Forecast Method Selected Report Details Run Date: 11/16/2023 2:28:58 PM Author: rherna42 Note: Yes No Yes 4.00 No Box Jenkins Value 41.38 23.05 6. a. Calculate and display the first 50 autocorrelations for the four data series in the table for this exercise, labeled A, B, C, and D; consider each of the four data series to be a quarterly time series. How many of the autocorrelations fall outside the 95 percent confidence interval (positive or negative)? b. Is there a pattern to those autocorrelation coefficients falling outside the 95 percent confidence interval? c. Calculate and display the first 50 partial autocorrelations for the 100 time-series observations. How many of the partial autocorrelation coefficients fall outside the 95 percent confidence interval? d. Is there a pattern to those partial autocorrelation coefficients falling outside the 95 percent confidence interval? e. Which frame in Figures 7.1 , 7.3, and 7.5 does this pattern of autocorrelation and partial autocorrelation coefficients most closely resemble? f. Estimate the appropriate model as determined from your inspections carried out in parts a through e, and forecast for four quarters into the future. Calculate the RMSE for each model. 60.00 50.00 40.00 30.00 20.00 10.00 0.00 Feb-1999 Oct-1999 Jun-2000 Feb-2001 Oct-2001 Jun-2002 Feb-2003 100.00 90.00 80.00 70.00 D Oct-2003 Jun-2004 Feb-2005 Oct-2005 Jun-2006 Feb-2007- Oct-2007 Jun-2008 Feb-2009 Oct-2009 Jun-2010 Feb-2011 Oct-2011 Jun-2012 Feb-2013 -Actual _ Statistical Forecast Forecast - Box Jenkins Selected Date Quarterly Statistical Forecast Annual Feb-2024 82.66 May-2024 83.34 Aug-2024 83.94 Nov-2024 84.47 334.40 Feb-2025 84.94 May-2025 85.35 Aug-2025 85.72 Nov-2025 86.04 342.04 Feb-2026 86.33 May-2026 86.58 Aug-2026 86.81 Nov-2026 87.01 346.72 Total 1,023.16 Avg 85.26 341.05 Max 87.01 346.72 Min 82.66 334.40 Oct-2013 Jun-2014 Feb-2015 Oct-2015 Jun-2016 Feb-2017 Fitted Values Series4 Oct-2017- Jun-2018 Feb-2019 Oct-2019 Jun-2020 Feb-2021 Oct-2021 Jun-2022 Feb-2023 Oct-2023 Jun-2024 Feb-2025 Oct-2025 Jun-2026 Summary Comments The forecast has an average error of The data has a standard deviation of The forecast exceeds the accuracy of a simple average by Audit Trail - Summary Analysis Audit Trail - Historical Versus Fitted Analysis 1.44% 23.05 99.98% Series:D Dates Original Data Fitted Data Error Series % Change Forecast % Change Cumulative Error Cumulative MAPE Feb-1999 0.93 0.93 0.00 0.00 0.00% May-1999 1.24 1.20 0.04 33.33% 29.56% 0.02 0.71% Aug-1999 2.12 1.55 0.58 71.05% 28.31% 0.20 3.48% Nov-1999 3.60 3.10 0.50 69.73% 100.75% 0.28 3.48% Feb-2000 4.59 5.01 -0.42 27.50% 61.49% 0.14 3.15% May-2000 5.75 5.26 0.49 25.27% 5.05% 0.20 2.86% Aug-2000 7.01 7.04 -0.03 21.91% 33.73% 0.16 2.46% Nov-2000 7.87 8.00 -0.13 12.27% 13.69% 0.13 2.18% Feb-2001 8.35 8.63 -0.28 6.10% 7.80% 0.08 1.98% May-2001 8.74 8.67 0.07 4.67% 0.48% 0.08 1.79% Aug-2001 9.29 9.15 0.14 6.29% 5.58% 0.08 1.64% Nov-2001 10.05 9.80 0.25 8.18% 7.05% 0.10 1.52% Feb-2002 10.62 10.81 -0.19 5.67% 10.28% 0.08 1.41% May-2002 11.74 11.02 0.72 10.55% 1.96% 0.12 1.34% Aug-2002 12.91 13.04 -0.13 9.97% 18.38% 0.11 1.26% Nov-2002 13.37 13.77 -0.40 3.56% 5.53% 0.07 1.19% Feb-2003 13.58 13.70 -0.12 1.57% -0.47% 0.06 1.12% May-2003 13.93 13.75 0.18 2.58% 0.36% 0.07 1.06% Aug-2003 15.00 14.31 0.69 7.68% 4.09% 0.10 1.02% Nov-2003 16.17 16.17 0.00 7.80% 13.01% 0.10 0.97% Feb-2004 16.67 17.11 -0.44 3.09% 5.78% 0.07 0.93% May-2004 17.41 16.99 0.42 4.44% -0.72% 0.09 0.89% Aug-2004 18.19 18.28 -0.09 4.48% 7.59% 0.08 0.86% Nov-2004 18.58 18.76 -0.18 2.14% 2.66% 0.07 0.82% Feb-2005 19.39 18.91 0.48 4.36% 0.77% 0.09 0.79% May-2005 20.74 20.30 0.44 6.96% 7.36% 0.10 0.76% Aug-2005 21.82 22.02 -0.20 5.21% 8.51% 0.09 0.74% Nov-2005 23.00 22.66 0.34 5.41% 2.91% 0.10 0.71% Feb-2006 24.00 24.22 -0.22 4.35% 6.86% 0.09 0.69% May-2006 24.87 24.73 0.14 3.63% 2.13% 0.09 0.67% Aug-2006 26.25 25.75 0.50 5.55% 4.13% 0.10 0.65% Nov-2006 27.62 27.61 0.01 5.22% 7.21% 0.10 0.63% Feb-2007 28.62 28.78 -0.16 3.62% 4.23% 0.09 0.61% May-2007 29.90 29.47 0.43 4.47% 2.39% 0.10 0.59% Audit Trail -- Out of Sample Table (Box JenkinsSelected) Date Feb-2023 May-2023 Aug-2023 Nov-2023 Avg Max Min StDev Var Median Audit Trail - Statistics Accuracy Measures Original Data Fitted Data MAD Cumulative MAD MAPE Cumulative MAPE Cumulative SSE 78.51 77.84 0.67 0.67 0.85% 0.85% 0.44 79.95 78.27 1.68 1.17 2.10% 1.48% 1.64 81.03 78.65 2.38 1.57 2.93% 1.96% 2.97 81.89 78.99 2.90 1.91 3.54% 2.36% 4.33 80.35 78.44 1.91 1.33 2.36% 1.66% 2.34 81.89 78.99 2.90 1.91 3.54% 2.36% 4.33 78.51 77.84 0.67 0.67 0.85% 0.85% 0.44 1.46 0.49 0.97 0.53 1.17% 0.65% 1.68 2.13 0.24 0.93 0.29 0.01% 0.00% 2.82 80.49 78.46 2.03 1.37 2.52% 1.72% 2.30 Value Forecast Statistics Mean Standard Deviation WMAPE R-Square Method Statistics Method Selected Model Selected 0.01% 99.98% Value Box Jenkins ARIMA(2,1,1) * (0,0,0) T-Test For Non Seasonal AR T-Test For Non Seasonal AR T-Test For Non Seasonal MA 1.90 1.55 -2.93 ForecastX Configuration Parameters Item Data range selected Time scale for data Periods to forecast Seasonal Length Replace Outliers Activated Replace Outliers Standard Deviations Replace Outliers Forecasting Technique Replace Missing Values Replace Missing Values (Lower Limit) Replace Missing Values (Upper Limit) Remove Leading Zeroes Value [C7P6.xlsx]Sheet1!$A$1:$D$101 Quarterly 12.00 No No Remove Trailing Zeroes Use Holdback Evaluation Holdback Evaluation Period Apply Tracking Signal Apply Tracking Signal (Under Forecast Percentage) Apply Tracking Signal (Over Forecast Percentage) Forecast Method Selected Report Details Run Date: 11/16/2023 2:28:58 PM Author: rherna42 Note: Yes No Yes 4.00 No Box Jenkins Value 41.38 23.05
Expert Answer:

Posted Date:
Students also viewed these economics questions
-
Discuss which organizational structure (i.e. functional, product-market divisional, matrix) you would recommend Guelph General Hospital implement, assuming the hospital moves forward with the...
-
a. Calculate and display the first 50 autocorrelations for the four data series in the table for this exercise, labeled A, B, C, and D; consider each of the four data series to be a quarterly time...
-
Which of following best describes tax loss harvesting? Selling bonds for a loss Writing off business expenses Collecting dividends received from stocks or mutual funds Maximizing tax savings from...
-
In Problems 4358, (a) Find the vertex and the axis of symmetry of each quadratic function, and determine whether the graph is concave up or concave down. (b) Find the y-intercept and the...
-
A tribal nation in Kansas is considering building a gas station to accommodate people traveling through their reservation. Before undergoing the considerable expense for construction, the tribe...
-
Compare and contrast a marketing Web site and a branded community Web site? (AACSB: Written and oral communication).
-
How do teams work?
-
Worldwide Publishing completed the following transactions for one subscriber during 2012: Oct 1 Sold a one-year subscription, collecting cash of $2,400, plus sales tax of 9%. Nov 15 Remitted (paid)...
-
2. Jake owns 100 shares of company X' stock and has been receiving dividend for the past few years. Very recently the company announced (and market expects) that it will continue to pay dividend for...
-
Lemon Tree Inc. has gatherd the following data for one of its products: Direct materials standard (2 pounds per unit @ $0.40/lb.) Actual direct materials purchased Actual Direct Materials Used (AQU)...
-
Current dividend $7.80, years until dividend ceases 13, required return 11.2%. Calculate the share price
-
In the figure below, two elastic members AB and CD are of rectangular cross section and have the same cross-sectional area A. They are made of the same material with Young's modulus E. They are pined...
-
Consider the following figure. 8.00 C + y 2.00 . 4.00 C @ (a) Find the electric potential, taking zero at infinity, at the upper right corner (the corner without a charge) of the rectangle in the...
-
Silven Industries, which manufactures and sells a highly successful line of summer lotions and insect repellents, has decided to diversify in order to stabilize sales throughout the year. A natural...
-
In more simplified format and at your own words advise What are the benefits of category management?
-
The objective is to determine how much, if any, of each cargo should be accepted and how to distribute the cargo amoung the compartments in order maximize the total profit of the flight. Additional...
-
Presented below are income statements prepared on a LIFO and FIFO basis for Kenseth Company, which started operations on January 1, 2024. The company presently uses the LIFO method of pricing its...
-
Why and how do tax authorities get involved in the transfer pricing situation?
-
Assume a VAT situation where the tax rate is 15 percent, with export sales exempt. The manufacturer does not purchase inputs on which VAT has been paid, and its net selling price to the wholesaler...
-
A Galex Com pain, a manufacturer of stereo systems, started its production in October 2002. For the preceding 3 years Galex had been a retailer of stereo systems. Alter a thorough survey ol stereo...

Study smarter with the SolutionInn App