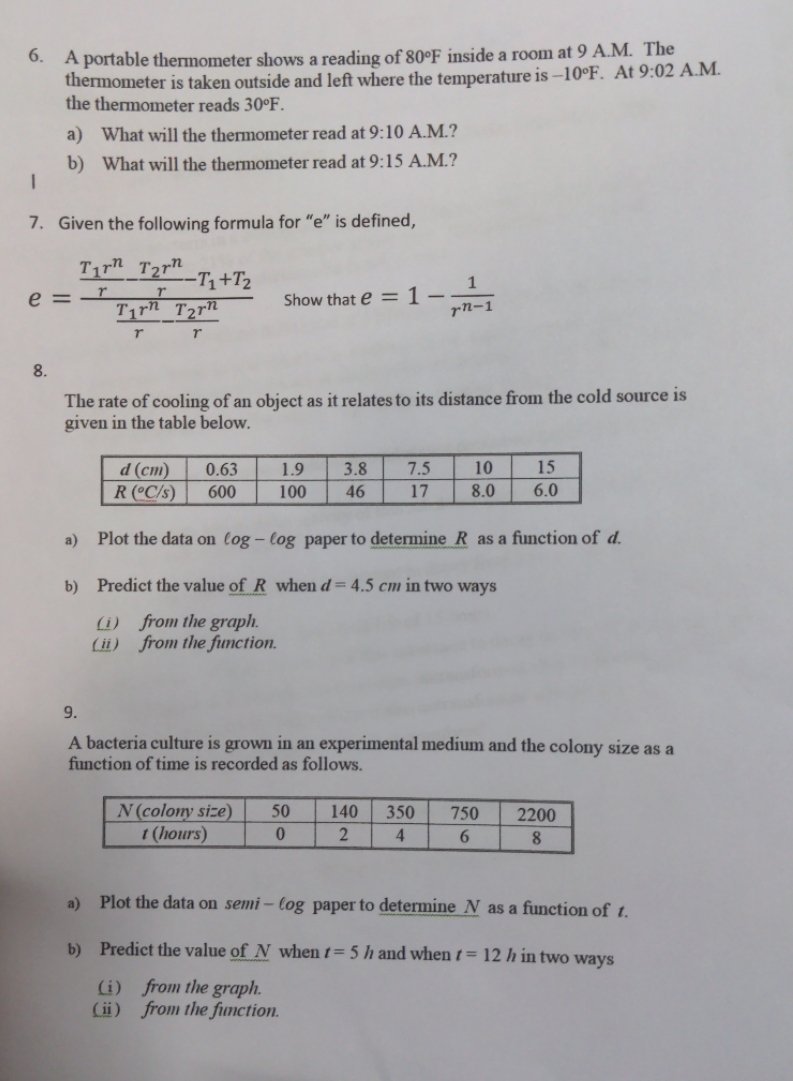
6. A portable thermometer shows a reading of 80F inside a room at 9 A.M. The...
Fantastic news! We've Found the answer you've been seeking!
Question:
Transcribed Image Text:
6. A portable thermometer shows a reading of 80F inside a room at 9 A.M. The thermometer is taken outside and left where the temperature is -10F. At 9:02 A.M. the thermometer reads 30F. 1 a) What will the thermometer read at 9:10 A.M.? b) What will the thermometer read at 9:15 A.M.? 7. Given the following formula for "e" is defined, Tirn Tarn e=r -T+T T Tirn Tarn r r Show that e=1- 1 rn-1 8. The rate of cooling of an object as it relates to its distance from the cold source is given in the table below. d (cm) 0.63 1.9 3.8 7.5 10 15 R (C/s) 600 100 46 17 8.0 6.0 a) Plot the data on log-log paper to determine R as a function of d. b) Predict the value of R when d=4.5 cm in two ways (i) from the graph. (ii) from the function. 9. A bacteria culture is grown in an experimental medium and the colony size as a function of time is recorded as follows. N (colony size) 50 t (hours) 140 0 2 350 750 4 6 2200 8 a) Plot the data on semi-log paper to determine N as a function of t. b) Predict the value of N when t=5 h and when t= 12 h in two ways (i) from the graph. (ii) from the function. 6. A portable thermometer shows a reading of 80F inside a room at 9 A.M. The thermometer is taken outside and left where the temperature is -10F. At 9:02 A.M. the thermometer reads 30F. 1 a) What will the thermometer read at 9:10 A.M.? b) What will the thermometer read at 9:15 A.M.? 7. Given the following formula for "e" is defined, Tirn Tarn e=r -T+T T Tirn Tarn r r Show that e=1- 1 rn-1 8. The rate of cooling of an object as it relates to its distance from the cold source is given in the table below. d (cm) 0.63 1.9 3.8 7.5 10 15 R (C/s) 600 100 46 17 8.0 6.0 a) Plot the data on log-log paper to determine R as a function of d. b) Predict the value of R when d=4.5 cm in two ways (i) from the graph. (ii) from the function. 9. A bacteria culture is grown in an experimental medium and the colony size as a function of time is recorded as follows. N (colony size) 50 t (hours) 140 0 2 350 750 4 6 2200 8 a) Plot the data on semi-log paper to determine N as a function of t. b) Predict the value of N when t=5 h and when t= 12 h in two ways (i) from the graph. (ii) from the function.
Expert Answer:
Related Book For
Posted Date:
Students also viewed these mathematics questions
-
Microkernel operating systems aim to address perceived modularity and reliability issues in traditional "monolithic" operating systems. (i) Describe the typical architecture of a microkernel...
-
CANMNMM January of this year. (a) Each item will be held in a record. Describe all the data structures that must refer to these records to implement the required functionality. Describe all the...
-
One item is omitted in each of the following summaries of balance sheet and income statement data for the following four different corporations: Determine the missing amounts, identifying them...
-
Some airlines, such as Southwest, have survived as niche players without extensive international connections. Can they continue this strategy?
-
Martin Footwear Co. produces high-quality shoes. To prepare for next year's marketing campaign, the company's controller has prepared the following information for the current year, 2016:...
-
The transactions for Little Tykes Daycare, Inc., for the month of January 2010 are posted in the following T-accounts. Requirements 1. Calculate account balances. 2. Prepare the trial balance for...
-
Waterloo Co. sells product P-14 at a price of $48 a unit. The per-unit cost data are direct materials $15, direct labour $10, and overheads $12 (75% variable). Waterloo Co. has sufficient capacity to...
-
Consumer's income- how would a change in your potential customers' incomes affect Demand for sprouts famers market product? Elasticity- How strongly (not which direction) will raising or lowering the...
-
The casino game is played by a person called the shooter, who rolls two dice. There are two phases to the game. The first phase is called the 'come out' phase, and the second is called the 'point'...
-
Define the correlation coefficient, \(ho_{X Y}\).
-
What is a marginal density function?
-
True or False. The autocorrelation function \(R\left(t_{1}, t_{2} ight)\) is the same as \(E\left[x\left(t_{1} ight) x\left(t_{2} ight) ight]\).
-
True or False. The mean square value of \(x(t)\) can be determined as \(E\left[x^{2} ight]=R(0)\).
-
What is an autocorrelation function?
-
Since the United States has not adopted IFRS, there have to be many concerns with the way statements are reported, but are we afraid that politics might influence more corruption, especially when...
-
Why do CPA firms sometimes use a combination of positive and negative confirmations on the same audit?
-
Make a list of at least four things you learned from this section. (a) Were any or all of the things discussed in the Safety Analysis of the Incident and BowTie Diagram in place when the reactor...
-
Go to Chapter 1 Evaluation on the Web site. Click on i>Clicker Questions (http://www.umich.edu/~elements/6e/01chap/iclicker_ch1_q1.html) and view at least five i>clicker questions. Choose one that...
-
What if someone suggested you could use the solution to the flow-dispersion-reactor equation, Equation (18-18), for a second-order equation by linearizing the rate law by lettering rA=kCA2(kCA0/2)CA...
-
The tube is subjected to a torque of 750 N. m. Determine the amount of this torque that is resisted by the gray shaded section. Solve the problem two ways: (a) by using the torsion formula, (b) by...
-
The solid shaft has a diameter of 0.75 in. If it is subjected to the torques shown, determine the maximum shear stress developed in regions BC and DE of the shaft. The bearings at A and F allow free...
-
The solid shaft has a diameter of 0.75 in. If it is subjected to the torques shown, determine the maximum shear stress developed in regions CD and EF of the shaft. The bearings at A and F allow free...
Study smarter with the SolutionInn App