Answered step by step
Verified Expert Solution
Question
1 Approved Answer
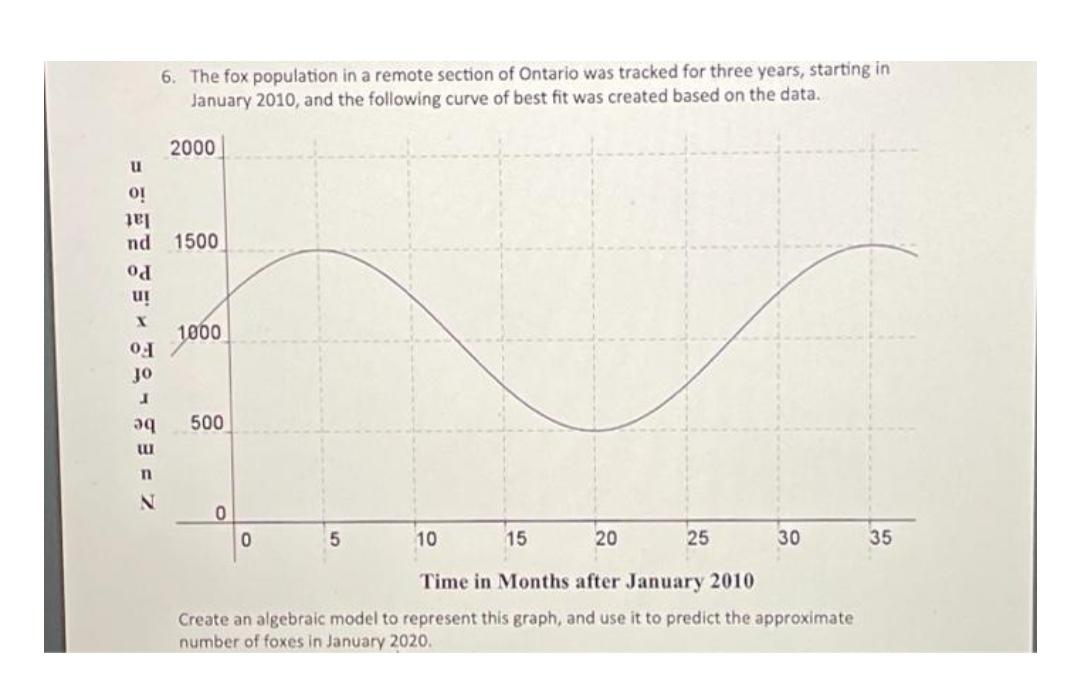
6. The fox population in a remote section of Ontario was tracked for three years, starting in January 2010, and the following curve of

6. The fox population in a remote section of Ontario was tracked for three years, starting in January 2010, and the following curve of best fit was created based on the data. 2000 u o! lat nd 1500 1000 of 500 be 10 15 20 25 30 35 Time in Months after January 2010 Create an algebraic model to represent this graph, and use it to predict the approximate number of foxes in January 2020.
Step by Step Solution
★★★★★
3.46 Rating (159 Votes )
There are 3 Steps involved in it
Step: 1

Get Instant Access to Expert-Tailored Solutions
See step-by-step solutions with expert insights and AI powered tools for academic success
Step: 2

Step: 3

Document Format ( 2 attachments)
63619eaecd965_235769.pdf
180 KBs PDF File
63619eaecd965_235769.docx
120 KBs Word File
Ace Your Homework with AI
Get the answers you need in no time with our AI-driven, step-by-step assistance
Get Started


