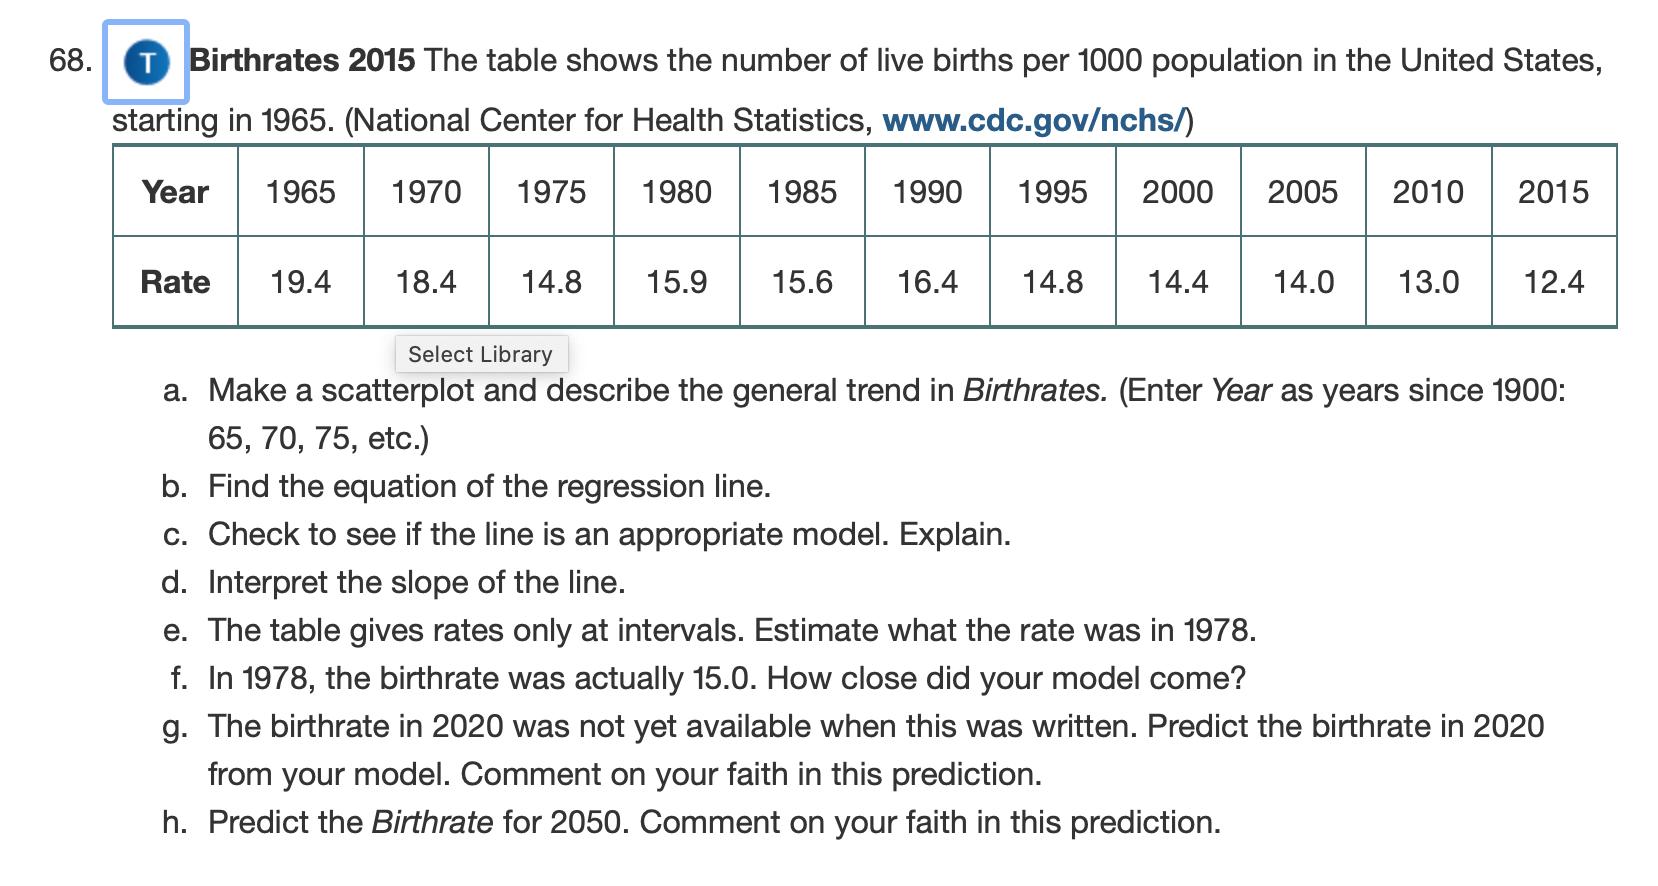
68. T Birthrates 2015 The table shows the number of live births per 1000 population in...
Fantastic news! We've Found the answer you've been seeking!
Question:
Transcribed Image Text:
68. T Birthrates 2015 The table shows the number of live births per 1000 population in the United States, starting in 1965. (National Center for Health Statistics, www.cdc.gov/nchs/) Year 1965 1970 1975 1980 1985 1995 2000 2005 2010 2015 Rate 19.4 18.4 1990 14.8 15.9 15.6 16.4 14.8 14.4 14.0 13.0 12.4 Select Library a. Make a scatterplot and describe the general trend in Birthrates. (Enter Year as years since 1900: 65, 70, 75, etc.) b. Find the equation of the regression line. c. Check to see if the line is an appropriate model. Explain. d. Interpret the slope of the line. e. The table gives rates only at intervals. Estimate what the rate was in 1978. f. In 1978, the birthrate was actually 15.0. How close did your model come? g. The birthrate in 2020 was not yet available when this was written. Predict the birthrate in 2020 from your model. Comment on your faith in this prediction. h. Predict the Birthrate for 2050. Comment on your faith in this prediction. 68. T Birthrates 2015 The table shows the number of live births per 1000 population in the United States, starting in 1965. (National Center for Health Statistics, www.cdc.gov/nchs/) Year 1965 1970 1975 1980 1985 1995 2000 2005 2010 2015 Rate 19.4 18.4 1990 14.8 15.9 15.6 16.4 14.8 14.4 14.0 13.0 12.4 Select Library a. Make a scatterplot and describe the general trend in Birthrates. (Enter Year as years since 1900: 65, 70, 75, etc.) b. Find the equation of the regression line. c. Check to see if the line is an appropriate model. Explain. d. Interpret the slope of the line. e. The table gives rates only at intervals. Estimate what the rate was in 1978. f. In 1978, the birthrate was actually 15.0. How close did your model come? g. The birthrate in 2020 was not yet available when this was written. Predict the birthrate in 2020 from your model. Comment on your faith in this prediction. h. Predict the Birthrate for 2050. Comment on your faith in this prediction.
Expert Answer:
Answer rating: 100% (QA)
Scatterplot see the graph attached Regression equation y 01142x 24259 check to see if the line is ap... View the full answer
Related Book For
Stats Data and Models
ISBN: 978-0321986498
4th edition
Authors: Richard D. De Veaux, Paul D. Velleman, David E. Bock
Posted Date:
Students also viewed these mathematics questions
-
The table shows the number of live births per 1000 population in the United States, starting in 1965. a) Make a scatterplot and describe the general trend in Birthrates. (Enter Year as years since...
-
The table shows the number of live births per 1000 women aged 15-44 years in the United States, starting in 1965. (National Center for Health Statistics, www.cdc.gov/nchs/) a) Make a scatterplot and...
-
The table shows the world population size (in billions) since 1900. a. Let x denote the number of years since 1900. The exponential regression model fitted to y = population size and x gives = 1.424...
-
A beam of light enters the end of an optic fiber as shown in Fig. 23-52. Show that we can guarantee total internal reflection at the side surface of the material (at point a), if the index of...
-
Pro forma income statement At the end of last year, Roberts Inc. reported the following income statement (in millions of dollars): Sales ................... $3,000 Operating cost excluding...
-
What accounts are debited and credited when an employer records the electronic transfer of FICA taxes and federal income taxes that have been withheld?
-
Due to a nationwide recession, Amesbury Systems merchandise inventory is gathering dust. It is now October 31,2010, and the \($163,300\) that Amesbury Systems paid for its ending inventory is...
-
Total wages and salaries for the month of January were $50,000. Because it is January, no employee has yet reached the FICA tax cap amount, so the full FICA tax percentage is applicable to the entire...
-
Changes in the balance sheet accounts at June 30, 20X1 and 20X2 for the Poker Company are presented below: Assets Cash Accounts receivable Inventory Long-term investments Increase (Decrease) $...
-
In cell C11, construct a formula to calculate the annual projected street maintenance costs for the year 2025 after the projected increase of 5% is applied. Use absolute cell references as necessary....
-
Suppose that an economy consists of only two individuals. Leland has $1510 available to spend on goods. He decides to purchase $370 worth of produce from Charlotte in the current year. No other...
-
Perit Industries has $155,000 to invest in one of the following two projects: Project B $ 0 Cost of equipment required Working capital investment required Annual cash inflows Salvage value of...
-
K In fall 2006, Pace University in New York raised its annual tuition from $24,250 to $29,000. Freshman enrollment declined from 1,450 in fall 2005 to 1,150 in fall 2006. Assuming that the demand...
-
a) Let R be the relation on the set A = {1, 2, 3, 4} defined by R = {(x, y)/x + 3y 12}. Find the matrix representing R R. b) Suppose that the relation R is defined on the set Z where aRb means: ba",...
-
One version of a Tesla electric car can go from rest to 2 6 . 8 meter / s ( 6 0 . 0 miles per hour ) in just 2 . 3 0 seconds. ( a ) Find the average acceleration in m / s 2 . ( b ) Assuming constant...
-
c. Use a rectangular array of base-ten pieces to illustrate the quotient. Label the components of the (generic) sketch and answer the questions. Assume the quotient is the top of the array. i) The...
-
Suppose that an investor expects to receive fresh money in the amounts of 8 M, M.... Mr at the beginning of each of the next T months. The objective is to make an investment plan that maximizes the...
-
Which task is performed by a book-keeper? A. Analysing the trading results B. Entering transactions in the ledger C. Preparing year-end financial statements D. Providing information for...
-
Suppose ACT, Inc. wants to update their information from Exercise 34 on the percentage of freshmen that return for a second year of college. a) They want to cut the stated margin of error in half....
-
In Exercise 3 a) What is the null hypothesis tested for the coefficient of Run Time in the regression of Exercise 3? b) What is the f-statistic corresponding to this test? c) Why is this f-statistic...
-
Mary is deciding whether to book the cheaper flight home from college after her final exams, but she's unsure when her last exam will be. She thinks there is only a 20% chance that the exam will be...
-
Find the area under the standard normal curve to the right of a. z = 0.47 b. z = 2.91 c. z = 2.04 d. z = 1.09
-
Find the area under the standard normal curve that lies outside the interval between a. z = 0.38 and z = 1.02 b. z = 1.42 and z = 1.78 c. z = 0.01 and z = 2.67 d. z = 2.45 and z = 0.34
-
Find the area under the standard normal curve that lies outside the interval between a. z = 1.11 and z = 3.21 b. z = 1.93 and z = 0.59 c. z = 0.46 and z = 1.75 d. z = 2.73 and z = 1.39
Study smarter with the SolutionInn App