

7 8. 9. 10. O Each year Forbes ranks the world's most valuable brands. A portion...
Fantastic news! We've Found the answer you've been seeking!
Question:
Transcribed Image Text:
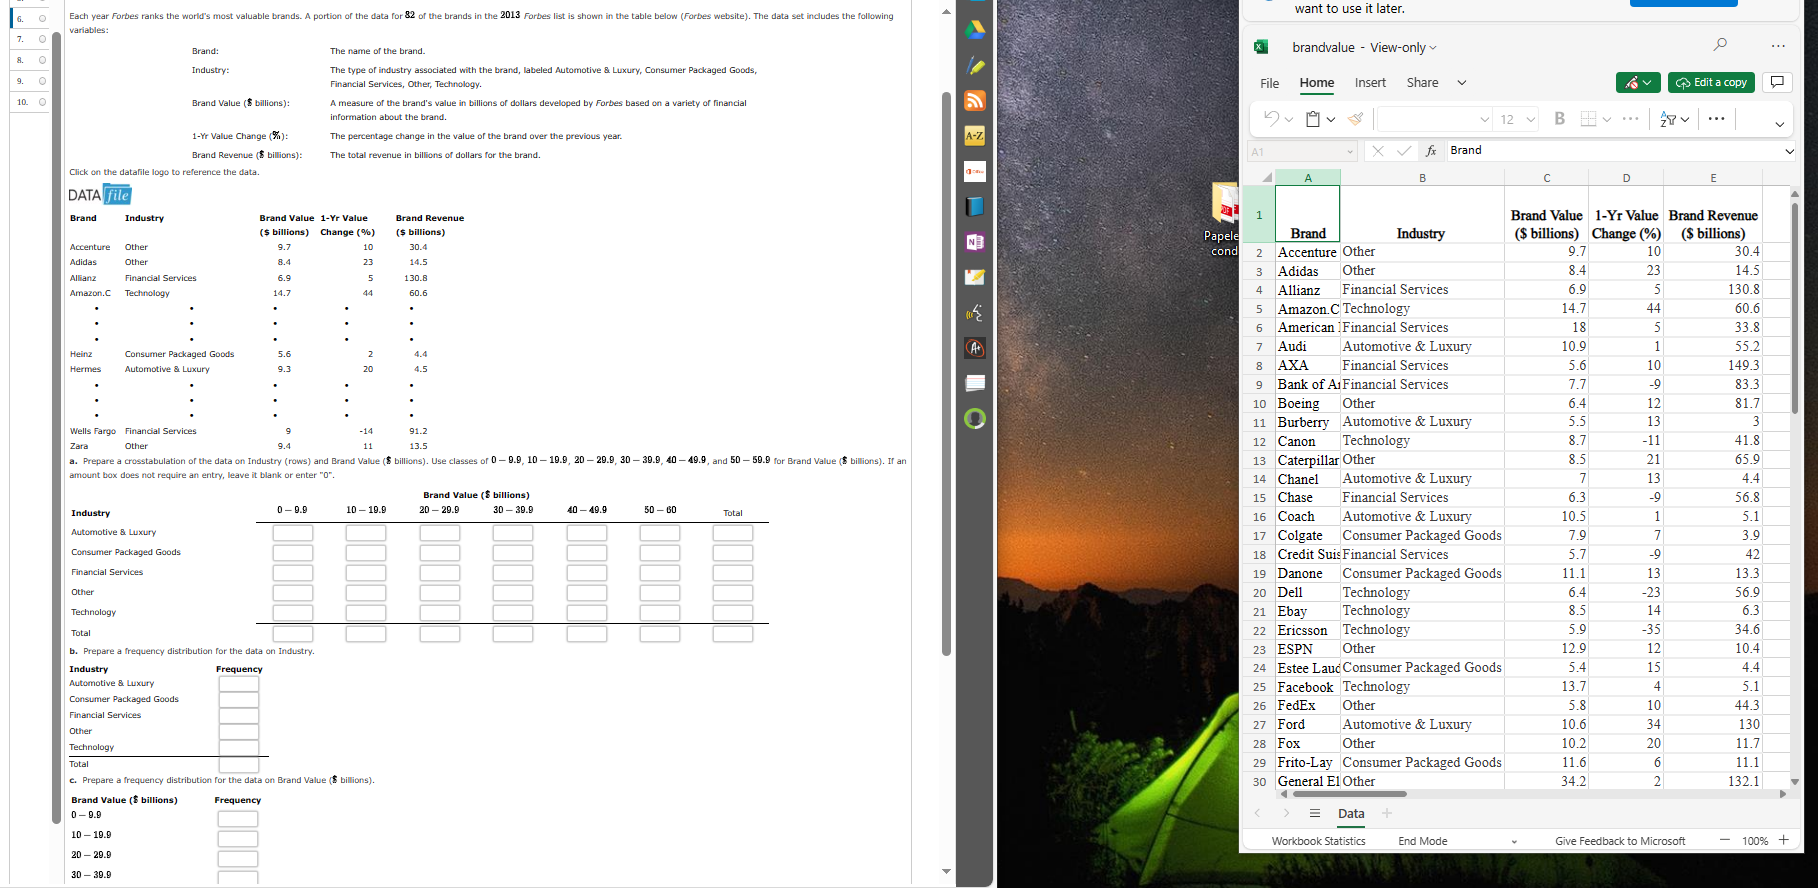
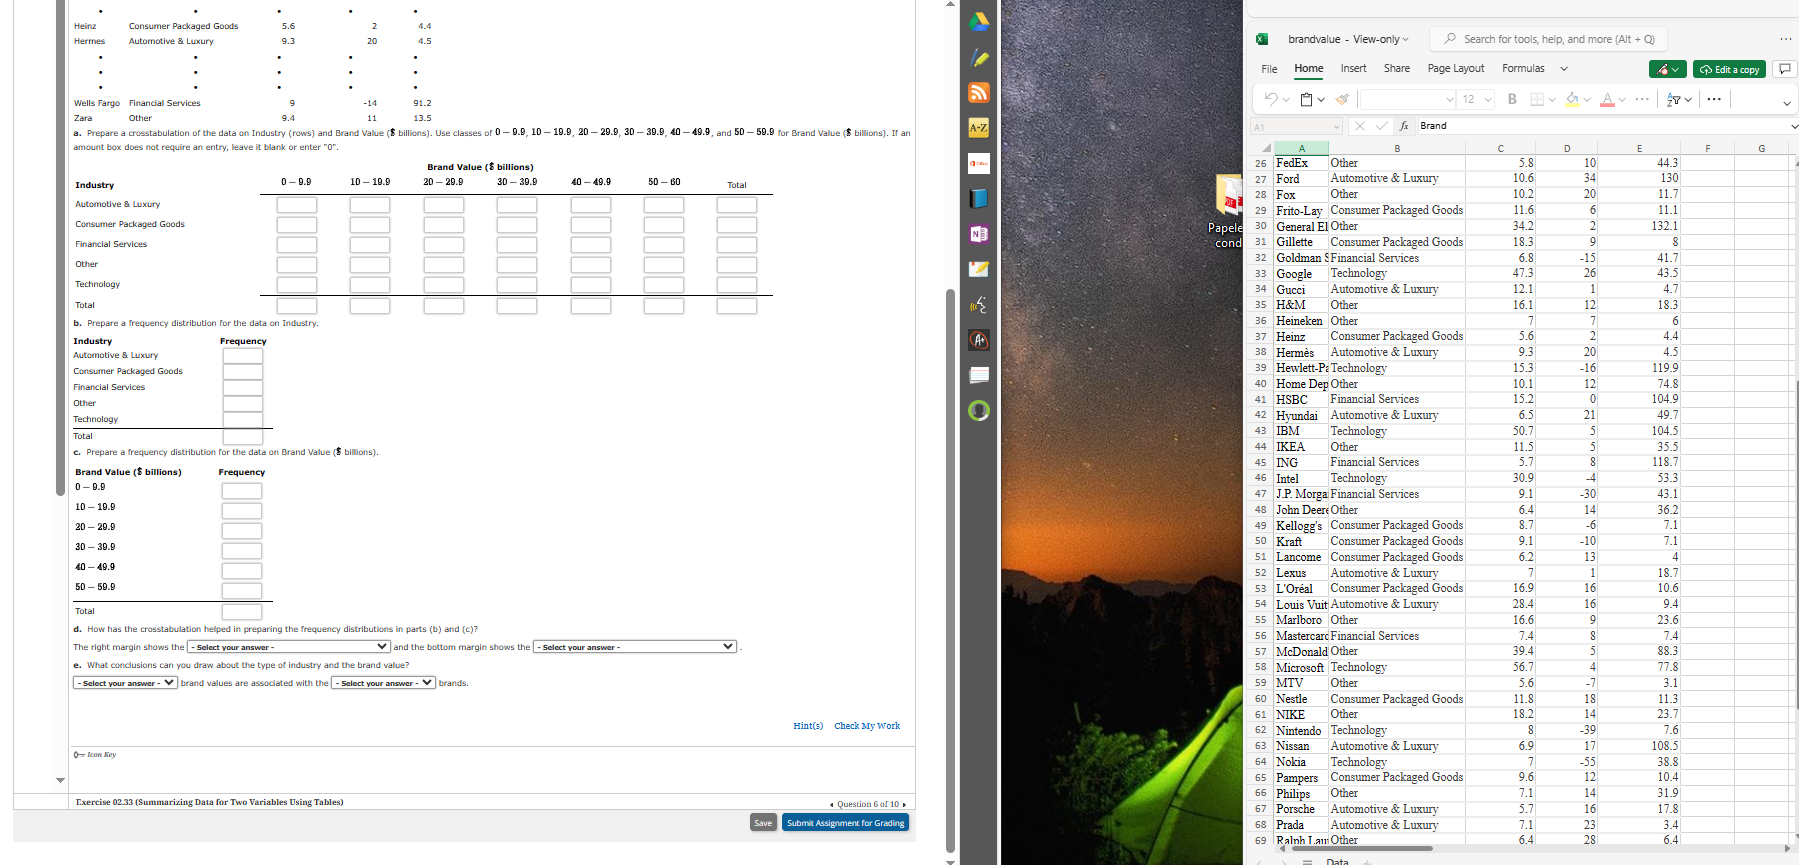
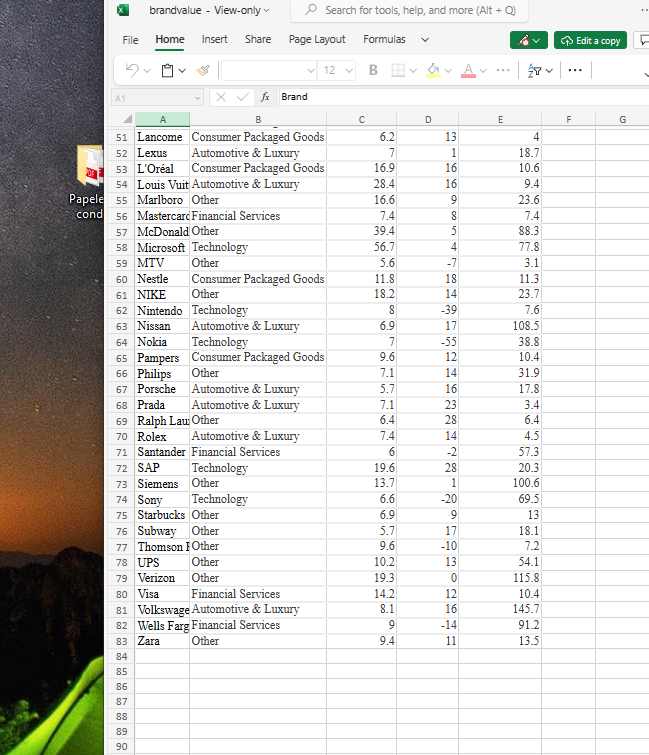
7 8. 9. 10. O Each year Forbes ranks the world's most valuable brands. A portion of the data for 82 of the brands in the 2013 Forbes list is shown in the table below (Forbes website). The data set includes the following variables: Brand: Industry: The name of the brand. The type of industry associated with the brand, labeled Automotive & Luxury, Consumer Packaged Goods, Financial Services, Other, Technology. Brand Value ($ billions): A measure of the brand's value in billions information about the brand. dollars developed by Forbes based on a variety of financial 1-Yr Value Change (%): The percentage change in the value of the brand over the previous year. Brand Revenue ($ billions): The total revenue billions dollars for the brand. Click on the datafile logo to reference the data. DATA file Brand Industry Brand Value 1-Yr Value Brand Revenue ($ billions) Change (%) ($ billions) Accenture Other 9.7 10 30.4 Adidas Other 8.4 23 14.5 Allianz Financial Services 6.9 130.8 Amazon.c Technology 14.7 60.6 Heinz Consumer Packaged Goods Hermes Automotive & Luxury Wells Fargo Financial Services Zara Other 9.3 9.4 -14 11 91.2 13.5 a. Prepare a crosstabulation of the data on Industry (rows) and Brand Value ($ billions). Use classes of 0-9.9, 10-19.9, 20-29.9, 30-39.9, 40-49.9, and 50-59.9 for Brand Value ($ billions). If an amount box does not require an entry, leave it blank or enter "0". Industry Automotive & Luxury 0-9.9 10-19.9 Brand Value ($ billions) 20-29.9 30 39.9 40-49.9 50-60 Total Consumer Packaged Goods Financial Services Other Technology Total b. Prepare a frequency distribution for the data on Industry. Industry Automotive & Luxury Consumer Packaged Goods Financial Services Other Technology Total Frequency c. Prepare a frequency distribution for the data on Brand Value (billions). Brand Value ($ billions) 0-9.9 Frequency 10-19.9 20-29.9 30-39.9 want to use it later. brandvalue -View-only~ File Home Insert Share Edit a copy 12 B A1 fx Brand A B C D 1 Papele Brand Industry ($ billions) Change (%) Brand Value 1-Yr Value Brand Revenue ($ billions) cond 2 Accenture Other 9.7 10 30.4 3 Adidas Other 8.4 23 14.5 4 Allianz Financial Services 6.9 5 130.8 5 Amazon.C Technology 14.7 44 60.6 6 American Financial Services 18 5 33.8 7 Audi Automotive & Luxury 10.9 1 55.2 8 AXA Financial Services 5.6 10 149.3 9 Bank of A Financial Services 7.7 -9 83.3 10 Boeing Other 6.4 12 81.7 11 Burberry Automotive & Luxury 5.5 13 3 12 Canon Technology 8.7 -11 41.8 13 Caterpillar Other 8.5 21 65.9 14 Chanel Automotive & Luxury 7 13 4.4 15 Chase Financial Services 6.3 -9 56.8 16 Coach Automotive & Luxury 10.5 1 5.1 17 Colgate Consumer Packaged Goods 7.9 7 3.9 18 Credit Suis Financial Services 5.7 -9 42 19 Danone Consumer Packaged Goods 11.1 13 13.3 20 Dell Technology 6.4 -23 56.9 21 Ebay Technology 8.5 14 6.3 22 Ericsson Technology 5.9 -35 34.6 23 ESPN Other 12.9 12 10.4 24 Estee Laud Consumer Packaged Goods 5.4 15 4.4 25 Facebook Technology 13.7 4 5.1 26 FedEx Other 5.8 10 44.3 27 Ford Automotive & Luxury 10.6 34 130 28 Fox Other 10.2 20 29 Frito-Lay Consumer Packaged Goods 30 General El Other 11.6 34.2 262 11.7 11.1 132.1 = Data Workbook Statistics End Mode Give Feedback to Microsoft 100% + 1 Heinz Consumer Packaged Goods Hermes Automotive & Luxury Wells Fargo Financial Services Zara Other -14 11 13.5 a. Prepare a crosstabulation of the data on Industry (rows) and Brand Value ($ billions). Use classes or 0-9.9, 10-19.9, 20-29.9, 30-39.9, 40-49.9, and 50-59.9 for Brand Value ($ billions). If an amount box does not require an entry, leave it blank or enter "0". 10-19.9 Brand Value ($ billions) 20-29.9 30-39.9 40-49.9 50-60 Total Industry Automotive & Luxury Consumer Packaged Goods Financial Services Other Technology Total 0-9.9 b. Prepare a frequency distribution for the data on Industry. Industry Automotive & Luxury Consumer Packaged Goods Financial Services Other Technology Total Frequency c. Prepare a frequency distribution for the data on Brand Value billions). Brand Value ($ billions) 0-9.9 Frequency 10-19.9 20-29.9 30-39.9 40-49.9 50-59.9 Total d. How has the crosstabulation helped in preparing the frequency distributions in parts (b) and (c)? The right margin shows the -Select your answer- and the bottom margin shows the -Select your answer- e. What conclusions can you draw about the type of industry and the brand value? - Select your answer-brand values are associated with the -Select your answer -brands. Icon Key Exercise 02.33 (Summarizing Data for Two Variables Using Tables) Save X brandvalue-View-only Search for tools, help, and more (Alt + Q) File Home Insert Share Page Layout Formulas Edit a copy 12 B > v ... A1 fx Brand A B C D E F G 26 FedEx 27 Ford 28 Fox Other Automotive & Luxury Other 5.8 10 44.3 10.6 34 130 10.2 20 11.7 29 Frito-Lay Consumer Packaged Goods 11.6 6 11.1 Papele 30 cond 30 General El Other 17 34.2 2 132.1 31 Gillette Consumer Packaged Goods 18.3 8 22 32 Goldman Financial Services 6.8 -15 15 41.7 22 33 Google Technology 47 3 41.5 26 43.5 34 Gucci Automotive & Luxury 12.1 12.1 1 4.7 25 35 H&M Other Other 16.1 12 12 18.3 36 Heineken Other 7 7 6 A+ 37 Heinz 37 Heinz Consumer Packaged Goods 5.6 38 Herms Automotive & Luxury 93 20 4.4 45 9.5 20 4.J 40 40 Home Dep Other 39 Hewlett-Pa Technology 15.3 . -16 -10 119.9 10.1 12 12 74.8 41 HSBC 41 HSBC Financial Services 15.2 104.9 42 Hyundai Automotive & Luxury 6.5 21 43 IBM Technology 104.5 104.5 44 IKEA Other 11.5 35.5 45 ING Financial Services 118.7 46 Intel Technology 30.9 53.3 47 J.P. Morga Financial Services 9.1 -30 43.1 9.1 48 John Deere Other 6.4 14 36.2 14 49 Kellogg's Consumer Packaged Goods 8.7 -6 7.1 Lexus Kraft Consumer Packaged Goods Lancome Consumer Packaged Goods Automotive & Luxury 9.1 -10 7.1 6.2 13 4 18.7 L'Oral Consumer Packaged Goods 16.9 16 10.6 54 Louis Vuit Automotive & Luxury 28.4 16 9.4 55 Marlboro Other 16.6 23.6 56 Mastercard Financial Services 7.4 7.4 57 McDonald Other 39.4 88.3 58 Microsoft Technology 56.7 77.8 59 MTV Other 7 5.6 -7 3.1 60 Nestle Consumer Packaged Goods 11.8 18 11.3 61 NIKE Other Other 182 18.2 14 23.7 Hint(s) Check My Work 62 Nintendo Technology 30 26 8 -39 62 Nissan 63 Nissan Automotive & Luxury 17 6.9 17 108.5 64 Nokia 64 Nokia Technology 7 7 - 38.8 65 Pampers Consumer Packaged Goods 9.6 12 12 10.4 104 66 Philips Other 7.1 14 31.9 Question 6 of 10. Submit Assignment for Grading 67 Porsche Automotive & Luxury 5.7 16 17.8 68 Prada Automotive & Luxury 7.1 23 3.4 69 Ralph Lam Other 6.4 28 6.4 =Data brandvalue-View-only Search for tools, help, and more (Alt+Q) File Home Insert Share Page Layout Formulas 12 B A1 fx Brand B Edit a copy D E F G 52 Lexus 51 Lancome Consumer Packaged Goods Automotive & Luxury 53 L'Oral Consumer Packaged Goods 54 Louis Vuit Automotive & Luxury 6.2 13 16.9 28.4 Papele 55 Marlboro Other 16.6 39660 4 1 18.7 16 10.6 16 9.4 23.6 cond 56 Mastercard Financial Services 7.4 8 7.4 57 McDonald Other 39.4 5 88.3 58 Microsoft Technology 56.7 4 77.8 59 MTV Other 5.6 -7 3.1 60 Nestle Consumer Packaged Goods 11.8 18 11.3 61 NIKE Other 18.2 14 23.7 62 Nintendo Technology 8 -39 7.6 63 Nissan Automotive & Luxury 6.9 17 108.5 64 Nokia Technology 7 -55 38.8 65 Pampers Consumer Packaged Goods 9.6 12 10.4 66 Philips Other 7.1 14 31.9 67 Porsche Automotive & Luxury 5.7 16 17.8 68 Prada Automotive & Luxury 7.1 23 3.4 69 Ralph Lau Other 6.4 28 6.4 70 Rolex Automotive & Luxury 7.4 - 14 4.5 71 Santander Financial Services 6 -2 57.3 72 SAP Technology 19.6 73 Siemens Other 13.7 74 Sony Technology 75 Starbucks Other 76 Subway Other 6.6 6.9 6969 28 20.3 1 100.6 -20 69.5 9 13 5.7 17 18.1 77 Thomson Other 78 UPS Other 79 Verizon Other 9.6 10.2 19.3 80 Visa Financial Services 81 Volkswage Automotive & Luxury 82 Wells Farg Financial Services 14.2 8.1 :623219 -10 7.2 13 54.1 0 115.8 12 10.4 16 145.7 -14 91.2 Other 9.4 11 13.5 83 Zara 84 85 86 87 88 89 90 7 8. 9. 10. O Each year Forbes ranks the world's most valuable brands. A portion of the data for 82 of the brands in the 2013 Forbes list is shown in the table below (Forbes website). The data set includes the following variables: Brand: Industry: The name of the brand. The type of industry associated with the brand, labeled Automotive & Luxury, Consumer Packaged Goods, Financial Services, Other, Technology. Brand Value ($ billions): A measure of the brand's value in billions information about the brand. dollars developed by Forbes based on a variety of financial 1-Yr Value Change (%): The percentage change in the value of the brand over the previous year. Brand Revenue ($ billions): The total revenue billions dollars for the brand. Click on the datafile logo to reference the data. DATA file Brand Industry Brand Value 1-Yr Value Brand Revenue ($ billions) Change (%) ($ billions) Accenture Other 9.7 10 30.4 Adidas Other 8.4 23 14.5 Allianz Financial Services 6.9 130.8 Amazon.c Technology 14.7 60.6 Heinz Consumer Packaged Goods Hermes Automotive & Luxury Wells Fargo Financial Services Zara Other 9.3 9.4 -14 11 91.2 13.5 a. Prepare a crosstabulation of the data on Industry (rows) and Brand Value ($ billions). Use classes of 0-9.9, 10-19.9, 20-29.9, 30-39.9, 40-49.9, and 50-59.9 for Brand Value ($ billions). If an amount box does not require an entry, leave it blank or enter "0". Industry Automotive & Luxury 0-9.9 10-19.9 Brand Value ($ billions) 20-29.9 30 39.9 40-49.9 50-60 Total Consumer Packaged Goods Financial Services Other Technology Total b. Prepare a frequency distribution for the data on Industry. Industry Automotive & Luxury Consumer Packaged Goods Financial Services Other Technology Total Frequency c. Prepare a frequency distribution for the data on Brand Value (billions). Brand Value ($ billions) 0-9.9 Frequency 10-19.9 20-29.9 30-39.9 want to use it later. brandvalue -View-only~ File Home Insert Share Edit a copy 12 B A1 fx Brand A B C D 1 Papele Brand Industry ($ billions) Change (%) Brand Value 1-Yr Value Brand Revenue ($ billions) cond 2 Accenture Other 9.7 10 30.4 3 Adidas Other 8.4 23 14.5 4 Allianz Financial Services 6.9 5 130.8 5 Amazon.C Technology 14.7 44 60.6 6 American Financial Services 18 5 33.8 7 Audi Automotive & Luxury 10.9 1 55.2 8 AXA Financial Services 5.6 10 149.3 9 Bank of A Financial Services 7.7 -9 83.3 10 Boeing Other 6.4 12 81.7 11 Burberry Automotive & Luxury 5.5 13 3 12 Canon Technology 8.7 -11 41.8 13 Caterpillar Other 8.5 21 65.9 14 Chanel Automotive & Luxury 7 13 4.4 15 Chase Financial Services 6.3 -9 56.8 16 Coach Automotive & Luxury 10.5 1 5.1 17 Colgate Consumer Packaged Goods 7.9 7 3.9 18 Credit Suis Financial Services 5.7 -9 42 19 Danone Consumer Packaged Goods 11.1 13 13.3 20 Dell Technology 6.4 -23 56.9 21 Ebay Technology 8.5 14 6.3 22 Ericsson Technology 5.9 -35 34.6 23 ESPN Other 12.9 12 10.4 24 Estee Laud Consumer Packaged Goods 5.4 15 4.4 25 Facebook Technology 13.7 4 5.1 26 FedEx Other 5.8 10 44.3 27 Ford Automotive & Luxury 10.6 34 130 28 Fox Other 10.2 20 29 Frito-Lay Consumer Packaged Goods 30 General El Other 11.6 34.2 262 11.7 11.1 132.1 = Data Workbook Statistics End Mode Give Feedback to Microsoft 100% + 1 Heinz Consumer Packaged Goods Hermes Automotive & Luxury Wells Fargo Financial Services Zara Other -14 11 13.5 a. Prepare a crosstabulation of the data on Industry (rows) and Brand Value ($ billions). Use classes or 0-9.9, 10-19.9, 20-29.9, 30-39.9, 40-49.9, and 50-59.9 for Brand Value ($ billions). If an amount box does not require an entry, leave it blank or enter "0". 10-19.9 Brand Value ($ billions) 20-29.9 30-39.9 40-49.9 50-60 Total Industry Automotive & Luxury Consumer Packaged Goods Financial Services Other Technology Total 0-9.9 b. Prepare a frequency distribution for the data on Industry. Industry Automotive & Luxury Consumer Packaged Goods Financial Services Other Technology Total Frequency c. Prepare a frequency distribution for the data on Brand Value billions). Brand Value ($ billions) 0-9.9 Frequency 10-19.9 20-29.9 30-39.9 40-49.9 50-59.9 Total d. How has the crosstabulation helped in preparing the frequency distributions in parts (b) and (c)? The right margin shows the -Select your answer- and the bottom margin shows the -Select your answer- e. What conclusions can you draw about the type of industry and the brand value? - Select your answer-brand values are associated with the -Select your answer -brands. Icon Key Exercise 02.33 (Summarizing Data for Two Variables Using Tables) Save X brandvalue-View-only Search for tools, help, and more (Alt + Q) File Home Insert Share Page Layout Formulas Edit a copy 12 B > v ... A1 fx Brand A B C D E F G 26 FedEx 27 Ford 28 Fox Other Automotive & Luxury Other 5.8 10 44.3 10.6 34 130 10.2 20 11.7 29 Frito-Lay Consumer Packaged Goods 11.6 6 11.1 Papele 30 cond 30 General El Other 17 34.2 2 132.1 31 Gillette Consumer Packaged Goods 18.3 8 22 32 Goldman Financial Services 6.8 -15 15 41.7 22 33 Google Technology 47 3 41.5 26 43.5 34 Gucci Automotive & Luxury 12.1 12.1 1 4.7 25 35 H&M Other Other 16.1 12 12 18.3 36 Heineken Other 7 7 6 A+ 37 Heinz 37 Heinz Consumer Packaged Goods 5.6 38 Herms Automotive & Luxury 93 20 4.4 45 9.5 20 4.J 40 40 Home Dep Other 39 Hewlett-Pa Technology 15.3 . -16 -10 119.9 10.1 12 12 74.8 41 HSBC 41 HSBC Financial Services 15.2 104.9 42 Hyundai Automotive & Luxury 6.5 21 43 IBM Technology 104.5 104.5 44 IKEA Other 11.5 35.5 45 ING Financial Services 118.7 46 Intel Technology 30.9 53.3 47 J.P. Morga Financial Services 9.1 -30 43.1 9.1 48 John Deere Other 6.4 14 36.2 14 49 Kellogg's Consumer Packaged Goods 8.7 -6 7.1 Lexus Kraft Consumer Packaged Goods Lancome Consumer Packaged Goods Automotive & Luxury 9.1 -10 7.1 6.2 13 4 18.7 L'Oral Consumer Packaged Goods 16.9 16 10.6 54 Louis Vuit Automotive & Luxury 28.4 16 9.4 55 Marlboro Other 16.6 23.6 56 Mastercard Financial Services 7.4 7.4 57 McDonald Other 39.4 88.3 58 Microsoft Technology 56.7 77.8 59 MTV Other 7 5.6 -7 3.1 60 Nestle Consumer Packaged Goods 11.8 18 11.3 61 NIKE Other Other 182 18.2 14 23.7 Hint(s) Check My Work 62 Nintendo Technology 30 26 8 -39 62 Nissan 63 Nissan Automotive & Luxury 17 6.9 17 108.5 64 Nokia 64 Nokia Technology 7 7 - 38.8 65 Pampers Consumer Packaged Goods 9.6 12 12 10.4 104 66 Philips Other 7.1 14 31.9 Question 6 of 10. Submit Assignment for Grading 67 Porsche Automotive & Luxury 5.7 16 17.8 68 Prada Automotive & Luxury 7.1 23 3.4 69 Ralph Lam Other 6.4 28 6.4 =Data brandvalue-View-only Search for tools, help, and more (Alt+Q) File Home Insert Share Page Layout Formulas 12 B A1 fx Brand B Edit a copy D E F G 52 Lexus 51 Lancome Consumer Packaged Goods Automotive & Luxury 53 L'Oral Consumer Packaged Goods 54 Louis Vuit Automotive & Luxury 6.2 13 16.9 28.4 Papele 55 Marlboro Other 16.6 39660 4 1 18.7 16 10.6 16 9.4 23.6 cond 56 Mastercard Financial Services 7.4 8 7.4 57 McDonald Other 39.4 5 88.3 58 Microsoft Technology 56.7 4 77.8 59 MTV Other 5.6 -7 3.1 60 Nestle Consumer Packaged Goods 11.8 18 11.3 61 NIKE Other 18.2 14 23.7 62 Nintendo Technology 8 -39 7.6 63 Nissan Automotive & Luxury 6.9 17 108.5 64 Nokia Technology 7 -55 38.8 65 Pampers Consumer Packaged Goods 9.6 12 10.4 66 Philips Other 7.1 14 31.9 67 Porsche Automotive & Luxury 5.7 16 17.8 68 Prada Automotive & Luxury 7.1 23 3.4 69 Ralph Lau Other 6.4 28 6.4 70 Rolex Automotive & Luxury 7.4 - 14 4.5 71 Santander Financial Services 6 -2 57.3 72 SAP Technology 19.6 73 Siemens Other 13.7 74 Sony Technology 75 Starbucks Other 76 Subway Other 6.6 6.9 6969 28 20.3 1 100.6 -20 69.5 9 13 5.7 17 18.1 77 Thomson Other 78 UPS Other 79 Verizon Other 9.6 10.2 19.3 80 Visa Financial Services 81 Volkswage Automotive & Luxury 82 Wells Farg Financial Services 14.2 8.1 :623219 -10 7.2 13 54.1 0 115.8 12 10.4 16 145.7 -14 91.2 Other 9.4 11 13.5 83 Zara 84 85 86 87 88 89 90
Expert Answer:

Posted Date:
Students also viewed these mathematics questions
-
Let be twice-differentiable and one-to-one on an open interval I. Show that its inverse function g satisfies When is increasing and concave downward, what is the concavity of -1 = g? g"(x) =...
-
Blanchard Companys sales manager (in Exercise 21-10) predicts that annual sales of the companys product will soon reach 40,000 units and its price will increase to $ 200 per unit. According to the...
-
When quantity discounts are offered, what factors other than price should be considered?
-
You are given the following information: {Required:} (1) How many units of Product USA would have to be sold to break even? (2) What would the operating income be if sales increase by \(25 \%\) ? (3)...
-
On the next page are balance sheet and income statement data for Howard Bannister Company. Note: For the balance sheet data, the end-of-year information is in the left column. Additional information...
-
Question one [Marks 8] Define the following concepts as applied in agricultural trade: Offer curve [2] Marginal rate of transformation [2] Opportunity cost of corn in terms of textiles [2] Production...
-
1. Write a query to return name and price of each product in the inventory database. 2. Write a query to return name and price for products of type accessory in the inventory database. 3. Write a...
-
The company is best buy. please find the numbers in the SEC List the stock market prices shown in the annual report. This information should cover at least each quarter for the past 2 years (...
-
When delivering a professional development, feedback from your audience is important for continuous improvement. Other than a satisfaction survey, provide 2-3 other methods that can be used to...
-
The production manager of Rordan Corporation has submitted the following quarterly production forecast for the upcoming fiscal year: 1 st Quarter 2 nd Quarter 3 rd Quarter 4 th Quarter Units to be...
-
Find x-intercept of the equation. y= 5x-0 Type only the x-intercept rounding to the hundredths place if applicable. For example if x-intercept is (4, 0), you will type only 4. For help click here 6
-
Q11. Explain the concept of sustainable supply chain (sustainable procurement) as a best practice model that can be used by organisations as part of their commitment to sustainability. Q12. Explain...
-
please help explain and answer study question number 2 & 3 page discussion questions 1. refer to the fundamental principles governing an audit (see chapter 2@ ). under the responsibili
-
Burberrys competitive advantage is through its differentiation strategy. What risk should Burberry remain aware of?

Study smarter with the SolutionInn App