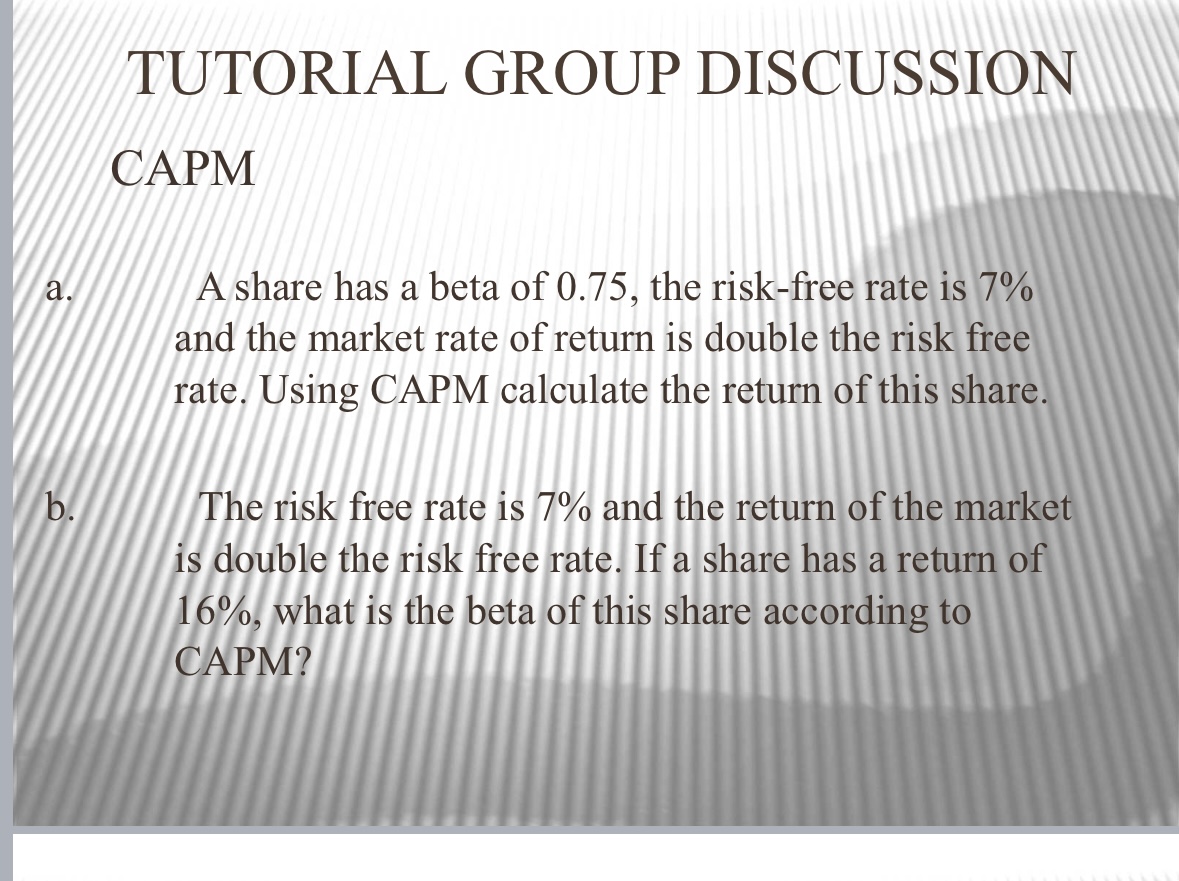
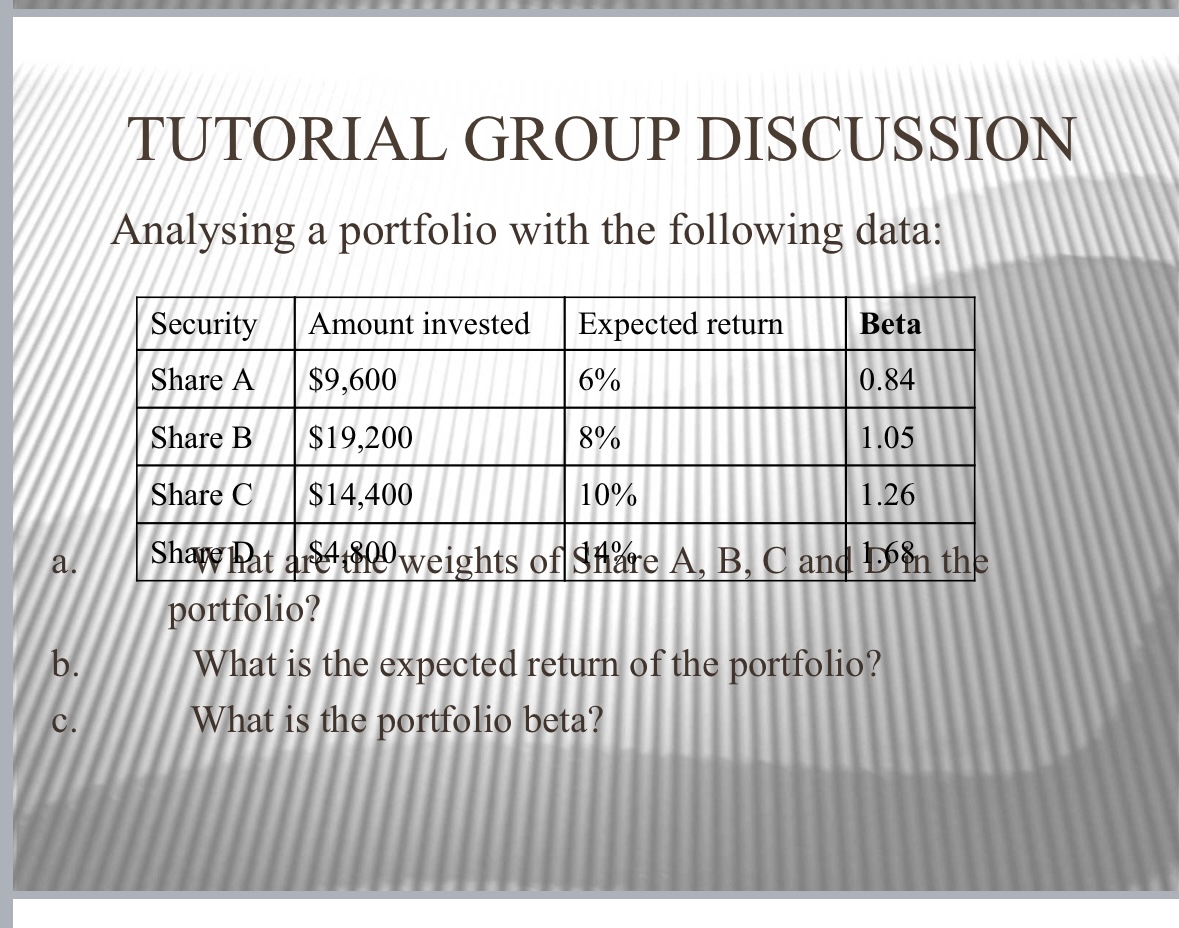
a. b. TUTORIAL GROUP DISCUSSION CAPM A share has a beta of 0.75, the risk-free rate...
Fantastic news! We've Found the answer you've been seeking!
Question:
Transcribed Image Text:
a. b. TUTORIAL GROUP DISCUSSION CAPM A share has a beta of 0.75, the risk-free rate is 7% and the market rate of return is double the risk free rate. Using CAPM calculate the return of this share. The risk free rate is 7% and the return of the market is double the risk free rate. If a share has a return of 16%, what is the beta of this share according to CAPM? a. b. TUTORIAL GROUP DISCUSSION Consider the following information: Security Beta Share A 1.5 Share B 1.2 Return 20% 18% Are these two assets valued correctly relative to each other if the risk-free rate is 5%? What would the risk free rate have to be if they were correctly priced? a. b. C. TUTORIAL GROUP DISCUSSION Suppose Alan has a portfolio consisting of: Security Amount invested Return Standard Deviation Share A 8.8% $6,500 12% Share B $3,500 4.5% 8% If the covariance between Share A and Share B is 0.0048 Calculate the weights of Share A and Share B in his portfolio. Calculate the return of his portfolio. Calculate the variance and standard deviation of his portfolio. 08:39 Chrome = Fin700 Topic 7 Diversificat... TUTORIAL GROUP DISCUSSION Based on the following information, calculate the expected return and standard deviation for Share A. Recession Normal Growth Boom E(R) = 1 R 1 State of Economy Probability of Share A return if State occurs State occurring 0.15 -4% 0.40 10% 0.25 16% 0.20 24% Variance = p. (R, R) Pi t=1 Standard Deviation = Variance t=l TUTORIAL Based on the following information, calculate the expected return and standard deviation of Share A and Share B. State of economy Boom Bust E(R) = P R 4G 92 Probability Share A of State Return 0.40 30% 0.60 -10% T Variance = P, (R, R) t=1 Standard Deviation = Variance RISK Done Share B Return -5% 25% a. b. C. TUTORIAL GROUP DISCUSSION Analysing a portfolio with the following data: Security Amount invested Expected return Beta Share A $9,600 6% 0.84 Share B $19,200 8% 1.05 Share C $14,400 10% 1.26 Shape Pat arweights of Share A, B, C and on the portfolio? What is the expected return of the portfolio? What is the portfolio beta? a. b. TUTORIAL GROUP DISCUSSION CAPM A share has a beta of 0.75, the risk-free rate is 7% and the market rate of return is double the risk free rate. Using CAPM calculate the return of this share. The risk free rate is 7% and the return of the market is double the risk free rate. If a share has a return of 16%, what is the beta of this share according to CAPM? a. b. TUTORIAL GROUP DISCUSSION Consider the following information: Security Beta Share A 1.5 Share B 1.2 Return 20% 18% Are these two assets valued correctly relative to each other if the risk-free rate is 5%? What would the risk free rate have to be if they were correctly priced? a. b. C. TUTORIAL GROUP DISCUSSION Suppose Alan has a portfolio consisting of: Security Amount invested Return Standard Deviation Share A 8.8% $6,500 12% Share B $3,500 4.5% 8% If the covariance between Share A and Share B is 0.0048 Calculate the weights of Share A and Share B in his portfolio. Calculate the return of his portfolio. Calculate the variance and standard deviation of his portfolio. 08:39 Chrome = Fin700 Topic 7 Diversificat... TUTORIAL GROUP DISCUSSION Based on the following information, calculate the expected return and standard deviation for Share A. Recession Normal Growth Boom E(R) = 1 R 1 State of Economy Probability of Share A return if State occurs State occurring 0.15 -4% 0.40 10% 0.25 16% 0.20 24% Variance = p. (R, R) Pi t=1 Standard Deviation = Variance t=l TUTORIAL Based on the following information, calculate the expected return and standard deviation of Share A and Share B. State of economy Boom Bust E(R) = P R 4G 92 Probability Share A of State Return 0.40 30% 0.60 -10% T Variance = P, (R, R) t=1 Standard Deviation = Variance RISK Done Share B Return -5% 25% a. b. C. TUTORIAL GROUP DISCUSSION Analysing a portfolio with the following data: Security Amount invested Expected return Beta Share A $9,600 6% 0.84 Share B $19,200 8% 1.05 Share C $14,400 10% 1.26 Shape Pat arweights of Share A, B, C and on the portfolio? What is the expected return of the portfolio? What is the portfolio beta?
Expert Answer:
Answer rating: 100% (QA)
Here are the stepbystep solutions to the CAPM problems 1 a A share has a beta of 075 the riskfree rate is 7 and the market rate of return is double the risk free rate Using CAPM calculate the return o... View the full answer
Related Book For
Intermediate Financial Management
ISBN: 9780357516669
14th Edition
Authors: Eugene F Brigham, Phillip R Daves
Posted Date:
Students also viewed these finance questions
-
Using CAPM: A stock has a of 1.2. The equity risk premium is 6 percent and the risk free rate is 2 percent. What is the rate of return required by investors in the stock? Question 2 4.1.b - using...
-
1 High P/E ratios tend to indicate that a company is expected to _______, ceteris paribus A grow quickly B grow at the same speed as the average company C grow slowly D not grow E None of the options...
-
Three years ago, Witt Gas Controls purchased equipment for $80,000 that was expected to have a useful life of 5 years with a $9000 salvage value . Increased demand necessitated an upgrade costing...
-
The inventory of 3T Company on December 31, 2014, consists of the following items. Instructions (a) Determine the inventory as of December 31, 2014, by the lower-of-cost-or-market method, applying...
-
A single-tank process has been operating for a long period of time with the inlet how rate q1 equal to 30.4 ft3/min. After the operator increases the flow rate suddenly by 10%, the liquid level in...
-
Wire \(1,3.0 \mathrm{~m}\) long and of linear mass density \(0.010 \mathrm{~kg} / \mathrm{m}\), is initially held in place and carries \(10 \mathrm{~A}\) of current to the right. Very long wire 2 is...
-
An important application of regression analysis in accounting is in the estimation of cost. By collecting data on volume and cost and using the least squares method to develop an estimated regression...
-
The _________ provides a portion of the system call interface for UNIX and Linux.
-
Prepare the journal entries of the following transactions. 1. On January 1, 20XX, BVD Corp. issued 3,500 shares of $50 par, 7% preferred stock for $275,000. 2. On January 1, 20XX, BVD Corp. also...
-
In February, a new company incurred the following total costs for the production of 10,000 units during its first month of operations: Variable Fixed $500,000 $350,000 Manufacturing Overhead $250,000...
-
An Unsorted List ADT is to be extended by the addition of function Tail, which has the following precondition and postcondition: Precondition: list has been initialized and is not empty....
-
Write context switch code for your favorite CPU.
-
Write a class based on class UnsortedType as a bounded linked implementation. Provide a parameterized constructor that takes the maximum number of items as a parameter. If function PutItem is called...
-
A thin, long, straight wire is surrounded by plastic insulation of radius \(R\) and dielectric constant \(\kappa\) (Figure 26.32). The wire carries a uniform distribution of charge with a positive...
-
Use the method described by Welham and Thompson (1997) to compute the REML likelihood-ratio statistic for comparing the two linear models \[ \mathcal{X}_{0}=\text { species }+ \text { bark }+ \text {...
-
Blood in an isolated organ perfusion system flows out of the bottom of a vertical holding tank with cross-sectional area A. The flow rate is proportional to the height of fluid in the tank, with a...
-
On October 1, 2014, the Dow Jones Industrial Average (DJIA) opened at 17,042 points. During that day it lost 237 points. On October 2 it lost 4 points. On October 3 it gained 209 points. Deter-mine...
-
The APV model uses the unlevered cost of equity, r sU , to discount cash flows while the corporate valuation model uses the WACC. Explain why the two models use different discount rates.
-
Define and discuss how to calculate a bonds coupon rate, current yield, expected capital gains yield for the current year, yield to maturity (YTM), and yield to call (YTC). What might be some...
-
The Bookbinder Company had $500,000 cumulative operating losses prior to the beginning of last year. It had $100,000 in pre-tax earnings last year before using the past operating losses and has...
-
The file ApplianceShipments.csv contains the series of quarterly shipments (in million dollars) of US household appliances between 1985 and 1989 (data courtesy of Ken Black). a. Create a...
-
Canadian Manufacturing Workers Workhours. The time plot in Figure 17.9 describes the average annual number of weekly hours spent by Canadian manufacturing workers (data are available in...
-
Shampoo Sales. The file ShampooSales.csv contains data on the monthly sales of a certain shampoo over a three-year period. [Source: Hyndman and Yang (2018). a. Create a well-formatted time plot of...
Study smarter with the SolutionInn App