a. By what percentage did Mydecos revenues grow each year from 2016 to 2019? b. By what
Fantastic news! We've Found the answer you've been seeking!
Question:
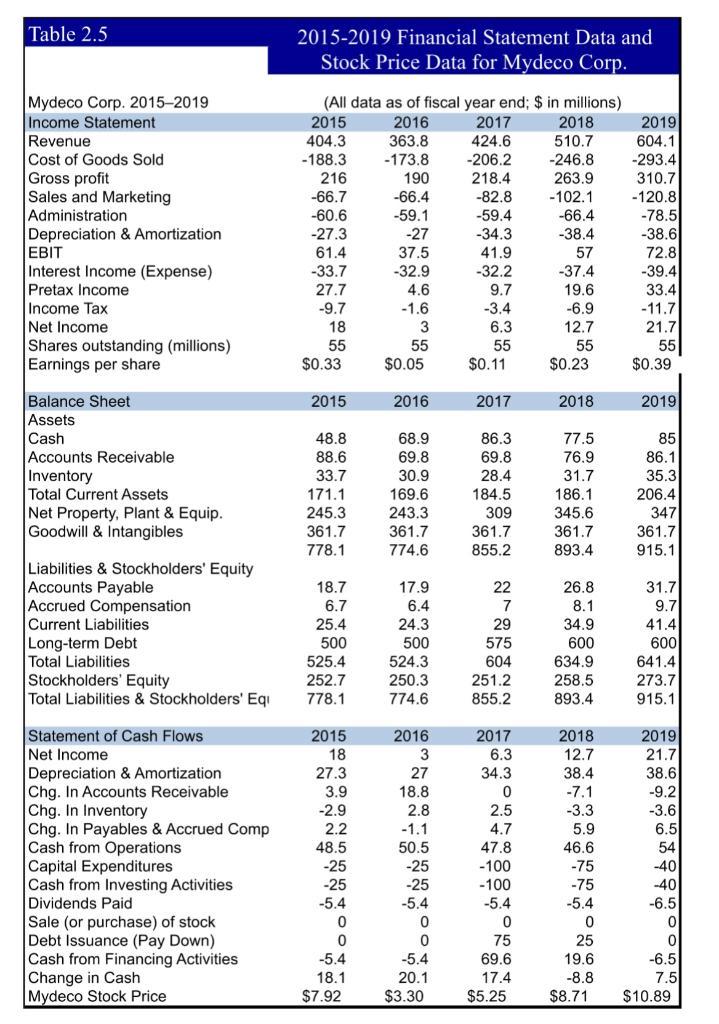
a. By what percentage did Mydeco’s revenues grow each year from 2016 to 2019?
b. By what percentage did net income grow each year?
c. Why might the growth rates of revenues and net income differ?
Transcribed Image Text:
Table 2.5 Mydeco Corp. 2015-2019 Income Statement Revenue Cost of Goods Sold Gross profit Sales and Marketing Administration Depreciation & Amortization EBIT Interest Income (Expense) Pretax Income Income Tax Net Income Shares outstanding (millions) Earnings per share Balance Sheet Assets Cash Accounts Receivable Inventory Total Current Assets Net Property, Plant & Equip. Goodwill & Intangibles Liabilities & Stockholders' Equity Accounts Payable Accrued Compensation Current Liabilities Long-term Debt Total Liabilities Stockholders' Equity Total Liabilities & Stockholders' Equ Statement of Cash Flows Net Income Depreciation & Amortization Chg. In Accounts Receivable Chg. In Inventory Chg. In Payables & Accrued Comp Cash from Operations Capital Expenditures Cash from Investing Activities Dividends Paid Sale (or purchase) of stock Debt Issuance (Pay Down) Cash from Financing Activities Change in Cash Mydeco Stock Price 2015-2019 Financial Statement Data and Stock Price Data for Mydeco Corp. (All data as of fiscal year end; $ in millions) 2015 2016 404.3 363.8 -188.3 -173.8 190 -66.4 -59.1 216 -66.7 -60.6 -27.3 61.4 -33.7 27.7 -9.7 18 55 $0.33 2015 48.8 88.6 33.7 171.1 245.3 361.7 778.1 18.7 6.7 25.4 500 525.4 252.7 778.1 2015 18 27.3 3.9 -2.9 2.2 48.5 -25 -25 -5.4 0 0 -5.4 18.1 $7.92 -27 37.5 -32.9 4.6 -1.6 3 55 $0.05 2016 68.9 69.8 30.9 169.6 243.3 361.7 774.6 17.9 6.4 24.3 500 524.3 250.3 774.6 2016 3 27 18.8 2.8 -1.1 50.5 -25 -25 -5.4 0 0 -5.4 20.1 $3.30 2017 424.6 -206.2 218.4 -82.8 -59.4 -34.3 41.9 -32.2 9.7 -3.4 6.3 55 $0.11 2017 86.3 69.8 28.4 184.5 309 361.7 855.2 22 7 29 575 604 251.2 855.2 2017 6.3 34.3 0 2.5 4.7 47.8 -100 -100 -5.4 0 75 69.6 17.4 $5.25 2018 510.7 -246.8 263.9 -102.1 -66.4 -38.4 57 -37.4 19.6 -6.9 12.7 55 $0.23 2018 77.5 76.9 31.7 186.1 345.6 361.7 893.4 26.8 8.1 34.9 600 634.9 258.5 893.4 2018 12.7 38.4 -7.1 -3.3 5.9 46.6 -75 -75 -5.4 0 25 19.6 -8.8 $8.71 2019 604.1 -293.4 310.7 -120.8 -78.5 -38.6 72.8 -39.4 33.4 -11.7 21.7 55 $0.39 2019 85 86.1 35.3 206.4 347 361.7 915.1 31.7 9.7 41.4 600 641.4 273.7 915.1 2019 21.7 38.6 -9.2 -3.6 6.5 54 -40 -40 -6.5 0 0 -6.5 7.5 $10.89 Table 2.5 Mydeco Corp. 2015-2019 Income Statement Revenue Cost of Goods Sold Gross profit Sales and Marketing Administration Depreciation & Amortization EBIT Interest Income (Expense) Pretax Income Income Tax Net Income Shares outstanding (millions) Earnings per share Balance Sheet Assets Cash Accounts Receivable Inventory Total Current Assets Net Property, Plant & Equip. Goodwill & Intangibles Liabilities & Stockholders' Equity Accounts Payable Accrued Compensation Current Liabilities Long-term Debt Total Liabilities Stockholders' Equity Total Liabilities & Stockholders' Equ Statement of Cash Flows Net Income Depreciation & Amortization Chg. In Accounts Receivable Chg. In Inventory Chg. In Payables & Accrued Comp Cash from Operations Capital Expenditures Cash from Investing Activities Dividends Paid Sale (or purchase) of stock Debt Issuance (Pay Down) Cash from Financing Activities Change in Cash Mydeco Stock Price 2015-2019 Financial Statement Data and Stock Price Data for Mydeco Corp. (All data as of fiscal year end; $ in millions) 2015 2016 404.3 363.8 -188.3 -173.8 190 -66.4 -59.1 216 -66.7 -60.6 -27.3 61.4 -33.7 27.7 -9.7 18 55 $0.33 2015 48.8 88.6 33.7 171.1 245.3 361.7 778.1 18.7 6.7 25.4 500 525.4 252.7 778.1 2015 18 27.3 3.9 -2.9 2.2 48.5 -25 -25 -5.4 0 0 -5.4 18.1 $7.92 -27 37.5 -32.9 4.6 -1.6 3 55 $0.05 2016 68.9 69.8 30.9 169.6 243.3 361.7 774.6 17.9 6.4 24.3 500 524.3 250.3 774.6 2016 3 27 18.8 2.8 -1.1 50.5 -25 -25 -5.4 0 0 -5.4 20.1 $3.30 2017 424.6 -206.2 218.4 -82.8 -59.4 -34.3 41.9 -32.2 9.7 -3.4 6.3 55 $0.11 2017 86.3 69.8 28.4 184.5 309 361.7 855.2 22 7 29 575 604 251.2 855.2 2017 6.3 34.3 0 2.5 4.7 47.8 -100 -100 -5.4 0 75 69.6 17.4 $5.25 2018 510.7 -246.8 263.9 -102.1 -66.4 -38.4 57 -37.4 19.6 -6.9 12.7 55 $0.23 2018 77.5 76.9 31.7 186.1 345.6 361.7 893.4 26.8 8.1 34.9 600 634.9 258.5 893.4 2018 12.7 38.4 -7.1 -3.3 5.9 46.6 -75 -75 -5.4 0 25 19.6 -8.8 $8.71 2019 604.1 -293.4 310.7 -120.8 -78.5 -38.6 72.8 -39.4 33.4 -11.7 21.7 55 $0.39 2019 85 86.1 35.3 206.4 347 361.7 915.1 31.7 9.7 41.4 600 641.4 273.7 915.1 2019 21.7 38.6 -9.2 -3.6 6.5 54 -40 -40 -6.5 0 0 -6.5 7.5 $10.89
Expert Answer:
Answer rating: 100% (QA)
c Difference in Growth Rates The growth rates of revenues and net income might differ due to various ... View the full answer
Related Book For
Fundamentals Of Corporate Finance
ISBN: 9780135811603
5th Edition
Authors: Jonathan Berk, Peter DeMarzo, Jarrad Harford
Posted Date:
Students also viewed these accounting questions
-
Problem 18: Salem sold $62,000 of goods on account, credit terms are 3/10, n/30. COGS is $31,000. Salem received payment from the customer within 10 days. Record the sale and the receipt of payment.
-
Develop two goals pertaining to your education, future career, or personal life. Each goal includes at least three objectives. Make sure your objectives include performance, conditions, and criteria....
-
On July 31, 2019, Bismarck Company engaged Duval Tooling Company to construct a special-purpose piece of factory machinery. Construction began immediately and was completed on November 1, 2019. To...
-
The internal path length of a full binary tree is the sum, taken over all internal nodes of the tree, of the depth of each node. Likewise, the external path length is the sum, taken over all leaves...
-
Which types of economic damages are related to digital crimes?
-
On July 1, 2011, a five-year agreement is signed between the City of Genoa and the Computer Leasing Corporation for the use of computer equipment not associated with proprietary funds activity. The...
-
(b) If the game below is repeated twice, the following strategies form an SPNE when = 1: Strategies Player 1 period 1: Play C period 2: Play B if (C,Y) in stage 1. Play A otherwise. Player 2 period...
-
1. Given the facts of the case, what communications do you believe Forrester & Loomis should have made with the audit committee with regard to the transactions with the vendor to comply with PCAOB AS...
-
1. Design your IPv4 subnet with beginning IP: 172.16.x.0/16 (Where x is your group #). Fill out the table below (40 points) Subnet# The number IP Range of hosts 12445 3 need 257 10 30 250 8 PC1 2....
-
________ costs increase as the number of facilities in a supply chain increases. Transportation Inventory Retail operation Information
-
With the help of examples, identify the five basic levers that can be used to deal with uncertainty in a supply chain. Describe the role of each lever in enabling a supply chain to achieve strategic...
-
Assume a new drug has been developed for the Ebola virus (EVD). Briefly describe the new drugs demand and supply characteristics at the beginning of its product life cycle.
-
What do you expect the level of implied demand uncertainty to be for jasmine rice produced by Thailand sold at a supermarket? Explain your answer with reference to Fishers model.
-
What are some problems that can arise if the same roles are assigned to different stages of a supply chain in order to achieve a strategic fit? Describe how roles should be assigned to help a...
-
Bennett Builders builds 1,500-square-foot starter tract homes Bennett Builders would like to earn a profit of 14% of the in the fast-growing suburbs of Boise Land and labor are the variable cost of...
-
Refer to Exercise 8.S.I. Construct a scatterplot of the data. Does the appearance of the scatterplot indicate that the pairing was effective? Explain. Exercise 8.S.I. A volunteer working at an animal...
-
You purchased CSH stock for $40 and it is now selling for $50. The company has announced that it plans a $10 special dividend. a. Assuming 2016 tax rates, if you sell the stock or wait and receive...
-
Suppose that in April 2019, Nike had EPS of $2.57 and a book value of equity of $6.23 per share. a. Using the average P/E multiple in Table 10.1, estimate Nikes share price. b. What range of share...
-
Suppose that on January 15, 2018, the U.S. Treasury issued a 10-year inflation-indexed note with a coupon of 6%. On the date of issue, the CPI was 200. If the CPI decreases to 150 by January 15,...
-
A 17 g audio compact disk has a diameter of 12 cm. The disk spins under a laser that reads encoded data. The first track to be read is 2.3 cm from the axis; as the disk plays, the laser scans tracks...
-
A spin bike is an indoor bike that is designed to duplicate the feeling of regular road cycling. A typical spin bike has a very heavy flywheel. A friction pad or other brake provides damping that...
-
A trap-jaw ant has mandibles that can snap shut with some force, as you might expect from its name. The formidable snap is good for more than capturing prey. When an ant snaps its jaws against the...
Study smarter with the SolutionInn App