

A food processor was receiving complaints from its customers about the firmness of its canned sweet potatoes.
Question:
A food processor was receiving complaints from its customers about the firmness of its canned sweet potatoes. The firm’s research scientist decided to conduct an experiment to determine if adding pectin to the sweet potatoes may result in a product with a more desirable firmness. The experiment was designed using 3 concentrations of pectin (by weight): 0.15%, 2%, 3%, and a control 0%. The processor packed 6 cans with sweet potatoes with a 25% (by weight) sugar solution. Two cans were randomly assigned to each of the pectin concentrations with the appropriate percentage of pectin added to the sugar syrup. The cans were sealed and placed in a 25°C environment for 30 days. At the end of the storage time, the cans were opened and a firmness determination was made for the contents of each can. These appear below:

Minitab output for analyzing the above data is given below.
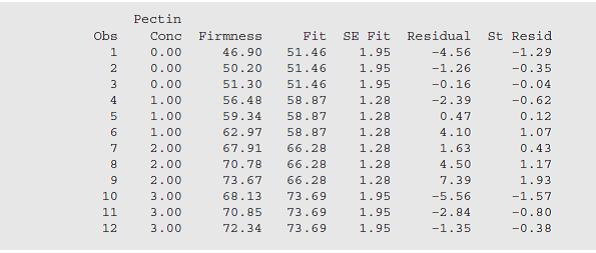
a. Let x denote the pectin concentration of the sweet potatoes in a can and y denote the firmness reading following the 30 days of storage at 25°C. Plot the sample data in a scatter diagram.
b. From the output obtain the least-squares estimates for the parameters and plot the least-squares line on your scatter diagram.
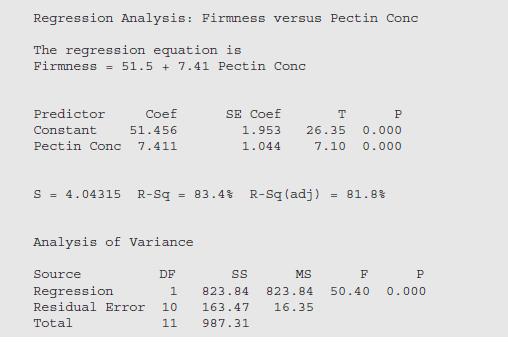
c. Does firmness appear to be in a constant increasing relation with pectin concentration?
d. Predict the firmness of a can of sweet potatoes treated with a 1.5% concentration of pectin (by weight) after 30 days of storage at 25°C.
Expert Answer:


Introduction to Probability and Statistics
ISBN: 978-1133103752
14th edition
Authors: William Mendenhall, Robert Beaver, Barbara Beaver
