

a. Plot the data on a scattergram with the S&P index on the vertical axis and CPI
Fantastic news! We've Found the answer you've been seeking!
Question:
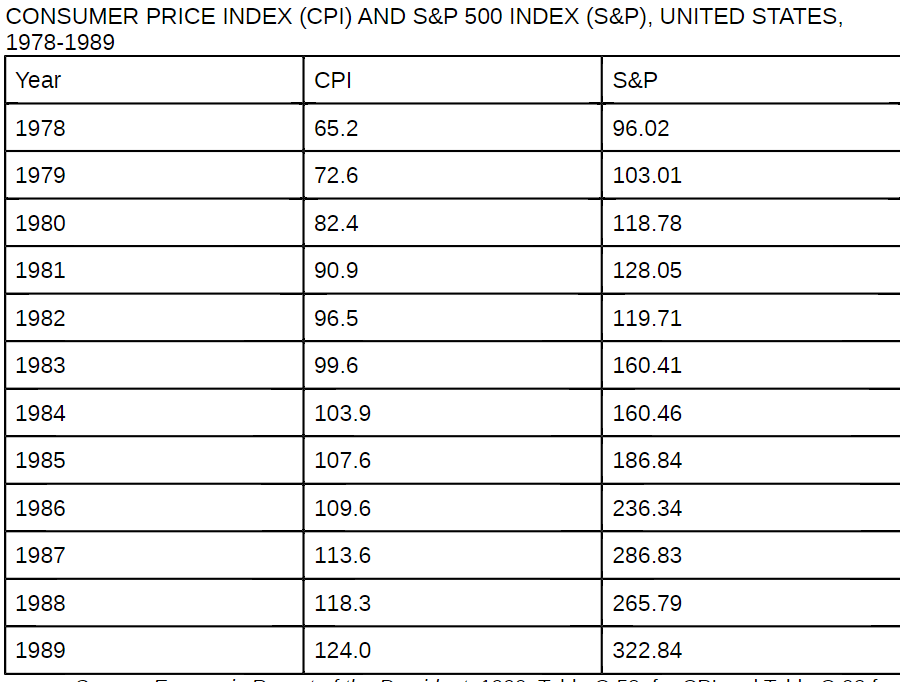
a. Plot the data on a scattergram with the S&P index on the vertical axis and CPI on the horizontal axis.
b. What do you expect the relationship between the two indexes to be from economic theory? What can you say about this relationship from the graph in (a)?
c. Consider the following regression model:
? ? ? ? ? ? (S&P) t = B 1 + B 2 CPI t + u t
? ? ? Use the method of least squares to estimate this model from the preceding data and interpret your results. Do the calculations ?by hand.? (You may use a calculator or you may set up and do the calculations in Excel, but do not use any Excel statistical procedures).
d. Do the results obtained in part (c) make economic sense?
Expert Answer:

Related Book For 

Small Business Management Entrepreneurship and Beyond
ISBN: 978-0538453141
5th edition
Authors: Timothy s. Hatten
Posted Date:
