

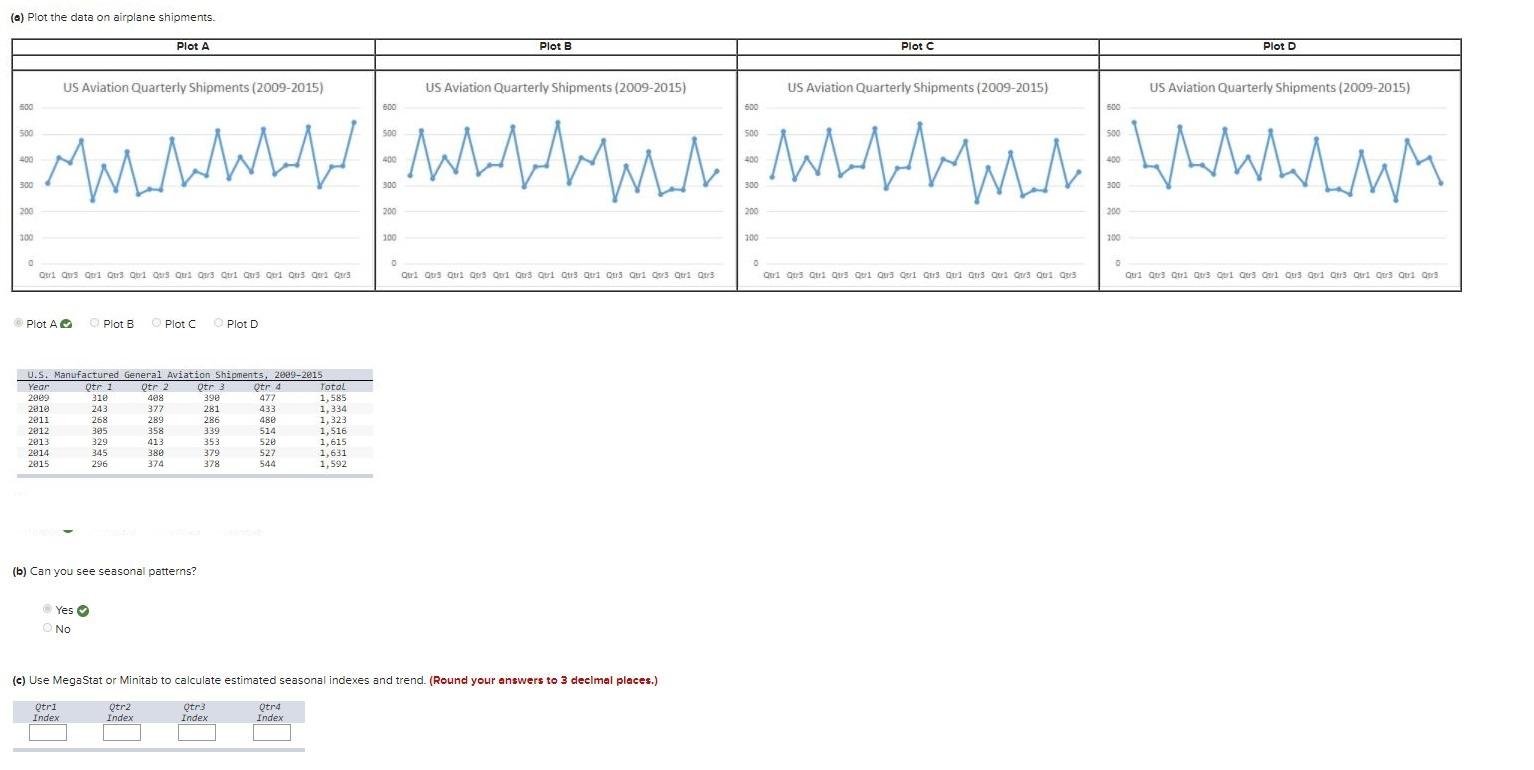
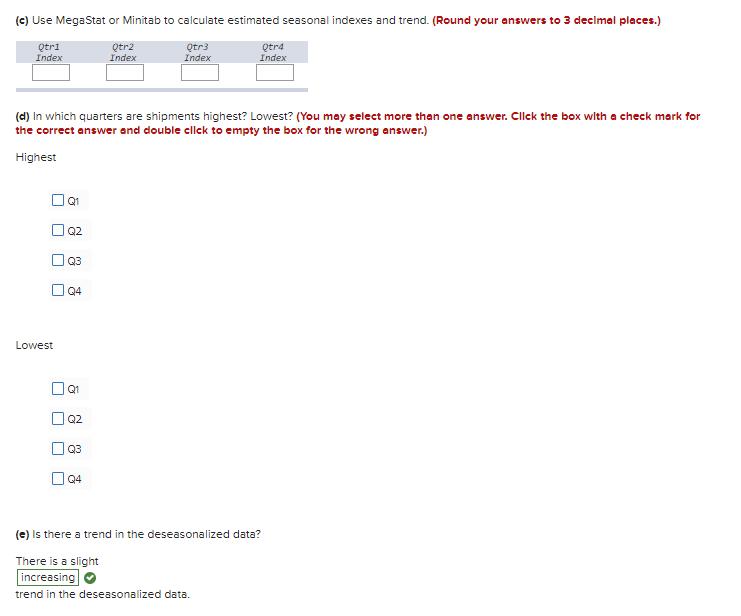
(a) Plot the data on airplane shipments. Plot A Plot B Plot C Plot D US...
Fantastic news! We've Found the answer you've been seeking!
Question:

Transcribed Image Text:
(a) Plot the data on airplane shipments. Plot A Plot B Plot C Plot D US Aviation Quarterly Shipments (2009-2015) US Aviation Quarterly Shipments (2009-2015) US Aviation Quarterly Shipments (2009-2015) US Aviation Quarterly Shipments (2009-2015) 500 600 500 600 500 S00 500 500 400 400 400 400 300 300 300 300 200 200 200 200 100 100 100 100 Qtri Qus Qui Qus Qu1 Qers Qui Qar3 Qtri Qu3 Ql Qus Qtra Qua Qui Qus Qtri Qus Qri Qu3 Qui Qtr3 Qtri Qtrs Qri Q3 Qtri Qtr3 Qui Qus Qtrl Qt3 Qi Qr3 Qel Qu3 Op1 Qtr3 Qtrl Qu Qtri Ors Plot AO O Plot B O Plot C O Plot D U.S. Manufactured General Aviation Shipments, 2009-2015 Totol 1,585 1,334 1,323 1,516 1,615 1,631 1,592 Qtr 1 310 243 Qtr 3 390 Qtr 4 477 Year Qtr 2 2009 408 2810 377 281 433 2011 268 289 286 480 2012 305 358 339 514 2013 329 413 353 520 2014 345 380 379 527 2015 296 374 378 544 (b) Can you see seasonal patterns? Yes O O No (c) Use MegaStat or Minitab to calculate estimated seasonal indexes and trend. (Round your answers to 3 decimal places.) Qtri Index Qtr2 Qtr3 Tndey Qtra Index Index Index (c) Use MegaStat or Minitab to calculate estimated seasonal indexes and trend. (Round your answers to 3 decimal places.) Qtri Index Qtr2 Index Qtr3 Index Qtr4 Index (d) In which quarters are shipments highest? Lowest? (You may select more than one answer. Clck the box with a check mark for the correct answer and double cllck to empty the box for the wrong answer.) Highest O Q2 OQ3 O Q4 Lowest Q1 O Q2 Q3 O 04 (e) Is there a trend in the deseasonalized data? There is a slight increasing trend in the deseasonalized data. ロ U.S. Manufactured General Aviation Shipments, 2009-2015 Year Qtr 1 Qtr 2 Qtr 3 Qtr 4 Total Year Qtr Planes 1,585 1,334 2009 310 408 390 477 2009 Qtr1 310 2010 243 377 281 433 Qtr2 408 2011 268 289 286 480 1,323 Qtr3 390 2012 305 358 339 514 1,516 Qtr4 477 2013 2014 329 413 353 520 1,615 2010 Qtr1 243 345 380 379 527 1,631 Qtr2 377 2015 296 374 378 544 1,592 Qtr3 281 Qtr4 433 2011 Qtr1 268 LearningStats Qtr2 289 Qtr3 286 Copyright © 2019 by The McGraw-Hill Companies Qtr4 480 2012 Qtr1 305 Qtr2 358 This spreadsheet is intended solely for educational purposes by Qtr3 339 licensed users of Connect® Qtr4 514 2013 Qtr1 329 Qtr2 413 Qtr3 353 Source: General Aviation Manufacturers Association (www.gama.aero). Quarterly shipments may not add to annual total because some manufacturers only report annual totals. Qtr4 520 2014 Qtr1 345 Qtr2 380 Qtr3 379 Qtr4 527 2015 Qtr1 296 Qtr2 Qtr3 374 378 Qtr4 544 (a) Plot the data on airplane shipments. Plot A Plot B Plot C Plot D US Aviation Quarterly Shipments (2009-2015) US Aviation Quarterly Shipments (2009-2015) US Aviation Quarterly Shipments (2009-2015) US Aviation Quarterly Shipments (2009-2015) 500 600 500 600 500 S00 500 500 400 400 400 400 300 300 300 300 200 200 200 200 100 100 100 100 Qtri Qus Qui Qus Qu1 Qers Qui Qar3 Qtri Qu3 Ql Qus Qtra Qua Qui Qus Qtri Qus Qri Qu3 Qui Qtr3 Qtri Qtrs Qri Q3 Qtri Qtr3 Qui Qus Qtrl Qt3 Qi Qr3 Qel Qu3 Op1 Qtr3 Qtrl Qu Qtri Ors Plot AO O Plot B O Plot C O Plot D U.S. Manufactured General Aviation Shipments, 2009-2015 Totol 1,585 1,334 1,323 1,516 1,615 1,631 1,592 Qtr 1 310 243 Qtr 3 390 Qtr 4 477 Year Qtr 2 2009 408 2810 377 281 433 2011 268 289 286 480 2012 305 358 339 514 2013 329 413 353 520 2014 345 380 379 527 2015 296 374 378 544 (b) Can you see seasonal patterns? Yes O O No (c) Use MegaStat or Minitab to calculate estimated seasonal indexes and trend. (Round your answers to 3 decimal places.) Qtri Index Qtr2 Qtr3 Tndey Qtra Index Index Index (c) Use MegaStat or Minitab to calculate estimated seasonal indexes and trend. (Round your answers to 3 decimal places.) Qtri Index Qtr2 Index Qtr3 Index Qtr4 Index (d) In which quarters are shipments highest? Lowest? (You may select more than one answer. Clck the box with a check mark for the correct answer and double cllck to empty the box for the wrong answer.) Highest O Q2 OQ3 O Q4 Lowest Q1 O Q2 Q3 O 04 (e) Is there a trend in the deseasonalized data? There is a slight increasing trend in the deseasonalized data. ロ U.S. Manufactured General Aviation Shipments, 2009-2015 Year Qtr 1 Qtr 2 Qtr 3 Qtr 4 Total Year Qtr Planes 1,585 1,334 2009 310 408 390 477 2009 Qtr1 310 2010 243 377 281 433 Qtr2 408 2011 268 289 286 480 1,323 Qtr3 390 2012 305 358 339 514 1,516 Qtr4 477 2013 2014 329 413 353 520 1,615 2010 Qtr1 243 345 380 379 527 1,631 Qtr2 377 2015 296 374 378 544 1,592 Qtr3 281 Qtr4 433 2011 Qtr1 268 LearningStats Qtr2 289 Qtr3 286 Copyright © 2019 by The McGraw-Hill Companies Qtr4 480 2012 Qtr1 305 Qtr2 358 This spreadsheet is intended solely for educational purposes by Qtr3 339 licensed users of Connect® Qtr4 514 2013 Qtr1 329 Qtr2 413 Qtr3 353 Source: General Aviation Manufacturers Association (www.gama.aero). Quarterly shipments may not add to annual total because some manufacturers only report annual totals. Qtr4 520 2014 Qtr1 345 Qtr2 380 Qtr3 379 Qtr4 527 2015 Qtr1 296 Qtr2 Qtr3 374 378 Qtr4 544
Expert Answer:

Related Book For 

Applied Statistics in Business and Economics
ISBN: 978-0073521480
4th edition
Authors: David Doane, Lori Seward
Posted Date:
Students also viewed these mathematics questions
-
(a) Plot the data on leisure and hospitality employment. (b) Describe the trend (if any) and discuss possible causes. (c) Fit the linear and exponential trends. Would these trend models give credible...
-
(a) Plot the data on law enforcement officers killed. (b) Describe the trend (if any) and discuss possible causes or anomalies in the data. (c) Would a fitted trend be helpful? Explain. (d) Make a...
-
(a) Plot the data on revolving credit (credit cards and home equity lines of credit are the two major types of revolving credit). (b) Use MegaStat or MINITAB to calculate seasonal indexes and trend....
-
Consider the following independent situations found during audit testing of Faran Ltd, which has a balance date of 30 June 2019. Assume that all the situations are material. (i)Recent industrial...
-
Describe the differences in setting premiums using schedule and class rating systems.
-
A 20 mm diameter copper pipe (19.94 mm inside diameter) carries water at a flow rate of 40 L/s. Determine the average velocity of the fluid.
-
During February, Peters Hardware made sales of \($38,600\) and ended the month with inventories totaling \($5,400.\) Cost of Goods Sold was \($23,200.\) Total operating expenses were \($8,700.\) How...
-
Overnight Laundry is considering the purchase of a new pressing machine that would cost $100,000 and would produce incremental cash flows of $25,000 annually for 6 years. The machine has a terminal...
-
What is a Symmetrical and Reciprocal Relationship between variables of Business Research. Write down the difference of both.
-
Lays Potato Chips is examining their Wavy Lays chip line. They began the year expecting to produce 500,000 bags of potato chips. They projected that each bag would require 3 pounds of potatoes and...
-
Inductive reasoning is a reasonable way to think about everyday life, but it does not provide the logical structure that propositional logic does.Discuss.
-
Explain the meanings of the following terms in the context of logic: a. truth b. validity c. equivalent d. uncertainty e. tautology f. satisfiable g. sound h. complete i. decidable j. modal logic
-
Implement an Expectiminimax algorithm for a game of chance (you might use backgammon, or another dice game).
-
Is it possible to add alphabeta pruning to your Expectiminimax program? If so, do so. If not, can you find another way of pruning the tree that improves the performance of the program? How can you...
-
Add alphabeta pruning to your program, and see what difference (if any) it makes to the number of nodes the program has to examine when playing a game.
-
Given finite sets A and B, write the pseudo-code for a procedure that prints the elements in each of: *You may have to carefully think about the parameters of your procedure. A - B An B AUB P(A)
-
The senior management at Davis Watercraft would like to determine if it is possible to improve firm profitability by changing their existing product mix. Currently, the product mix is determined by...
-
Advertisers need to know which age groups are likely to see their ads. Purchasers of 120 copies of Cosmopolitan are shown by age group. (a) Make a bar chart and describe it. (b) Calculate expected...
-
The probability is .90 that a vending machine in the Oxnard University Student Center will dispense the desired item when correct change is inserted. If 200 customers try the machine, find the...
-
Which type of data (cross-sectional or time series) is each variable? a. Scores of 50 students on a midterm accounting exam last semester. b. Bobs scores on 10 weekly accounting quizzes last...
-
Briefly describe six reasons why the auditor's approach to obtaining an understanding of internal control is different when a computer is used rather than manual processing.
-
In obtaining an understanding of the control environment that affects computer processing, the auditor will often consider several matters. Briefly describe these matters.
-
What is batch processing?

Study smarter with the SolutionInn App