

Question: A real estate firm would like you to conduct an analysis explaining house prices as a function of CRIME (number of crimes per capita), In(NOX)
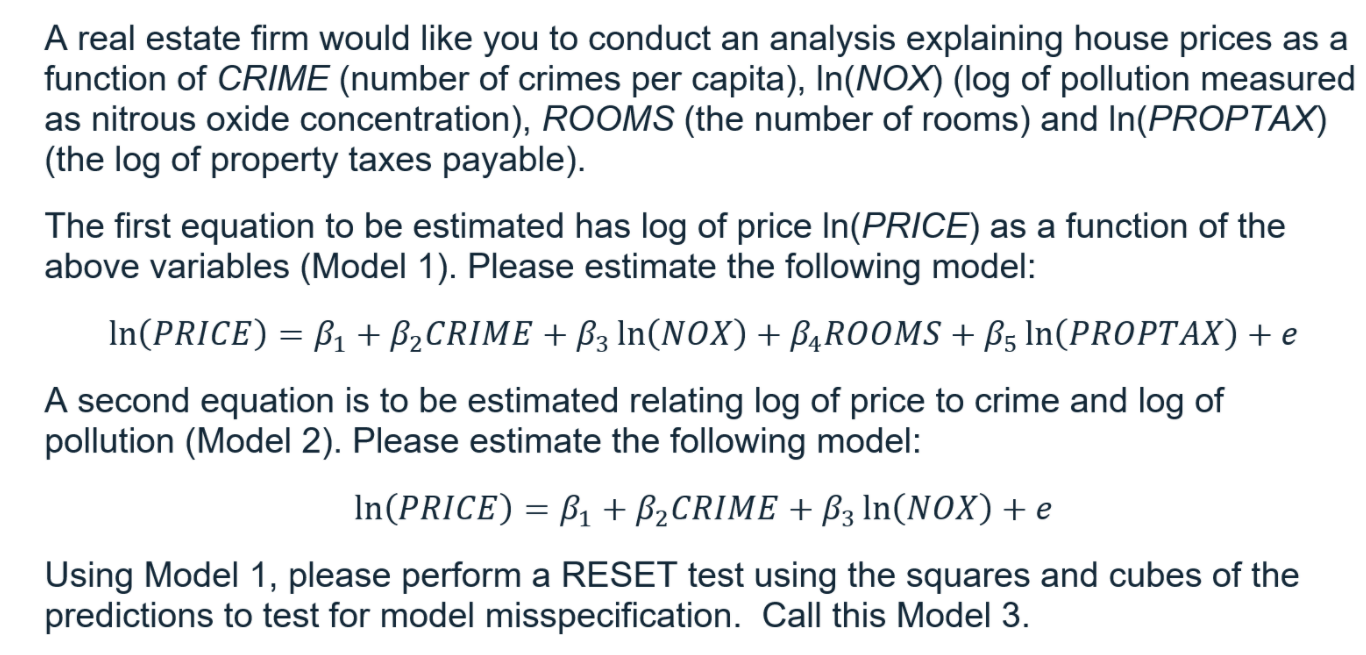
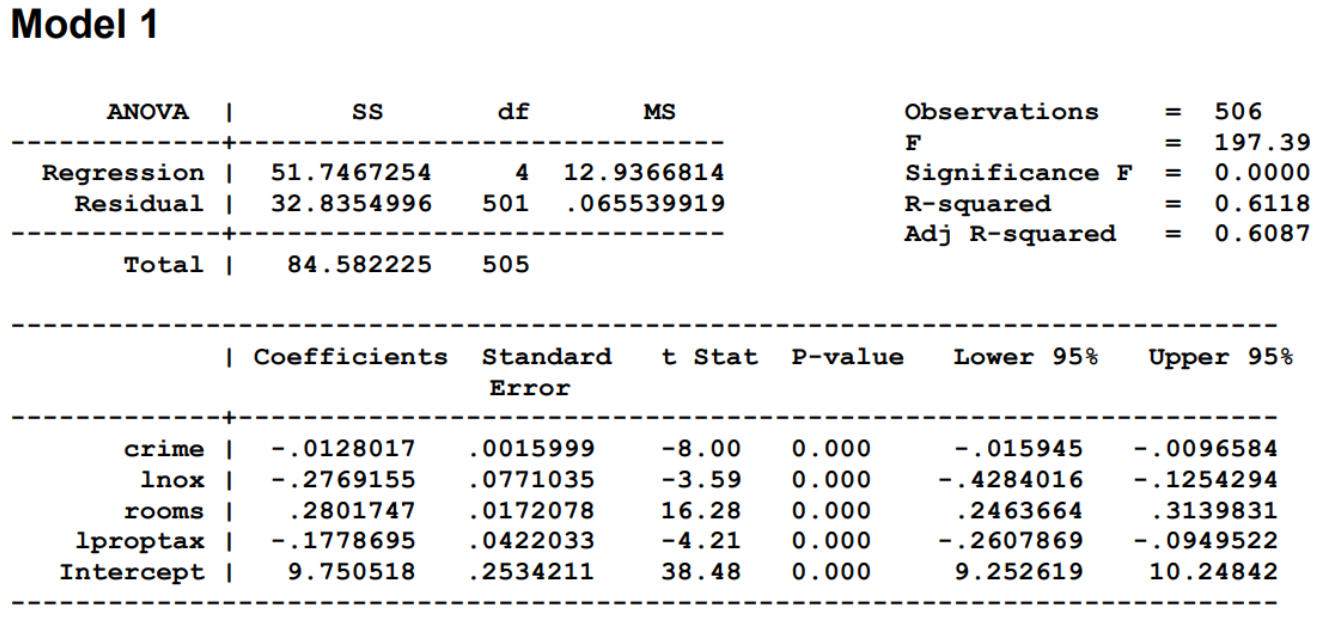
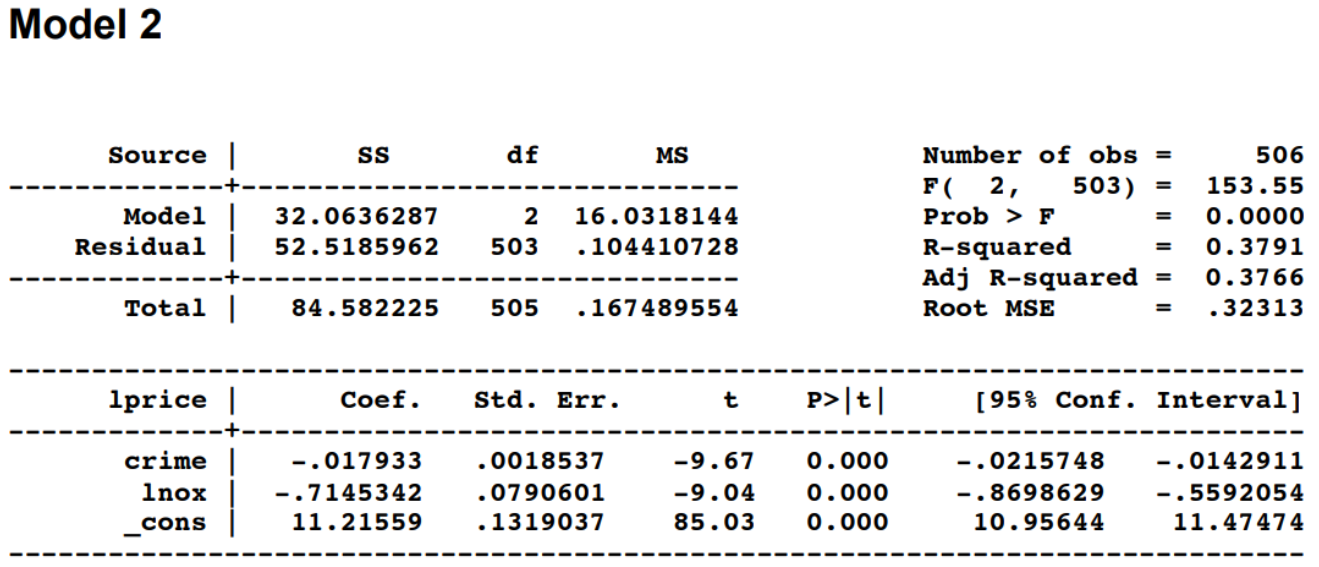
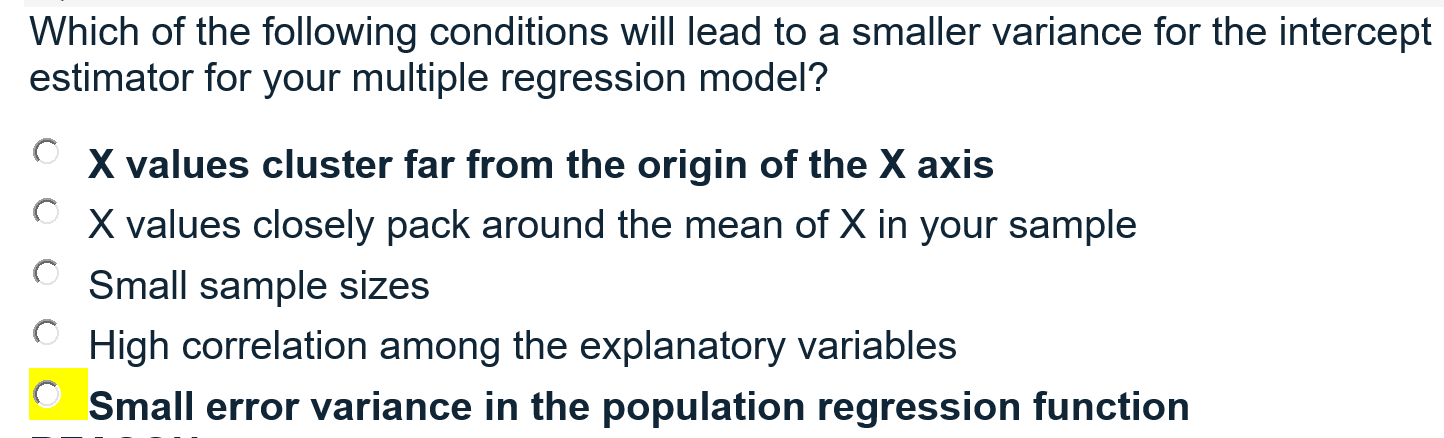
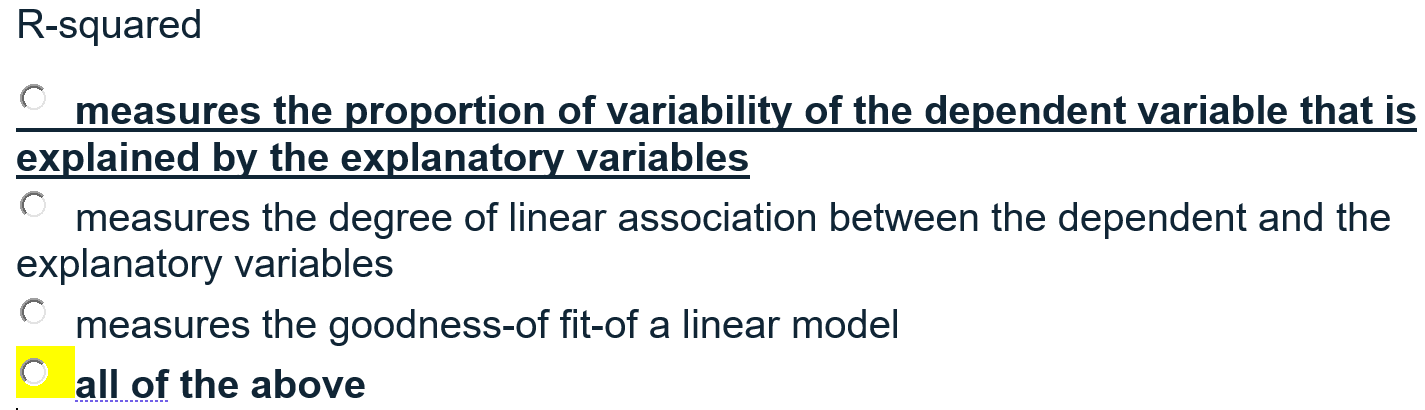
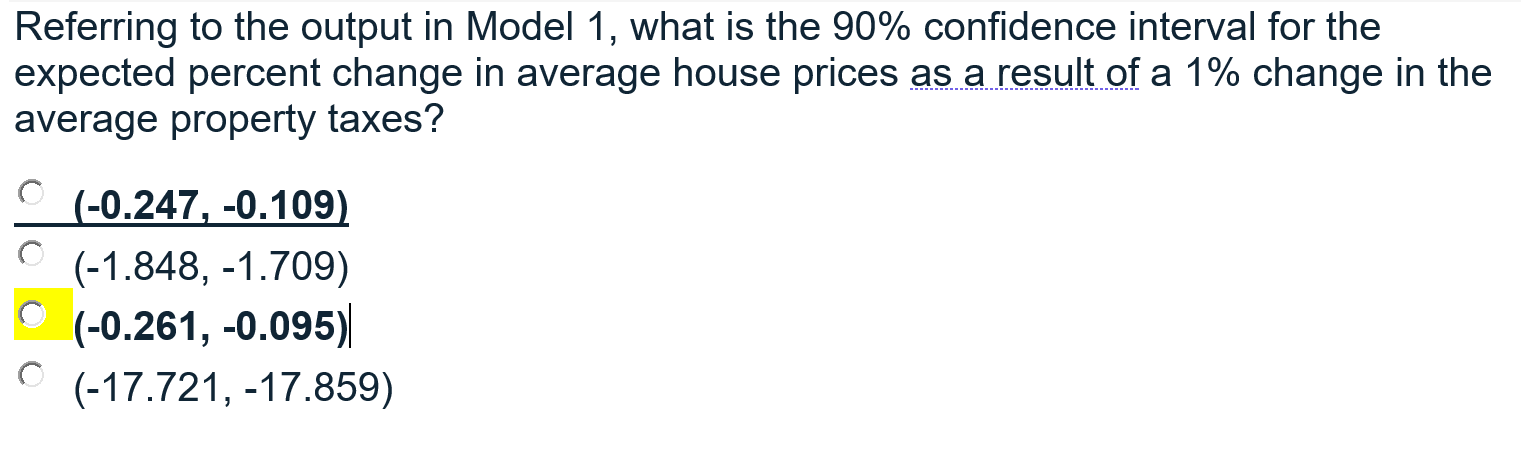
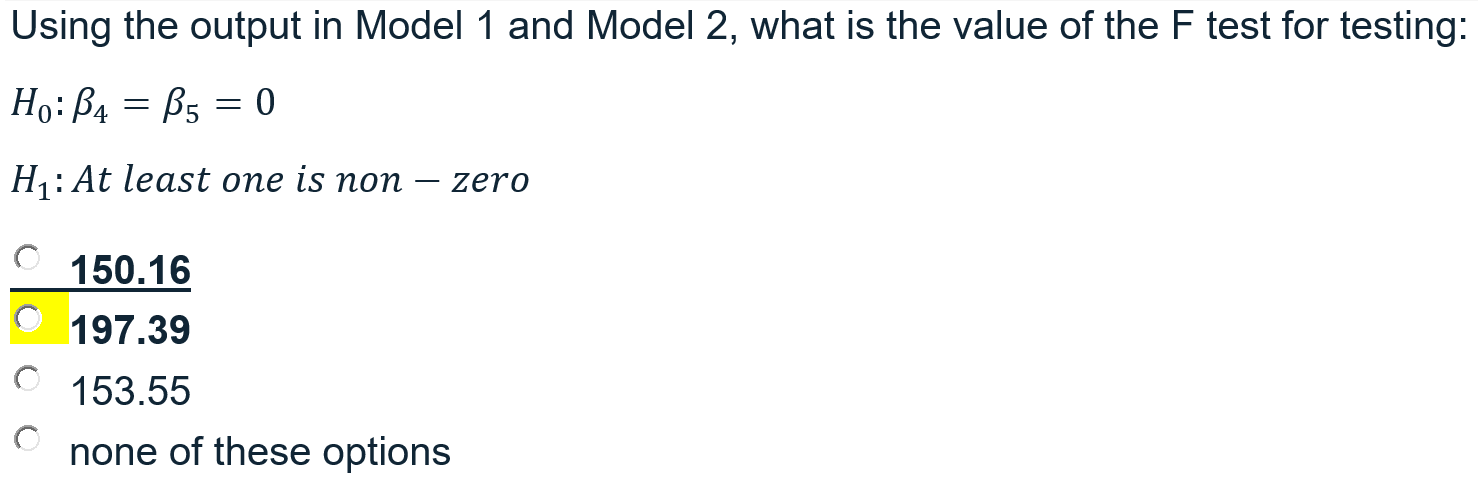
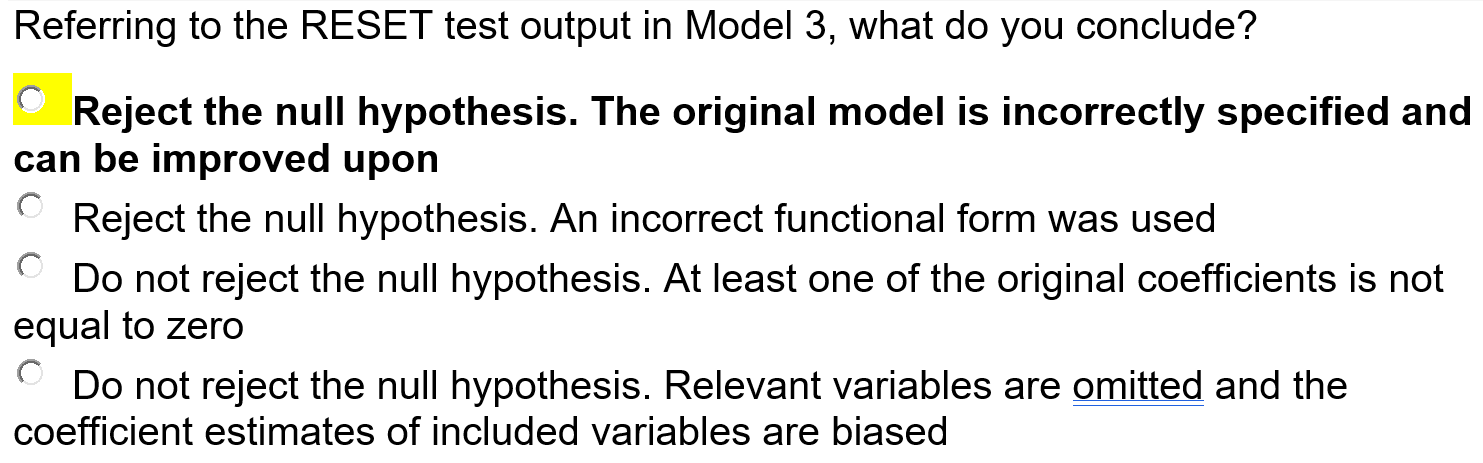
A real estate firm would like you to conduct an analysis explaining house prices as a function of CRIME (number of crimes per capita), In(NOX) (log of pollution measured as nitrous oxide concentration), ROOMS (the number of rooms) and In(PROPTAX) (the log of property taxes payable). The first equation to be estimated has log of price In(PRICE) as a function of the above variables (Model 1). Please estimate the following model: In(PRICE) = B1 + B2CRIME + B3 ln(NOX) + B4ROOMS + B5 In(PROPTAX) + e A second equation is to be estimated relating log of price to crime and log of pollution (Model 2). Please estimate the following model: In(PRICE) = B1 + B2CRIME + B3 In(NOX) +e Using Model 1, please perform a RESET test using the squares and cubes of the predictions to test for model misspecification. Call this Model 3. Model 1 ANOVA 1 SS df MS = = Regression 1 Residual = 51.7467254 32.8354996 4 501 Observations F Significance F R-squared Adj R-squared 12.9366814 .065539919 506 197.39 0.0000 0.6118 0.6087 = Total 1 84.582225 505 | Coefficients t Stat P-value Lower 95% Standard Error Upper 95% crime lnox | rooms 1 1proptax Intercept 1 -.0128017 -.2769155 .2801747 -.1778695 9.750518 .0015999 .0771035 .0172078 .0422033 2534211 -8.00 -3.59 16.28 -4.21 38.48 0.000 0.000 0.000 0.000 0.000 -.015945 -.4284016 .2463664 -.2607869 9.252619 -.0096584 -. 1254294 . 3139831 -.0949522 10.24842 Model 2 Source SS df MS = = Model Residual 32.0636287 52.5185962 2 503 16.0318144 . 104410728 Number of obs = FC 2, 503) Prob > F R-squared Adj R-squared Root MSE 506 153.55 0.0000 0.3791 0.3766 .32313 = = Total | 84.582225 505 . 167489554 = 1price | Coef. Std. Err. t P>|t| [95% Conf. Interval] crime Inox cons -.017933 -.7145342 11.21559 .0018537 .0790601 .1319037 -9.67 -9.04 85.03 0.000 0.000 0.000 -.0215748 -.8698629 10.95644 -.0142911 -.5592054 11.47474 Which of the following conditions will lead to a smaller variance for the intercept estimator for your multiple regression model? X values cluster far from the origin of the X axis X values closely pack around the mean of X in your sample Small sample sizes High correlation among the explanatory variables Small error variance in the population regression function 0 R-squared measures the proportion of variability of the dependent variable that is explained by the explanatory variables measures the degree of linear association between the dependent and the explanatory variables measures the goodness-of fit-of a linear model all of the above Referring to the output in Model 1, what is the 90% confidence interval for the expected percent change in average house prices as a result of a 1% change in the average property taxes? (-0.247, -0.109) (-1.848, -1.709) (-0.261, -0.095) (-17.721, -17.859) Using the output in Model 1 and Model 2, what is the value of the F test for testing: Ho:B4 = B5 = 0 H: At least one is non zero 150.16 197.39 153.55 none of these options Referring to the RESET test output in Model 3, what do you conclude? Reject the null hypothesis. The original model is incorrectly specified and can be improved upon Reject the null hypothesis. An incorrect functional form was used Do not reject the null hypothesis. At least one of the original coefficients is not equal to zero Do not reject the null hypothesis. Relevant variables are omitted and the coefficient estimates of included variables are biased 0 A real estate firm would like you to conduct an analysis explaining house prices as a function of CRIME (number of crimes per capita), In(NOX) (log of pollution measured as nitrous oxide concentration), ROOMS (the number of rooms) and In(PROPTAX) (the log of property taxes payable). The first equation to be estimated has log of price In(PRICE) as a function of the above variables (Model 1). Please estimate the following model: In(PRICE) = B1 + B2CRIME + B3 ln(NOX) + B4ROOMS + B5 In(PROPTAX) + e A second equation is to be estimated relating log of price to crime and log of pollution (Model 2). Please estimate the following model: In(PRICE) = B1 + B2CRIME + B3 In(NOX) +e Using Model 1, please perform a RESET test using the squares and cubes of the predictions to test for model misspecification. Call this Model 3. Model 1 ANOVA 1 SS df MS = = Regression 1 Residual = 51.7467254 32.8354996 4 501 Observations F Significance F R-squared Adj R-squared 12.9366814 .065539919 506 197.39 0.0000 0.6118 0.6087 = Total 1 84.582225 505 | Coefficients t Stat P-value Lower 95% Standard Error Upper 95% crime lnox | rooms 1 1proptax Intercept 1 -.0128017 -.2769155 .2801747 -.1778695 9.750518 .0015999 .0771035 .0172078 .0422033 2534211 -8.00 -3.59 16.28 -4.21 38.48 0.000 0.000 0.000 0.000 0.000 -.015945 -.4284016 .2463664 -.2607869 9.252619 -.0096584 -. 1254294 . 3139831 -.0949522 10.24842 Model 2 Source SS df MS = = Model Residual 32.0636287 52.5185962 2 503 16.0318144 . 104410728 Number of obs = FC 2, 503) Prob > F R-squared Adj R-squared Root MSE 506 153.55 0.0000 0.3791 0.3766 .32313 = = Total | 84.582225 505 . 167489554 = 1price | Coef. Std. Err. t P>|t| [95% Conf. Interval] crime Inox cons -.017933 -.7145342 11.21559 .0018537 .0790601 .1319037 -9.67 -9.04 85.03 0.000 0.000 0.000 -.0215748 -.8698629 10.95644 -.0142911 -.5592054 11.47474 Which of the following conditions will lead to a smaller variance for the intercept estimator for your multiple regression model? X values cluster far from the origin of the X axis X values closely pack around the mean of X in your sample Small sample sizes High correlation among the explanatory variables Small error variance in the population regression function 0 R-squared measures the proportion of variability of the dependent variable that is explained by the explanatory variables measures the degree of linear association between the dependent and the explanatory variables measures the goodness-of fit-of a linear model all of the above Referring to the output in Model 1, what is the 90% confidence interval for the expected percent change in average house prices as a result of a 1% change in the average property taxes? (-0.247, -0.109) (-1.848, -1.709) (-0.261, -0.095) (-17.721, -17.859) Using the output in Model 1 and Model 2, what is the value of the F test for testing: Ho:B4 = B5 = 0 H: At least one is non zero 150.16 197.39 153.55 none of these options Referring to the RESET test output in Model 3, what do you conclude? Reject the null hypothesis. The original model is incorrectly specified and can be improved upon Reject the null hypothesis. An incorrect functional form was used Do not reject the null hypothesis. At least one of the original coefficients is not equal to zero Do not reject the null hypothesis. Relevant variables are omitted and the coefficient estimates of included variables are biased 0
Step by Step Solution
There are 3 Steps involved in it

Get step-by-step solutions from verified subject matter experts