

A Region East East Fart East Fart East Fam East Fam East Com East H East...
Fantastic news! We've Found the answer you've been seeking!
Question:
Transcribed Image Text:
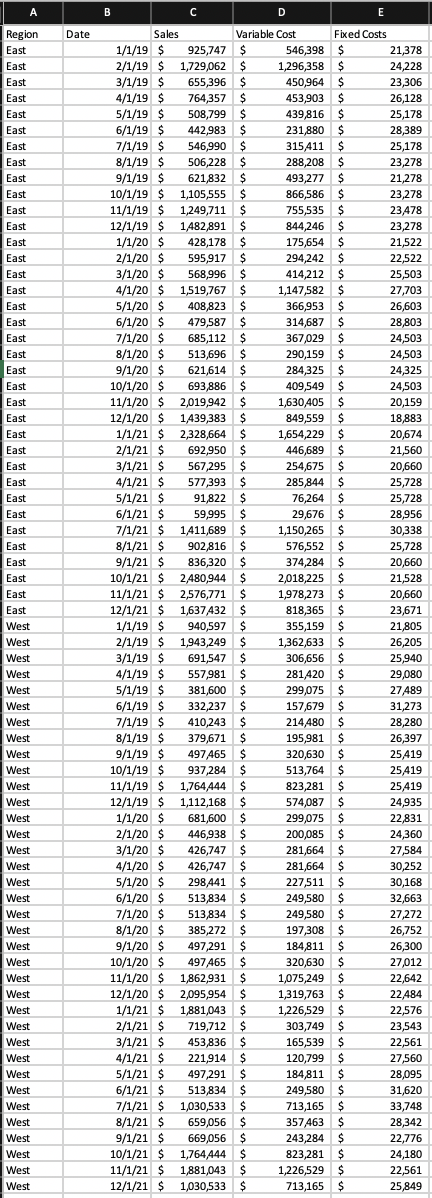
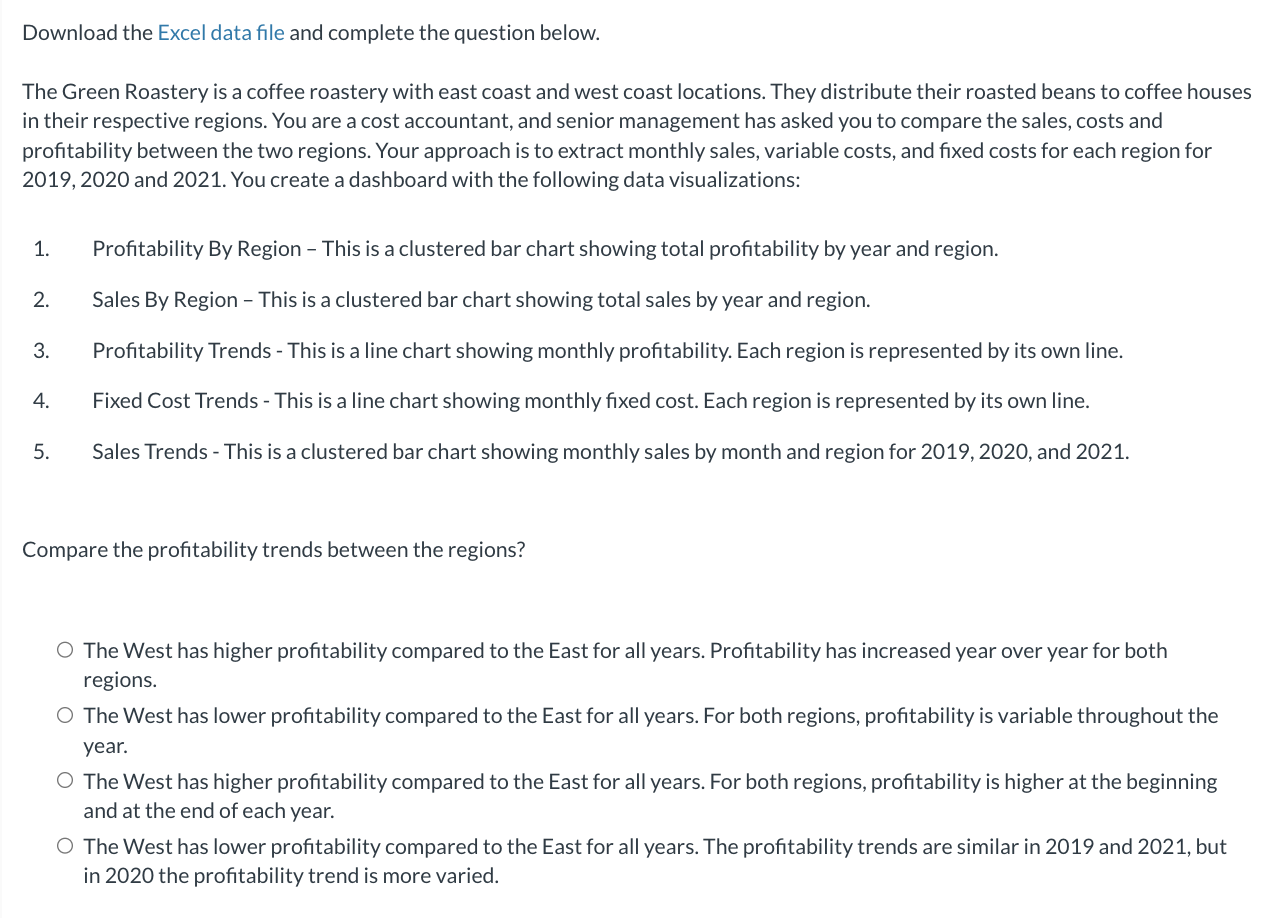
A Region East East Fart East Fart East Fam East Fam East Com East H East E East Fam East Fam East Fam East Fam East Fam East Fam East Fam East Com East Fam East Com East Fam East C East C East Fam East Fam East Com East Fart East Fart East pavas East Leaves East Loves East peces East paes East peces East Leaves East Leaves East wwws East wwws West Brea West perces West peces West perces West perces West perces West perces West perces West perces West perces West perces West perces West peces West perces West West West West www West www. West www. West www. West www. West www. West www. West www. West www. West www. West www. West www. West www. West www West www West wwwk West West West West Date B Sales 1/1/19 $ 2/1/19 $ 3/1/19 $ $ Anno 4/1/19 chho 5/1/19 $ chho 6/1/19 $ 7/1/19 $ P 8/1/19 $ 9/1/19 $ $ 104.40 10/1/19 114/06 11/1/19 12/40 12/1/19 $ $ 1/1/20 $ Suba 2/1/20 $ Suba 3/1/20 $ Alho A 4/1/20 $ ba 5/1/20 $ chho 6/1/20 $ 7/1/20 $ albo 8/1/20 $ of bo 9/1/20 $ 104.00 10/1/20 $ 11/1/20 $ 134.00 12/1/20 $ ahh 1/1/21 $ 2/1/21 $ 3/1/21 $ Y 4/1/21 $ chi 5/1/21 $ cha 6/1/21 $ akba 7/1/21 $ Haw 8/1/21 $ ob 9/1/21 $ sokba 10/1/21 $ www 11/1/21 $ *** 12/1/21 $ 1/1/19 $ 2/1/19 $ DIY 3/1/19 $ 4/1/19 $ 5/1/19 $ 6/1/19 $ ahho 7/1/19 $ were 8/1/19 $ 9/1/19 $ 10/1/19 $ 11/1/19 $ 12/1/19 $ 1/1/20 $ 2/1/20 $ 3/1/20 $ 4/1/20 $ 5/1/20 $ 6/1/20 $ 3/4 7/1/20 $ 24.00 8/1/20 $ 04.50 9/1/20 $ 104.00 10/1/20 $ 11/be 11/1/20 $ ----- 12/1/20 $ 1/1/21 $ 2/1/21 $ 3/1/21 $ 4/1/21 $ wa 5/1/21 $ MA 6/1/21 $ C D Variable Cost 925,747 $ 1,729,062 $ 655,396 $ A 764,357 $ A 500 799 508,799 $ 443.003 A 442,983 $ FAC.000 A 546,990 $ 505229 A 506,228 $ www.c A 621,832 $ ****.*** A 1,105,555 $ 4240 241 1,249,711 Feder 1,482,891 $ A 420470 428,178 A $ A $ 595,917 $ 550.000 A 568,996 $ ... A 1,519,767 $ A 408,823 $ 470607 A 479,587 $ A Cor 113 685,112 $ A F43.CO 513,696 $ A 621,614 $ 602 996 A 693,886 $ 2016052 A 2,019,942 $ 420 303 A 1,439,383 $ 220 CCA 2,328,664 $ 502.050 692,950 $ 567,295 $ ****** 577,393 $ Berper 91,822 $ www X 59,995 $ wwwww 1411,689 $ + 902,816 $ ****** 836,320 $ ******* 2,480,944 $ www. 2,576,771 $ **** 1,637432 $ Spearhee 940,597 $ 1063340 1,943,249 $ ****** 691,547 $ + ****** 557,981 $ perpet 381,600 $ ****** 410,243 333333 332,237 $ Y $ + ***.*** 379,671 $ Beware + 497 465 $ ***** 937,284 $ www. 1,764,444 $ ******* 1,112,168 $ ******* 681,600 $ 446,938 $ www 426,747 $ 426,747 $ 298,441 $ 513.924 A 513,834 $ F13024 A 513,834 $ ***.*** A 385,272 $ A $ 407.201 497,291 www 497465 $ A 1963,021 * 1,862,931 $ * 2,095,954 $ 1.001.045 1,881,043 $ HOM 719,712 $ A 453026 453,836 $ **** 221,914 *** 497,291 $ + F43024 A 513,834 $ A $ 1030533 ^ 7/1/21 $ 1,030,533 $ 8/1/21 $ 9/1/21 $ 10/1/21 $ 11/1/21 $ 12/1/21 $ GEODES 659,056 $ 669,056 $ 1,764,444 $ 1,881,043 $ 1,030,533 $ E Fixed Costs 546,398 $ 1,296,358 $ 450,964 $ A 453,903 $ 420916 439,816 $ 221.990 d 231,880 $ 242444 315411 $ A 300 300 A 288,208 $ * 403377 493,277 $ A DCC FOC 866,586 $ SEE FAR 755,535 $ A 244 245 844,246 $ 175 65 A A 175,654 $ 304363 294,242 $ www. 414,212 $ A 1,147,582 $ ACCES A 366,953 $ A ****** 314,687 $ A 362.030 367,029 $ d 290 159 290,159 $ 284,325 $ A 400 540 409,549 $ ****** 1,630,405 $ 040 FFO 849,559 $ A A 1654 220 1,654,229 $ A45 690 446,689 $ 254,675 $ w 285,844 $ ****** 76,264 $ ***** + 29,676 ****** + $ $ * 1,150,265 **** 576,552 ****** + 374,284 www.*** + $ $ 2,018,225 *** 1,978,273 ****** 281,420 ***.*** 299,075 $ + $ + $ + 818,365 ****** $ 355,159 1363633 + 1,362,633 ****** + 306,656 $ $ + $ + $ + $ $ + ****.*** 157,679 ****** + 214,480 $ ***.*** + 195,981 ***.*** 320,630 $ ****** + 513,764 ***.*** + 823,281 www.w + 574,087 $ $ $ ***** 299,075 $ were 200,085 $ 281,664 $ 281,664 $ 227,511 $ 240 590 + 249,580 $ 340500 + A 249,580 $ ****** 197,308 $ 200 184,811 $ 230.620 A A 320,630 $ A 5035 240 1,075,249 $ A 1210 1,319,763 + 1.336.630 1,226,529 ****** 303,749 $ ACE FRO 165,539 $ 120.700 120,799 $ ****** 184,811 $ * * A ***.*** A 249,580 $ $ A $ MANAGE 713,165 $ * 257 462 357,463 $ 243,284 $ 823,281 $ 1,226,529 $ 713,165 $ 21,378 24,228 23,306 26 129 26,128 25 170 25,178 30.300 28,389 25 170 25,178 22.30 23,278 MAZO 21,278 23.370 23,278 ***** 23,478 **.*** 23,278 ww 21,522 33633 22,522 35 503 25,503 ***** 27,703 26.603 26,603 30.003 28,803 34503 24,503 DACOS 24,503 24335 24,325 24.502 24,503 20150 20,159 10.003 18,883 20.634 20,674 21.550 21,560 20,660 wwwww 25,728 ***** 25,728 ***** 28,956 ***** 30,338 ***** 25,728 ***** 20,660 ***** 21,528 ***** 20,660 **.*** 23,671 **** 21,805 ***** 26,205 ***** 25,940 ***** 29,080 ***** 27489 *** 31,273 ***** 28,280 ***** 26,397 wwwww 25,419 ***** 25,419 ***** 25,419 MON 24,935 ***** 22,831 ***** 24,360 ***** 27,584 30,252 30,168 22.445 32,663 ***** 27,272 ww 26,752 ***** 26,300 ***** 27,012 23663 22,642 23.404 22,484 ***** 22,576 ***** 23,543 22,561 27,560 20.005 28,095 21.620 31,620 22 DI 33,748 200 28,342 22 776 22,776 24,180 22,561 25,849 Download the Excel data file and complete the question below. The Green Roastery is a coffee roastery with east coast and west coast locations. They distribute their roasted beans to coffee houses in their respective regions. You are a cost accountant, and senior management has asked you to compare the sales, costs and profitability between the two regions. Your approach is to extract monthly sales, variable costs, and fixed costs for each region for 2019, 2020 and 2021. You create a dashboard with the following data visualizations: 1. 2. 3. 4. 5. Profitability By Region - This is a clustered bar chart showing total profitability by year and region. Sales By Region - This is a clustered bar chart showing total sales by year and region. Profitability Trends - This is a line chart showing monthly profitability. Each region is represented by its own line. Fixed Cost Trends - This is a line chart showing monthly fixed cost. Each region is represented by its own line. Sales Trends - This is a clustered bar chart showing monthly sales by month and region for 2019, 2020, and 2021. Compare the profitability trends between the regions? O The West has higher profitability compared to the East for all years. Profitability has increased year over year for both regions. O The West has lower profitability compared to the East for all years. For both regions, profitability is variable throughout the year. O The West has higher profitability compared to the East for all years. For both regions, profitability is higher at the beginning and at the end of each year. O The West has lower profitability compared to the East for all years. The profitability trends are similar in 2019 and 2021, but in 2020 the profitability trend is more varied. A Region East East Fart East Fart East Fam East Fam East Com East H East E East Fam East Fam East Fam East Fam East Fam East Fam East Fam East Com East Fam East Com East Fam East C East C East Fam East Fam East Com East Fart East Fart East pavas East Leaves East Loves East peces East paes East peces East Leaves East Leaves East wwws East wwws West Brea West perces West peces West perces West perces West perces West perces West perces West perces West perces West perces West perces West peces West perces West West West West www West www. West www. West www. West www. West www. West www. West www. West www. West www. West www. West www. West www. West www West www West wwwk West West West West Date B Sales 1/1/19 $ 2/1/19 $ 3/1/19 $ $ Anno 4/1/19 chho 5/1/19 $ chho 6/1/19 $ 7/1/19 $ P 8/1/19 $ 9/1/19 $ $ 104.40 10/1/19 114/06 11/1/19 12/40 12/1/19 $ $ 1/1/20 $ Suba 2/1/20 $ Suba 3/1/20 $ Alho A 4/1/20 $ ba 5/1/20 $ chho 6/1/20 $ 7/1/20 $ albo 8/1/20 $ of bo 9/1/20 $ 104.00 10/1/20 $ 11/1/20 $ 134.00 12/1/20 $ ahh 1/1/21 $ 2/1/21 $ 3/1/21 $ Y 4/1/21 $ chi 5/1/21 $ cha 6/1/21 $ akba 7/1/21 $ Haw 8/1/21 $ ob 9/1/21 $ sokba 10/1/21 $ www 11/1/21 $ *** 12/1/21 $ 1/1/19 $ 2/1/19 $ DIY 3/1/19 $ 4/1/19 $ 5/1/19 $ 6/1/19 $ ahho 7/1/19 $ were 8/1/19 $ 9/1/19 $ 10/1/19 $ 11/1/19 $ 12/1/19 $ 1/1/20 $ 2/1/20 $ 3/1/20 $ 4/1/20 $ 5/1/20 $ 6/1/20 $ 3/4 7/1/20 $ 24.00 8/1/20 $ 04.50 9/1/20 $ 104.00 10/1/20 $ 11/be 11/1/20 $ ----- 12/1/20 $ 1/1/21 $ 2/1/21 $ 3/1/21 $ 4/1/21 $ wa 5/1/21 $ MA 6/1/21 $ C D Variable Cost 925,747 $ 1,729,062 $ 655,396 $ A 764,357 $ A 500 799 508,799 $ 443.003 A 442,983 $ FAC.000 A 546,990 $ 505229 A 506,228 $ www.c A 621,832 $ ****.*** A 1,105,555 $ 4240 241 1,249,711 Feder 1,482,891 $ A 420470 428,178 A $ A $ 595,917 $ 550.000 A 568,996 $ ... A 1,519,767 $ A 408,823 $ 470607 A 479,587 $ A Cor 113 685,112 $ A F43.CO 513,696 $ A 621,614 $ 602 996 A 693,886 $ 2016052 A 2,019,942 $ 420 303 A 1,439,383 $ 220 CCA 2,328,664 $ 502.050 692,950 $ 567,295 $ ****** 577,393 $ Berper 91,822 $ www X 59,995 $ wwwww 1411,689 $ + 902,816 $ ****** 836,320 $ ******* 2,480,944 $ www. 2,576,771 $ **** 1,637432 $ Spearhee 940,597 $ 1063340 1,943,249 $ ****** 691,547 $ + ****** 557,981 $ perpet 381,600 $ ****** 410,243 333333 332,237 $ Y $ + ***.*** 379,671 $ Beware + 497 465 $ ***** 937,284 $ www. 1,764,444 $ ******* 1,112,168 $ ******* 681,600 $ 446,938 $ www 426,747 $ 426,747 $ 298,441 $ 513.924 A 513,834 $ F13024 A 513,834 $ ***.*** A 385,272 $ A $ 407.201 497,291 www 497465 $ A 1963,021 * 1,862,931 $ * 2,095,954 $ 1.001.045 1,881,043 $ HOM 719,712 $ A 453026 453,836 $ **** 221,914 *** 497,291 $ + F43024 A 513,834 $ A $ 1030533 ^ 7/1/21 $ 1,030,533 $ 8/1/21 $ 9/1/21 $ 10/1/21 $ 11/1/21 $ 12/1/21 $ GEODES 659,056 $ 669,056 $ 1,764,444 $ 1,881,043 $ 1,030,533 $ E Fixed Costs 546,398 $ 1,296,358 $ 450,964 $ A 453,903 $ 420916 439,816 $ 221.990 d 231,880 $ 242444 315411 $ A 300 300 A 288,208 $ * 403377 493,277 $ A DCC FOC 866,586 $ SEE FAR 755,535 $ A 244 245 844,246 $ 175 65 A A 175,654 $ 304363 294,242 $ www. 414,212 $ A 1,147,582 $ ACCES A 366,953 $ A ****** 314,687 $ A 362.030 367,029 $ d 290 159 290,159 $ 284,325 $ A 400 540 409,549 $ ****** 1,630,405 $ 040 FFO 849,559 $ A A 1654 220 1,654,229 $ A45 690 446,689 $ 254,675 $ w 285,844 $ ****** 76,264 $ ***** + 29,676 ****** + $ $ * 1,150,265 **** 576,552 ****** + 374,284 www.*** + $ $ 2,018,225 *** 1,978,273 ****** 281,420 ***.*** 299,075 $ + $ + $ + 818,365 ****** $ 355,159 1363633 + 1,362,633 ****** + 306,656 $ $ + $ + $ + $ $ + ****.*** 157,679 ****** + 214,480 $ ***.*** + 195,981 ***.*** 320,630 $ ****** + 513,764 ***.*** + 823,281 www.w + 574,087 $ $ $ ***** 299,075 $ were 200,085 $ 281,664 $ 281,664 $ 227,511 $ 240 590 + 249,580 $ 340500 + A 249,580 $ ****** 197,308 $ 200 184,811 $ 230.620 A A 320,630 $ A 5035 240 1,075,249 $ A 1210 1,319,763 + 1.336.630 1,226,529 ****** 303,749 $ ACE FRO 165,539 $ 120.700 120,799 $ ****** 184,811 $ * * A ***.*** A 249,580 $ $ A $ MANAGE 713,165 $ * 257 462 357,463 $ 243,284 $ 823,281 $ 1,226,529 $ 713,165 $ 21,378 24,228 23,306 26 129 26,128 25 170 25,178 30.300 28,389 25 170 25,178 22.30 23,278 MAZO 21,278 23.370 23,278 ***** 23,478 **.*** 23,278 ww 21,522 33633 22,522 35 503 25,503 ***** 27,703 26.603 26,603 30.003 28,803 34503 24,503 DACOS 24,503 24335 24,325 24.502 24,503 20150 20,159 10.003 18,883 20.634 20,674 21.550 21,560 20,660 wwwww 25,728 ***** 25,728 ***** 28,956 ***** 30,338 ***** 25,728 ***** 20,660 ***** 21,528 ***** 20,660 **.*** 23,671 **** 21,805 ***** 26,205 ***** 25,940 ***** 29,080 ***** 27489 *** 31,273 ***** 28,280 ***** 26,397 wwwww 25,419 ***** 25,419 ***** 25,419 MON 24,935 ***** 22,831 ***** 24,360 ***** 27,584 30,252 30,168 22.445 32,663 ***** 27,272 ww 26,752 ***** 26,300 ***** 27,012 23663 22,642 23.404 22,484 ***** 22,576 ***** 23,543 22,561 27,560 20.005 28,095 21.620 31,620 22 DI 33,748 200 28,342 22 776 22,776 24,180 22,561 25,849 Download the Excel data file and complete the question below. The Green Roastery is a coffee roastery with east coast and west coast locations. They distribute their roasted beans to coffee houses in their respective regions. You are a cost accountant, and senior management has asked you to compare the sales, costs and profitability between the two regions. Your approach is to extract monthly sales, variable costs, and fixed costs for each region for 2019, 2020 and 2021. You create a dashboard with the following data visualizations: 1. 2. 3. 4. 5. Profitability By Region - This is a clustered bar chart showing total profitability by year and region. Sales By Region - This is a clustered bar chart showing total sales by year and region. Profitability Trends - This is a line chart showing monthly profitability. Each region is represented by its own line. Fixed Cost Trends - This is a line chart showing monthly fixed cost. Each region is represented by its own line. Sales Trends - This is a clustered bar chart showing monthly sales by month and region for 2019, 2020, and 2021. Compare the profitability trends between the regions? O The West has higher profitability compared to the East for all years. Profitability has increased year over year for both regions. O The West has lower profitability compared to the East for all years. For both regions, profitability is variable throughout the year. O The West has higher profitability compared to the East for all years. For both regions, profitability is higher at the beginning and at the end of each year. O The West has lower profitability compared to the East for all years. The profitability trends are similar in 2019 and 2021, but in 2020 the profitability trend is more varied.
Expert Answer:
Answer rating: 100% (QA)
Detailed Explanation To analyze and compare the profitability trends between the East and West regions for The Green Roastery we need to perform a few steps Calculate Monthly Profitability This is the ... View the full answer

Related Book For 

Holt McDougal Larson Geometry
ISBN: 9780547315171
1st Edition
Authors: Ron Larson, Laurie Boswell, Timothy D. Kanold, Lee Stiff
Posted Date:
Students also viewed these accounting questions
-
Arene C has the composition 90.6% carbon and 9.4% hydrogen. Its mass and 1H NMR spectra are shown below. a. b. a. Calculate the empirical formula of C. b. From the mass spectrum, find the molecular...
-
The following additional information is available for the Dr. Ivan and Irene Incisor family from Chapters 1-7. Ivan sold the following securities during the year and received a Form 1099-B that...
-
Katz Hat Shop received a shipment of hats for which it paid the wholesaler $2,970. The price of the hats was $3,000, but Katz was given a $30 cash discount and required to pay freight charges of $50....
-
The American Trucking Association anticipates a shortage of truck drivers in coming years as the number of retirees exceeds the number of new drivers who enter the profession. The number of train...
-
The December 3 1 , 2 0 2 4 , adjusted trial balance for the Blueboy Cheese Corporation is presented below. Account Title Debits Credits Cash $ 2 1 , 0 0 0 Accounts receivable 3 0 0 , 0 0 0 Prepaid...
-
The Tuckers owned an RV that they insured through American Family. On August 26, 2012, their RV was struck by lightning and damaged. The Tuckers reported the damage to American Family. In March 2013,...
-
1. What is the business reason for China Noah's potential currency exposure? Does the company really need to subject itself to substantial exchange rate risk? Is the risk "material" to China Noah? Do...
-
The threshold frequency v0 describes the smallest light frequency capable of ejecting electrons from a metal. Determine the minimum energy E0 of a photon capable of ejecting electrons from a metal...
-
Sunny and Clear, Inc. is a small wholesale distributor of consumer goods. The company generates a gross margin shown in the blue table. The percent of cash sales is shown in the blue table; the...
-
A single unknown reacts with O3/Me2S to give the following three products. What is the structure for the unknown? 1. 03. 2. MeS
-
Do you have experience using an HRIS System (Peoplesoft, Workday, Banner, UKG, etc.) to input, update, review and analyze employee and organizational data. Be sure to identify the job(s) in your...
-
The Field, Brown & Snow are partners and share income and losses equality. The partner decide to liquidate the partnership when their capital balances are as follows: Field, $131,250; Brown,...
-
Write a program that reads two integers from the user then dis- plays their sum, product, difference, quotient and remainder.
-
Given the demand curve, O = 100 - 2P. Find the elasticity of demand if the price increase from $20 to $25 using the arch or midpoint elasticity formula. Between the price change from $20 to $25, will...
-
Norman Company has an opportunity to produce and sell a revolutionary new smoke detector for homes, and the project would expect to last for 6 years. To determine whether this would be a profitable...
-
university. She used her old dish machine for as long as she could, but it is finally beyond repair! So, she has purchased a 5. Mahnoor Gandapur is the general manager of a Pakistani-themed...
-
1) The government decided to reduce taxes on fast-food to increase revenue. The government assumes that fast-food products have a) An inelastic demand b) An elastic demand c) A demand curve that is...
-
Write the theorem that justifies the statement. jik 1. 2 k
-
Assume that the wheelchair ramps described each have a slope of 1/12, which is the maximum slope recommended for a wheelchair ramp. A wheelchair ramp has a 21 foot run. What is its rise? ww
-
In Exercises 21-25, use the property to copy and complete the statement. Addition Property of Equality: If AB = CD, then_? + EF = _?__ + EF.
-
Repeat problem 41 with the specimen of size \(100 \times 100 \times 10 \mathrm{~mm}^{3}\) and the dimensions of the cavity \(104 \times 104 \times 9 \mathrm{~mm}^{3}\). Elastic constants of the...
-
Repeat problem 41 with elastic constants of the plastic as \(E=10 \mathrm{GPa}\) and \(v=0.485\). Problem 42: A rectangular plastic specimen of size \(100 \times 100 \times 10 \mathrm{~mm}^{3}\) is...
-
A rectangular plastic specimen of size \(100 \times 100 \times 10 \mathrm{~mm}^{3}\) is placed in a rectangular metal cavity. The dimensions of the cavity are \(101 \times 101 \times 9...

Study smarter with the SolutionInn App