

A researcher used stepwise regression to create regression models to predict BirthRate (births per 1.000) using...
Fantastic news! We've Found the answer you've been seeking!
Question:
Transcribed Image Text:
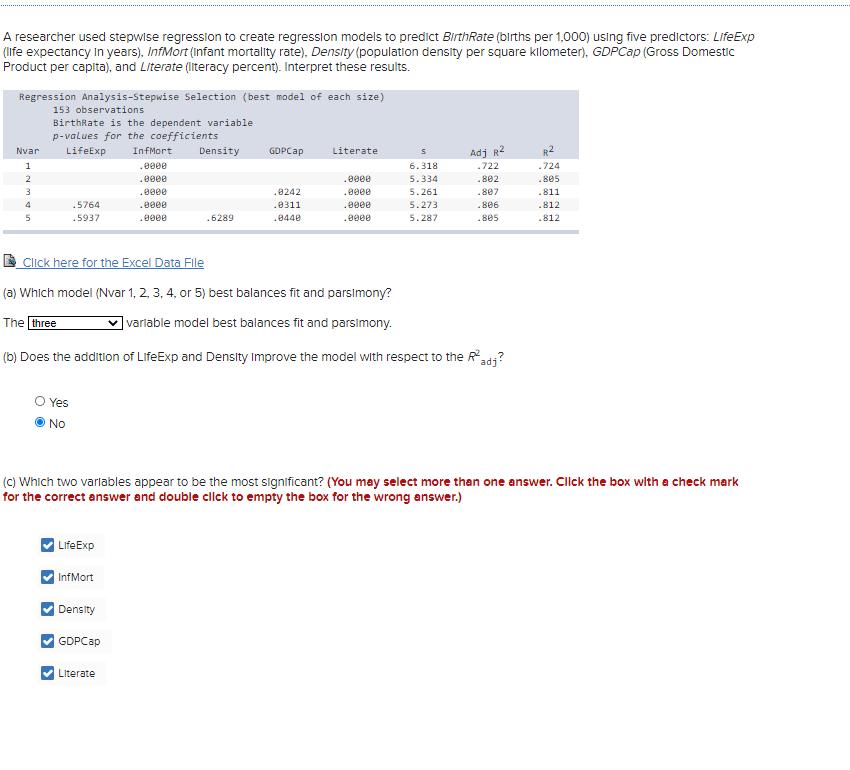
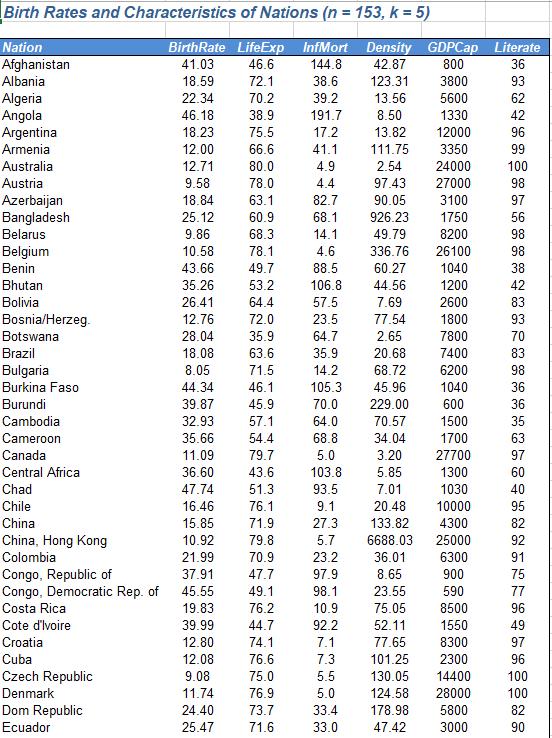
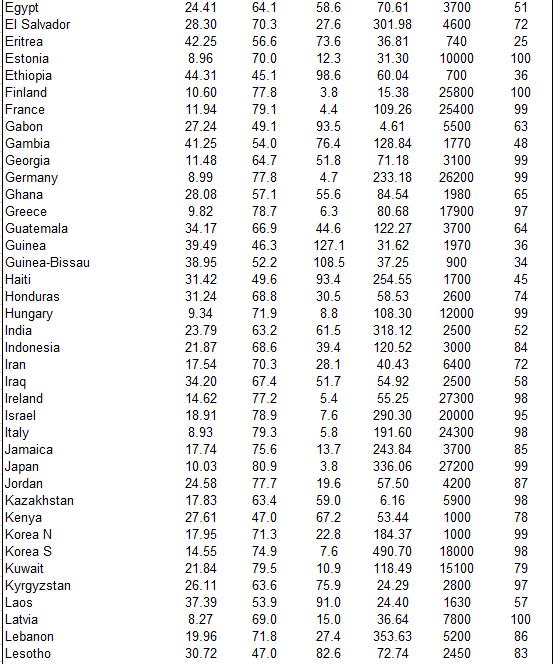
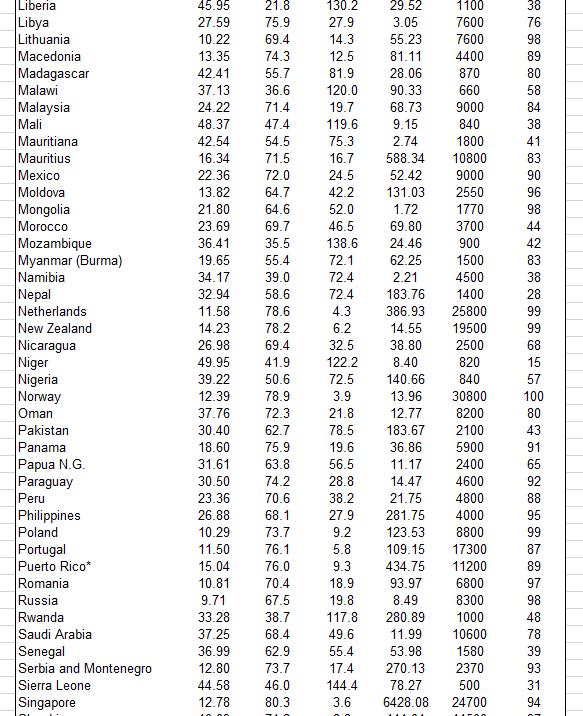
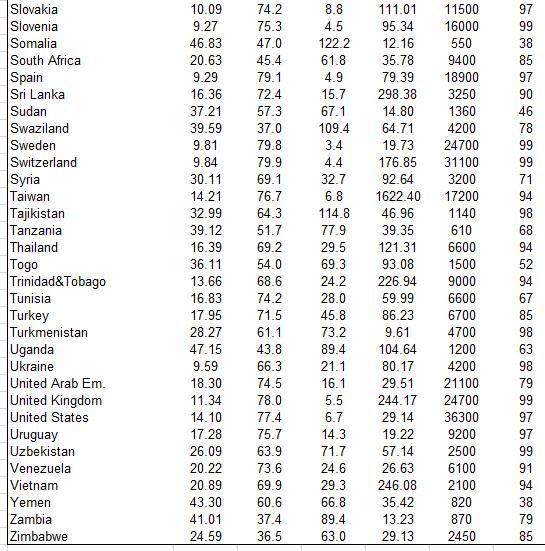
A researcher used stepwise regression to create regression models to predict BirthRate (births per 1.000) using five predictors: LifeExp (life expectancy In years), InfMort (infant mortality rate), Density (population density per square kilometer), GDPCap (Gross Domestic Product per capita), and Literate (literacy percent). Interpret these results. Regression Analysis-Stepwise Selection (best model of each size) 153 observations BirthRate is the dependent variable p-values for the coefficients Nvar LifeExp InfMort Density GDPCap Literate Adj R2 R2 1 .000e 6.318 .722 .724 2 .8000 .0000 5.334 -802 .Be5 .0000 .0242 .0000 5.261 .807 .811 4 .5764 .0311 .0eee 5.273 .812 .5937 .6289 .0440 5.287 .805 .812 Click here for the Excel Data Fle (a) Which model (Nvar 1, 2, 3, 4, or 5) best balances fit and parsimony? The three ]varlable model best balances fit and parsimony. (b) Does the addition of LifeExp and Density Improve the modei with respect to the Radj? O Yes O No (C) Which two varlables appear to be the most significant? (You may select more than one answer. Clck the box with a check mark for the correct answer and double click to empty the box for the wrong answer.) LifeExp InfMort v Density V GDPCap Literate Birth Rates and Characteristics of Nations (n = 153, k = 5) %3D Nation BirthRate LifeExp InfMort Density GDPCap Literate 42.87 123.31 13.56 8.50 Afghanistan 41.03 46.6 144.8 800 36 Albania 18.59 72.1 38.6 3800 93 70.2 Algeria Angola Argentina 22.34 39.2 5600 62 46.18 18.23 38.9 191.7 1330 42 75.5 17.2 13.82 12000 96 Armenia 12.00 66.6 41.1 111.75 3350 99 12.71 9.58 Australia 80.0 4.9 2.54 24000 100 Austria 78.0 4.4 97.43 27000 98 Azerbaijan Bangladesh 18.84 63.1 82.7 90.05 3100 97 25.12 60.9 68.1 926.23 1750 56 9.86 10.58 Belarus 68.3 14.1 49.79 8200 98 Belgium 78.1 4.6 336.76 26100 98 Benin 43.66 49.7 53.2 88.5 60.27 1040 38 Bhutan 35.26 106.8 44.56 1200 42 Bolivia 26.41 64.4 57.5 7.69 2600 83 Bosnia/Herzeg. Botswana 12.76 72.0 23.5 77.54 1800 93 28.04 35.9 64.7 2.65 7800 70 Brazil 18.08 63.6 35.9 20.68 7400 83 8.05 44.34 Bulgaria 71.5 14.2 68.72 6200 98 Burkina Faso 46.1 105.3 45.96 1040 36 Burundi 39.87 45.9 70.0 229.00 600 36 Cambodia 32.93 57.1 64.0 70.57 1500 35 Cameroon 35.66 54.4 68.8 1700 34.04 3.20 63 Canada 11.09 79.7 5.0 27700 97 Central Africa 36.60 43.6 103.8 5.85 1300 60 Chad 47.74 51.3 93.5 7.01 1030 40 Chile 16.46 76.1 9.1 20.48 10000 95 China 15.85 71.9 27.3 133.82 4300 82 China, Hong Kong Colombia 10.92 79.8 5.7 6688.03 25000 92 70.9 47.7 21.99 23.2 36.01 6300 91 Congo, Republic of Congo, Democratic Rep. of 37.91 97.9 8.65 900 75 45.55 49.1 98.1 23.55 590 77 Costa Rica 19.83 76.2 10.9 75.05 8500 96 Cote d'Ivoire 39.99 44.7 92.2 52.11 1550 49 Croatia 12.80 74.1 7.1 77.65 8300 97 12.08 9.08 Cuba 76.6 7.3 101.25 2300 96 Czech Republic 75.0 5.5 130.05 14400 100 Denmark 11.74 76.9 5.0 124.58 28000 100 Dom Republic 24.40 73.7 33.4 178.98 5800 82 Ecuador 25.47 71.6 33.0 47.42 3000 90 58.6 Egypt El Salvador Eritrea 24.41 64.1 70.61 3700 51 28.30 70.3 27.6 301.98 4600 72 42.25 56.6 73.6 36.81 740 25 Estonia 8.96 70.0 12.3 31.30 10000 100 45.1 77.8 Ethiopia 44.31 98.6 60.04 700 36 Finland 10.60 3.8 15.38 25800 100 France 11.94 79.1 4.4 109.26 25400 99 27.24 49.1 4.61 5500 1770 Gabon 93.5 63 Gambia 41.25 54.0 76.4 128.84 48 Georgia Germany 11.48 64.7 51.8 71.18 3100 99 8.99 77.8 4.7 233.18 26200 99 84.54 80.68 Ghana 28.08 57.1 55.6 1980 65 Greece 9.82 78.7 6.3 17900 97 Guatemala 34.17 66.9 44.6 122.27 3700 64 Guinea 39.49 46.3 127.1 31.62 1970 36 Guinea-Bissau 38.95 52.2 108.5 37.25 900 34 Haiti 31.42 49.6 93.4 254.55 1700 45 Honduras 31.24 68.8 30.5 58.53 2600 74 Hungary India 9.34 108.30 71.9 63.2 8.8 12000 99 23.79 61.5 318.12 2500 52 Indonesia 21.87 68.6 39.4 120.52 40.43 3000 84 Iran 17.54 70.3 28.1 6400 72 Iraq Ireland Israel 34.20 67.4 51.7 54.92 2500 58 14.62 77.2 5.4 55.25 27300 98 18.91 78.9 7.6 290.30 20000 95 Italy Jamaica Japan Jordan 8.93 79.3 5.8 191.60 24300 98 17.74 75.6 13.7 243.84 3700 85 10.03 80.9 3.8 336.06 27200 99 24.58 77.7 19.6 57.50 4200 87 Kazakhstan 17.83 63.4 59.0 6.16 5900 98 Kenya Korea N Korea S 27.61 47.0 67.2 53.44 1000 78 17.95 71.3 22.8 184.37 1000 99 14.55 21.84 74.9 7.6 490.70 18000 98 Kuwait 79.5 10.9 118.49 15100 79 Kyrgyzstan 26.11 63.6 75.9 24.29 2800 97 Laos 37.39 53.9 91.0 24.40 1630 57 Latvia 8.27 69.0 15.0 36.64 7800 100 Lebanon 19.96 71.8 27.4 353.63 5200 86 Lesotho 30.72 47.0 82.6 72.74 2450 83 Liberia 45.95 21.8 130.2 29.52 1100 38 Libya Lithuania 27.59 75.9 27.9 3.05 7600 76 10.22 69.4 14.3 55.23 7600 98 Macedonia 13.35 74.3 12.5 81.11 4400 89 Madagascar 42.41 55.7 81.9 28.06 870 80 37.13 24.22 Malawi 36.6 120.0 90.33 660 58 Malaysia Mali 71.4 19.7 68.73 9000 84 48.37 47.4 119.6 9.15 840 38 Mauritiana 42.54 54.5 75.3 2.74 1800 41 Mauritius 16.34 71.5 16.7 588.34 10800 83 Mexico 22.36 72.0 24.5 52.42 9000 90 Moldova Mongolia 13.82 64.7 42.2 131.03 2550 96 52.0 46.5 21.80 64.6 1.72 1770 98 Morocco 23.69 69.7 69.80 3700 44 Mozambique Myanmar (Burma) Namibia 36.41 35.5 138.6 24.46 900 42 1500 62.25 2.21 183.76 19.65 55.4 72.1 83 34.17 39.0 72.4 4500 38 Nepal 32.94 58.6 72.4 1400 28 Netherlands 11.58 78.6 4.3 386.93 25800 99 New Zealand Nicaragua Niger Nigeria Norway 14.23 78.2 69.4 6.2 14.55 19500 99 26.98 32.5 38.80 2500 68 49.95 41.9 122.2 8.40 820 15 39.22 50.6 72.5 140.66 840 57 78.9 72.3 12.39 3.9 13.96 30800 100 Oman 37.76 21.8 12.77 8200 80 Pakistan 30.40 62.7 78.5 183.67 2100 43 Panama 18.60 75.9 19.6 36.86 5900 91 Papua N.G. Paraguay 31.61 63.8 56.5 11.17 2400 65 30.50 74.2 28.8 14.47 4600 92 Peru 23.36 70.6 38.2 21.75 4800 88 27.9 4000 8800 Philippines 26.88 68.1 281.75 95 Poland 10.29 73.7 9.2 123.53 99 11.50 Portugal Puerto Rico* 76.1 5.8 109.15 17300 87 15.04 76.0 9.3 434.75 11200 89 Romania 10.81 70.4 18.9 93.97 6800 97 Russia 9.71 67.5 19.8 8.49 8300 98 Rwanda Saudi Arabia Senegal Serbia and Montenegro Sierra Leone Singapore 33.28 37.25 38.7 117.8 280.89 1000 48 68.4 49.6 11.99 10600 78 36.99 62.9 55.4 53.98 1580 39 12.80 73.7 17.4 270.13 2370 93 44.58 46.0 144.4 78.27 500 31 12.78 80.3 3.6 6428.08 24700 94 Slovakia 10.09 74.2 8.8 111.01 11500 97 Slovenia 9.27 75.3 4.5 95.34 16000 99 Somalia 46.83 47.0 122.2 12.16 550 38 South Africa Spain Sri Lanka 20.63 45.4 61.8 35.78 9400 85 9.29 79.1 4.9 79.39 18900 97 16.36 72.4 15.7 298.38 3250 90 Sudan 37.21 57.3 67.1 14.80 1360 46 109.4 4200 24700 Swaziland 39.59 37.0 64.71 78 Sweden 9.81 79.8 3.4 19.73 99 Switzerland 9.84 79.9 4.4 176.85 31100 3200 99 Syria Taiwan Tajikistan Tanzania 30.11 69.1 32.7 92.64 1622.40 71 14.21 17200 1140 76.7 6.8 94 32.99 64.3 114.8 46.96 98 39.12 51.7 77.9 39.35 610 68 Thailand 16.39 69.2 29.5 121.31 6600 94 Togo Trinidad&Tobago 54.0 68.6 36.11 69.3 93.08 1500 52 13.66 24.2 226.94 9000 94 Tunisia 16.83 74.2 28.0 59.99 6600 67 Turkey Turkmenistan Uganda 17.95 71.5 45.8 86.23 6700 85 28.27 61.1 73.2 9.61 4700 98 47.15 43.8 89.4 104.64 1200 63 Ukraine 9.59 66.3 21.1 80.17 4200 98 United Arab Em. United Kingdom United States Uruguay 18.30 74.5 16.1 29.51 21100 79 11.34 78.0 5.5 244.17 24700 99 14.10 77.4 6.7 29.14 36300 97 17.28 14.3 71.7 75.7 19.22 9200 97 Uzbekistan 26.09 63.9 57.14 2500 99 Venezuela Vietnam Yemen Zambia Zimbabwe 20.22 73.6 24.6 26.63 6100 91 20.89 69.9 29.3 246.08 2100 94 43.30 60.6 66.8 35.42 820 38 41.01 37.4 89.4 13.23 870 79 24.59 36.5 63.0 29.13 2450 85 A researcher used stepwise regression to create regression models to predict BirthRate (births per 1.000) using five predictors: LifeExp (life expectancy In years), InfMort (infant mortality rate), Density (population density per square kilometer), GDPCap (Gross Domestic Product per capita), and Literate (literacy percent). Interpret these results. Regression Analysis-Stepwise Selection (best model of each size) 153 observations BirthRate is the dependent variable p-values for the coefficients Nvar LifeExp InfMort Density GDPCap Literate Adj R2 R2 1 .000e 6.318 .722 .724 2 .8000 .0000 5.334 -802 .Be5 .0000 .0242 .0000 5.261 .807 .811 4 .5764 .0311 .0eee 5.273 .812 .5937 .6289 .0440 5.287 .805 .812 Click here for the Excel Data Fle (a) Which model (Nvar 1, 2, 3, 4, or 5) best balances fit and parsimony? The three ]varlable model best balances fit and parsimony. (b) Does the addition of LifeExp and Density Improve the modei with respect to the Radj? O Yes O No (C) Which two varlables appear to be the most significant? (You may select more than one answer. Clck the box with a check mark for the correct answer and double click to empty the box for the wrong answer.) LifeExp InfMort v Density V GDPCap Literate Birth Rates and Characteristics of Nations (n = 153, k = 5) %3D Nation BirthRate LifeExp InfMort Density GDPCap Literate 42.87 123.31 13.56 8.50 Afghanistan 41.03 46.6 144.8 800 36 Albania 18.59 72.1 38.6 3800 93 70.2 Algeria Angola Argentina 22.34 39.2 5600 62 46.18 18.23 38.9 191.7 1330 42 75.5 17.2 13.82 12000 96 Armenia 12.00 66.6 41.1 111.75 3350 99 12.71 9.58 Australia 80.0 4.9 2.54 24000 100 Austria 78.0 4.4 97.43 27000 98 Azerbaijan Bangladesh 18.84 63.1 82.7 90.05 3100 97 25.12 60.9 68.1 926.23 1750 56 9.86 10.58 Belarus 68.3 14.1 49.79 8200 98 Belgium 78.1 4.6 336.76 26100 98 Benin 43.66 49.7 53.2 88.5 60.27 1040 38 Bhutan 35.26 106.8 44.56 1200 42 Bolivia 26.41 64.4 57.5 7.69 2600 83 Bosnia/Herzeg. Botswana 12.76 72.0 23.5 77.54 1800 93 28.04 35.9 64.7 2.65 7800 70 Brazil 18.08 63.6 35.9 20.68 7400 83 8.05 44.34 Bulgaria 71.5 14.2 68.72 6200 98 Burkina Faso 46.1 105.3 45.96 1040 36 Burundi 39.87 45.9 70.0 229.00 600 36 Cambodia 32.93 57.1 64.0 70.57 1500 35 Cameroon 35.66 54.4 68.8 1700 34.04 3.20 63 Canada 11.09 79.7 5.0 27700 97 Central Africa 36.60 43.6 103.8 5.85 1300 60 Chad 47.74 51.3 93.5 7.01 1030 40 Chile 16.46 76.1 9.1 20.48 10000 95 China 15.85 71.9 27.3 133.82 4300 82 China, Hong Kong Colombia 10.92 79.8 5.7 6688.03 25000 92 70.9 47.7 21.99 23.2 36.01 6300 91 Congo, Republic of Congo, Democratic Rep. of 37.91 97.9 8.65 900 75 45.55 49.1 98.1 23.55 590 77 Costa Rica 19.83 76.2 10.9 75.05 8500 96 Cote d'Ivoire 39.99 44.7 92.2 52.11 1550 49 Croatia 12.80 74.1 7.1 77.65 8300 97 12.08 9.08 Cuba 76.6 7.3 101.25 2300 96 Czech Republic 75.0 5.5 130.05 14400 100 Denmark 11.74 76.9 5.0 124.58 28000 100 Dom Republic 24.40 73.7 33.4 178.98 5800 82 Ecuador 25.47 71.6 33.0 47.42 3000 90 58.6 Egypt El Salvador Eritrea 24.41 64.1 70.61 3700 51 28.30 70.3 27.6 301.98 4600 72 42.25 56.6 73.6 36.81 740 25 Estonia 8.96 70.0 12.3 31.30 10000 100 45.1 77.8 Ethiopia 44.31 98.6 60.04 700 36 Finland 10.60 3.8 15.38 25800 100 France 11.94 79.1 4.4 109.26 25400 99 27.24 49.1 4.61 5500 1770 Gabon 93.5 63 Gambia 41.25 54.0 76.4 128.84 48 Georgia Germany 11.48 64.7 51.8 71.18 3100 99 8.99 77.8 4.7 233.18 26200 99 84.54 80.68 Ghana 28.08 57.1 55.6 1980 65 Greece 9.82 78.7 6.3 17900 97 Guatemala 34.17 66.9 44.6 122.27 3700 64 Guinea 39.49 46.3 127.1 31.62 1970 36 Guinea-Bissau 38.95 52.2 108.5 37.25 900 34 Haiti 31.42 49.6 93.4 254.55 1700 45 Honduras 31.24 68.8 30.5 58.53 2600 74 Hungary India 9.34 108.30 71.9 63.2 8.8 12000 99 23.79 61.5 318.12 2500 52 Indonesia 21.87 68.6 39.4 120.52 40.43 3000 84 Iran 17.54 70.3 28.1 6400 72 Iraq Ireland Israel 34.20 67.4 51.7 54.92 2500 58 14.62 77.2 5.4 55.25 27300 98 18.91 78.9 7.6 290.30 20000 95 Italy Jamaica Japan Jordan 8.93 79.3 5.8 191.60 24300 98 17.74 75.6 13.7 243.84 3700 85 10.03 80.9 3.8 336.06 27200 99 24.58 77.7 19.6 57.50 4200 87 Kazakhstan 17.83 63.4 59.0 6.16 5900 98 Kenya Korea N Korea S 27.61 47.0 67.2 53.44 1000 78 17.95 71.3 22.8 184.37 1000 99 14.55 21.84 74.9 7.6 490.70 18000 98 Kuwait 79.5 10.9 118.49 15100 79 Kyrgyzstan 26.11 63.6 75.9 24.29 2800 97 Laos 37.39 53.9 91.0 24.40 1630 57 Latvia 8.27 69.0 15.0 36.64 7800 100 Lebanon 19.96 71.8 27.4 353.63 5200 86 Lesotho 30.72 47.0 82.6 72.74 2450 83 Liberia 45.95 21.8 130.2 29.52 1100 38 Libya Lithuania 27.59 75.9 27.9 3.05 7600 76 10.22 69.4 14.3 55.23 7600 98 Macedonia 13.35 74.3 12.5 81.11 4400 89 Madagascar 42.41 55.7 81.9 28.06 870 80 37.13 24.22 Malawi 36.6 120.0 90.33 660 58 Malaysia Mali 71.4 19.7 68.73 9000 84 48.37 47.4 119.6 9.15 840 38 Mauritiana 42.54 54.5 75.3 2.74 1800 41 Mauritius 16.34 71.5 16.7 588.34 10800 83 Mexico 22.36 72.0 24.5 52.42 9000 90 Moldova Mongolia 13.82 64.7 42.2 131.03 2550 96 52.0 46.5 21.80 64.6 1.72 1770 98 Morocco 23.69 69.7 69.80 3700 44 Mozambique Myanmar (Burma) Namibia 36.41 35.5 138.6 24.46 900 42 1500 62.25 2.21 183.76 19.65 55.4 72.1 83 34.17 39.0 72.4 4500 38 Nepal 32.94 58.6 72.4 1400 28 Netherlands 11.58 78.6 4.3 386.93 25800 99 New Zealand Nicaragua Niger Nigeria Norway 14.23 78.2 69.4 6.2 14.55 19500 99 26.98 32.5 38.80 2500 68 49.95 41.9 122.2 8.40 820 15 39.22 50.6 72.5 140.66 840 57 78.9 72.3 12.39 3.9 13.96 30800 100 Oman 37.76 21.8 12.77 8200 80 Pakistan 30.40 62.7 78.5 183.67 2100 43 Panama 18.60 75.9 19.6 36.86 5900 91 Papua N.G. Paraguay 31.61 63.8 56.5 11.17 2400 65 30.50 74.2 28.8 14.47 4600 92 Peru 23.36 70.6 38.2 21.75 4800 88 27.9 4000 8800 Philippines 26.88 68.1 281.75 95 Poland 10.29 73.7 9.2 123.53 99 11.50 Portugal Puerto Rico* 76.1 5.8 109.15 17300 87 15.04 76.0 9.3 434.75 11200 89 Romania 10.81 70.4 18.9 93.97 6800 97 Russia 9.71 67.5 19.8 8.49 8300 98 Rwanda Saudi Arabia Senegal Serbia and Montenegro Sierra Leone Singapore 33.28 37.25 38.7 117.8 280.89 1000 48 68.4 49.6 11.99 10600 78 36.99 62.9 55.4 53.98 1580 39 12.80 73.7 17.4 270.13 2370 93 44.58 46.0 144.4 78.27 500 31 12.78 80.3 3.6 6428.08 24700 94 Slovakia 10.09 74.2 8.8 111.01 11500 97 Slovenia 9.27 75.3 4.5 95.34 16000 99 Somalia 46.83 47.0 122.2 12.16 550 38 South Africa Spain Sri Lanka 20.63 45.4 61.8 35.78 9400 85 9.29 79.1 4.9 79.39 18900 97 16.36 72.4 15.7 298.38 3250 90 Sudan 37.21 57.3 67.1 14.80 1360 46 109.4 4200 24700 Swaziland 39.59 37.0 64.71 78 Sweden 9.81 79.8 3.4 19.73 99 Switzerland 9.84 79.9 4.4 176.85 31100 3200 99 Syria Taiwan Tajikistan Tanzania 30.11 69.1 32.7 92.64 1622.40 71 14.21 17200 1140 76.7 6.8 94 32.99 64.3 114.8 46.96 98 39.12 51.7 77.9 39.35 610 68 Thailand 16.39 69.2 29.5 121.31 6600 94 Togo Trinidad&Tobago 54.0 68.6 36.11 69.3 93.08 1500 52 13.66 24.2 226.94 9000 94 Tunisia 16.83 74.2 28.0 59.99 6600 67 Turkey Turkmenistan Uganda 17.95 71.5 45.8 86.23 6700 85 28.27 61.1 73.2 9.61 4700 98 47.15 43.8 89.4 104.64 1200 63 Ukraine 9.59 66.3 21.1 80.17 4200 98 United Arab Em. United Kingdom United States Uruguay 18.30 74.5 16.1 29.51 21100 79 11.34 78.0 5.5 244.17 24700 99 14.10 77.4 6.7 29.14 36300 97 17.28 14.3 71.7 75.7 19.22 9200 97 Uzbekistan 26.09 63.9 57.14 2500 99 Venezuela Vietnam Yemen Zambia Zimbabwe 20.22 73.6 24.6 26.63 6100 91 20.89 69.9 29.3 246.08 2100 94 43.30 60.6 66.8 35.42 820 38 41.01 37.4 89.4 13.23 870 79 24.59 36.5 63.0 29.13 2450 85
Expert Answer:

Related Book For 

Applied Statistics in Business and Economics
ISBN: 978-0073521480
4th edition
Authors: David Doane, Lori Seward
Posted Date:
Students also viewed these mathematics questions
-
A researcher used stepwise regression to create regression models to predict BirthRate (births per 1,000) using five predictors: LifeExp (life expectancy in years), InfMort (infant mortality rate),...
-
A researcher used stepwise regression to create regression models to predict CarTheft (thefts per 1,000) using four predictors: Income (per capita income), Unem (unemployment percent), Pupil/Tea...
-
A researcher used stepwise regression to create regression models to predict BirthRate (births per 1,000) using five predictors: LifeExp (life expectancy in years), InfMort (infant mortality rate),...
-
Modify BST to add a method size() that returns the number of key-value pairs in the symbol table. Use the approach of storing within each Node the number of nodes in the subtree rooted there.
-
Why is the U.S. Supreme Court case Citizens United v. Federal Election Commission controversial?
-
Discuss the different types of HRIS T&D applications and their reporting and decision-support capabilities.
-
Event A: Randomly select a student who studies for more than 5 hours daily. Event B: Randomly select a student who studies for less than 2 hours daily. Determine whether the events are mutually...
-
Reed Paper Co. produces the paper used by wallpaper manufacturers. Reeds four-stage process includes mixing, cooking, rolling, and cutting. During March, the Mixing Department started and completed...
-
Gitano Products operates a job-order costing system and applies overhead cost to jobs on the basis of direct materials used in production (not on the basis of raw materials purchased). Its...
-
A 60-Hz, three-phase, four-pole induction motor delivers full load torque at 3% slip. If the load torque rises by 20% (overload condition), determine the new speed.
-
2 f(x)=x+8x+3. Let a. Find the values of x for which the slope of the curve y = f(x) is 0. b. Find the values of x for which the slope of the curve y = f(x) is - 2. a. The slope of the curve is 0 at...
-
Assume the hosts and routers use classless IPv4 addressing scheme. Routing Table for Router ABC is given below. Mask /28 /26 /24 Any Network Address 200.100.110.112 200.100.110.64 200.100.101.0 Next...
-
Which of the following best explains What is a factory farm? A. A large factory that manufactures industrial farming equipment. B. An industrial-style system of animal agriculture known for its...
-
A passenger on a maglev traveling at a constant velocity of 17m/s from East Lansing to Chicago begins to walk to the back of the maglev with a velocity of 1.5m/s. What is the passenger's relative...
-
Which of the following is true about ISO 14001? A. ISO 14001 completely replaces and ISO 9001 .B. ISO 14001 is an internationally recognized environmental management system standard. C. The overall...
-
Outside our solar system, a planet is discovered orbiting another star. We measure the planet's orbital period to be 340 days and its semi-major axis to be 0.65 AU. What is the total mass of the star...
-
. Q3. Find V (VF) and V x (V x F) if F(x, y, z) = eyz xi + cos(xy- 3z) j + xyz k.
-
r = 0.18 Find the coefficients of determination and non-determination and explain the meaning of each.
-
The weight of a Los Angeles Lakers basketball player averages 233.1 pounds with a standard deviation of 34.95 pounds. To express these measurements in terms a European would understand, we could...
-
Engineers are testing company fleet vehicle fuel economy (miles per gallon) performance by using different types of fuel. One vehicle of each size is tested. Does this sample provide sufficient...
-
Teenagers make up a large percentage of the market for clothing. Below are data on running shoe ownership in four world regions (excluding China). Research question: At = .01, does this sample show...
-
A container of an organic liquid a $25^{\circ} \mathrm{C}$ has a mass of $1100 \mathrm{~kg}$ and a volume of $0.94 \mathrm{~m}^{3}$. Find the liquid's weight, its density, and its specific gravity.
-
What is the pressure one mile $(1.6 \mathrm{~km})$ beneath the ocean's surface?
-
At what pressure will water boil at $65^{\circ} \mathrm{C}$ ? The vapor pressure of water can be determined from the Antoine equation: \[\frac{P(P a)}{1 \times...

Study smarter with the SolutionInn App