

A small convenience store chain is interested in modeling the weekly sales of a store as...
Fantastic news! We've Found the answer you've been seeking!
Question:
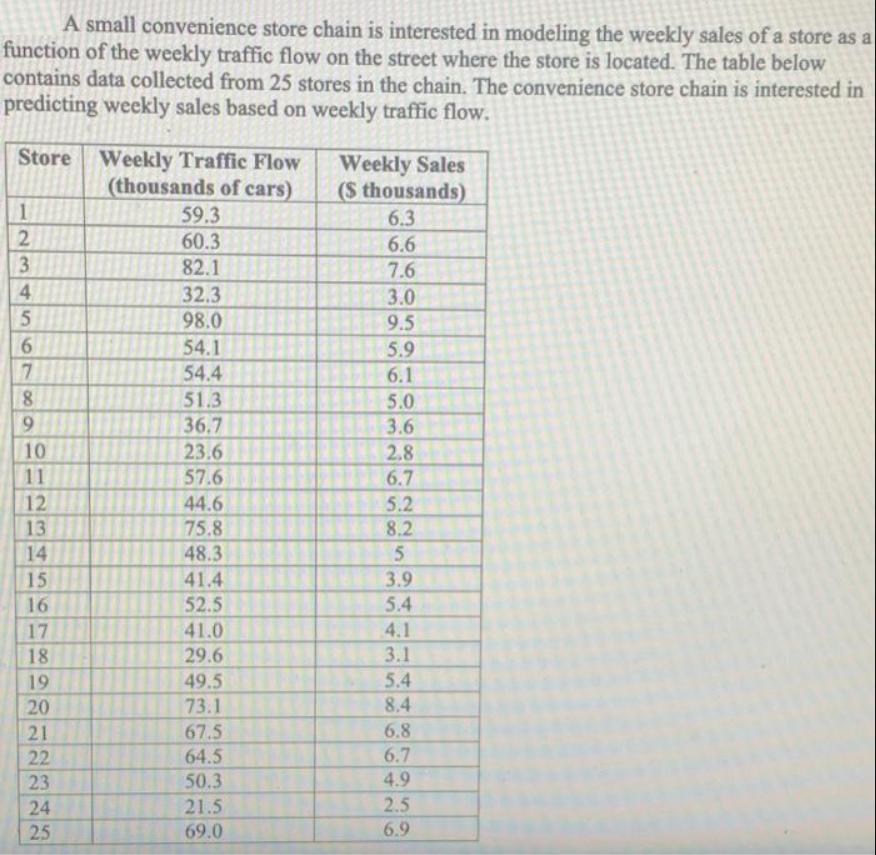
![1) [1 mark] Identify the independent variable (x) and the dependent variable (y). Include the units. HINT: Which variable is](https://dsd5zvtm8ll6.cloudfront.net/si.experts.images/questions/2021/10/617bcd9fae8bd_1635546703099.jpg)
Transcribed Image Text:
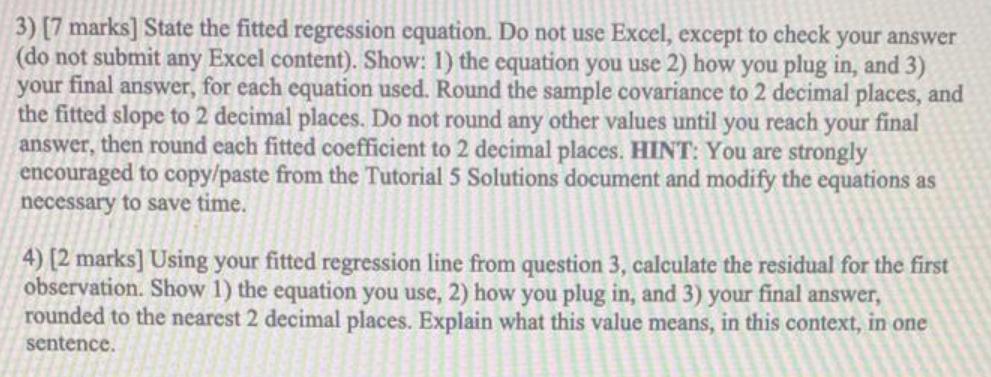
A small convenience store chain is interested in modeling the weekly sales of a store as a function of the weekly traffic flow on the street where the store is located. The table below contains data collected from 25 stores in the chain. The convenience store chain is interested in predicting weekly sales based on weekly traffic flow. Store Weekly Traffic Flow (thousands of cars) 59.3 60.3 Weekly Sales (S thousands) 6.3 6.6 3. 82.1 7.6 4 32.3 98.0 3.0 5. 9.5 6. 54.1 5.9 7 54.4 6.1 8 51.3 36.7 5.0 9. 3.6 10 23.6 2.8 11 57.6 6.7 12 44.6 75.8 5.2 8.2 13 14 48.3 3.9 5.4 15 41.4 16 52.5 41.0 4.1 3.1 17 18 29.6 19 49.5 5.4 20 73.1 8.4 6.8 67.5 64.5 21 22 6.7 23 50.3 4.9 24 21.5 2.5 25 69.0 6.9 1) [1 mark] Identify the independent variable (x) and the dependent variable (y). Include the units. HINT: Which variable is the one we want to predict? Is "the variable we want to predict" the independent or the dependent variable? One of the posted Example Videos will help. 2) [2 marks] Create an appropriate scatterplot using Excel. Label axes appropriately, and a provide an overall title. Save your scatterplot as an image and insert it into your Word file with your assignment answers. Do not submit your Excel file. Hand-drawn graphs will receive a grade of 0. Note ExampleVideo5, the video walkthrough of Example 7 from the Module 5 required reading, will help. 3) [7 marks] State the fitted regression equation. Do not use Excel, except to check your answer (do not submit any Excel content). Show: 1) the equation you use 2) how you plug in, and 3) your final answer, for each equation used. Round the sample covariance to 2 decimal places, and the fitted slope to 2 decimal places. Do not round any other values until you reach your final answer, then round each fitted coefficient to 2 decimal places. HINT: You are strongly encouraged to copy/paste from the Tutorial 5 Solutions document and modify the equations as necessary to save time. 4) [2 marks] Using your fitted regression line from question 3, calculate the residual for the first observation. Show 1) the equation you use, 2) how you plug in, and 3) your final answer, rounded to the nearest 2 decimal places. Explain what this value means, in this context, in one sentence. A small convenience store chain is interested in modeling the weekly sales of a store as a function of the weekly traffic flow on the street where the store is located. The table below contains data collected from 25 stores in the chain. The convenience store chain is interested in predicting weekly sales based on weekly traffic flow. Store Weekly Traffic Flow (thousands of cars) 59.3 60.3 Weekly Sales (S thousands) 6.3 6.6 3. 82.1 7.6 4 32.3 98.0 3.0 5. 9.5 6. 54.1 5.9 7 54.4 6.1 8 51.3 36.7 5.0 9. 3.6 10 23.6 2.8 11 57.6 6.7 12 44.6 75.8 5.2 8.2 13 14 48.3 3.9 5.4 15 41.4 16 52.5 41.0 4.1 3.1 17 18 29.6 19 49.5 5.4 20 73.1 8.4 6.8 67.5 64.5 21 22 6.7 23 50.3 4.9 24 21.5 2.5 25 69.0 6.9 1) [1 mark] Identify the independent variable (x) and the dependent variable (y). Include the units. HINT: Which variable is the one we want to predict? Is "the variable we want to predict" the independent or the dependent variable? One of the posted Example Videos will help. 2) [2 marks] Create an appropriate scatterplot using Excel. Label axes appropriately, and a provide an overall title. Save your scatterplot as an image and insert it into your Word file with your assignment answers. Do not submit your Excel file. Hand-drawn graphs will receive a grade of 0. Note ExampleVideo5, the video walkthrough of Example 7 from the Module 5 required reading, will help. 3) [7 marks] State the fitted regression equation. Do not use Excel, except to check your answer (do not submit any Excel content). Show: 1) the equation you use 2) how you plug in, and 3) your final answer, for each equation used. Round the sample covariance to 2 decimal places, and the fitted slope to 2 decimal places. Do not round any other values until you reach your final answer, then round each fitted coefficient to 2 decimal places. HINT: You are strongly encouraged to copy/paste from the Tutorial 5 Solutions document and modify the equations as necessary to save time. 4) [2 marks] Using your fitted regression line from question 3, calculate the residual for the first observation. Show 1) the equation you use, 2) how you plug in, and 3) your final answer, rounded to the nearest 2 decimal places. Explain what this value means, in this context, in one sentence.
Expert Answer:
Answer rating: 100% (QA)
The response variable is y Weekly sales and the independent v... View the full answer

Posted Date:
Students also viewed these accounting questions
-
A hotel chain is interested in evaluating reservation processes. Guests can reserve a room by using either a telephone system or an online system that is accessed through the hotels web site....
-
A major department store chain is interested in estimating the mean amount its credit card customers spent on their first visit to the chain's new store in the mall. Fifteen credit card accounts were...
-
A major department store chain is interested in estimating the mean amount its credit card customers spent on their first visit to the chain's new store in the mall. Fifteen credit card accounts were...
-
Solve the equation symbolically. Then solve the related inequality. - - x] S | - H =
-
How would the following events (reported this year) affect your forecasts of a firms future net income?
-
Find the average value of f(x) = x2 in x on the interval [1, 3].
-
Use the February information from the Work Together above. An income statement for Wightman Lumber is included in the Working Papers. Work independently to complete this problem. 1, Prepare Wightman...
-
If a firm pays its bills with a 30-day delay, what fraction of its purchases will be paid in the current quarter? In the following quarter? What if the delay is 60 days?
-
Integrated Potato Chips just paid a $ 2 . 9 per share dividend. You expect the dividend to grow steadily at a rate of 5 % per year. a . What is the expected dividend in each of the next 3 years? (...
-
Today is May 17, 2023, and you, CPA, are a Senior Tax Associate at Borden & Laurier LLP. Sylvie Condurache, Tax Manager, has called you into her office to discuss a long-time client: "I just got out...
-
What are federal funds that are distributed through the states for specific programs called? discretionary funds 0000 entitlement funds O general funds local funds A Moving to the next question...
-
Marketers like to conduct surveys to better understand their customer base. How accurate do you think surveys are? Think about a survey ad you saw or a survey you were obligated to take at school,...
-
We are playing special cards, which have the usual four suits (Spades, Hearts, Clubs, and Diamonds) but the ranks can be any positive integer. You have been delivered a hand of n cards, and you have...
-
Question 1 5 Points Pizza Planet is a well-known family pizza restaurant located in the Tri-County Area and has earned its reputation as a fun place for kids with its space-themed design, and its...
-
Would it be reasonable for the Tonor company to use secondary data in their market research, instead of primary data? Provide two reasons for your answer, relating to the definitions of primary and...
-
Suppose you are the root user and you have a shell script file (config.sh). The details of the file are shown below: -rwxrwxrwx 1 root root 0 Nov 9 16:40 config.sh You would like to remove the write...
-
-30 -20 -0 20 30 Use the empirical rule to find the probability corresponding to the shaded region above. Ex: 1.23 %
-
In the operation of an automated production line with storage buffers, what does it mean if a buffer is nearly always empty or nearly always full?
-
The safety and soundness of the financial system relies to a large extent on the action of the central banks. Explain this statement and illustrate the ways in which central banks improve safety and...
-
The CAMELS system is a popular list for regulators. Explain what it is and its importance.
-
The Basel Accords have had a great impact on the banking industry. Describe these and explain their significance to the ordinary person.

Study smarter with the SolutionInn App