

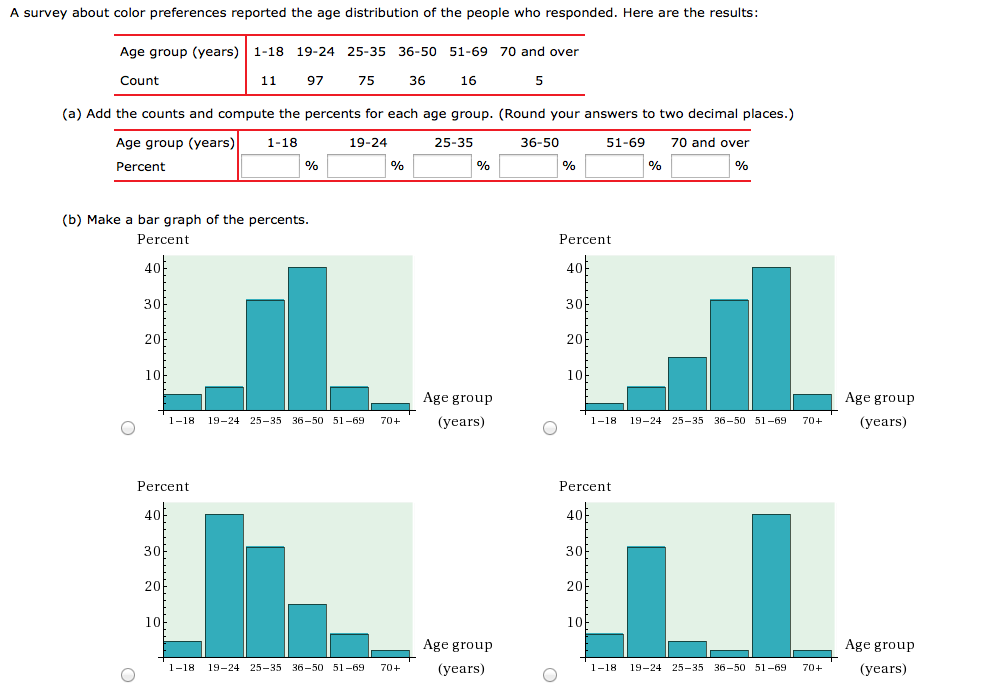
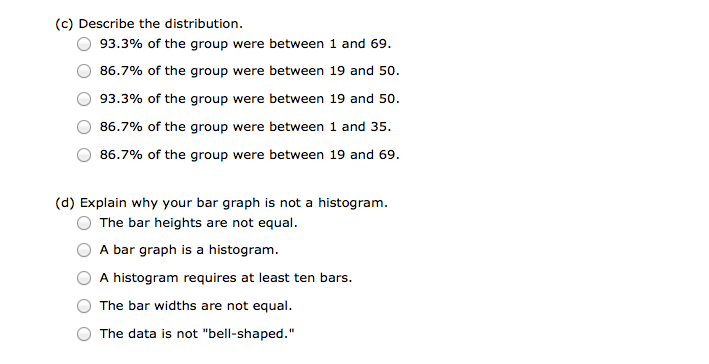
A survey about color preferences reported the age distribution of the people who responded. Here are...
Fantastic news! We've Found the answer you've been seeking!
Question:
Expert Answer:
a The following table shows how to calculate for the percent b So the most appropriate bar g... View the full answer

Related Book For 

Income Tax Fundamentals 2013
ISBN: 9781285586618
31st Edition
Authors: Gerald E. Whittenburg, Martha Altus Buller, Steven L Gill
Posted Date:
