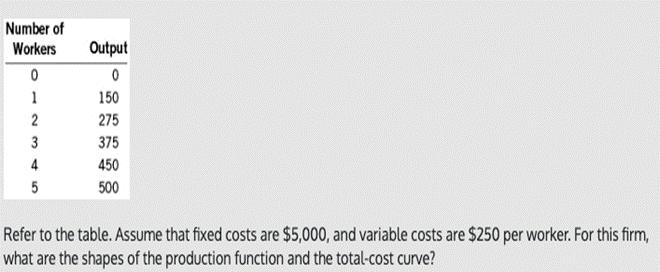
Number of Workers Output 1 150 2 275 3 375 4 450 5 500 Refer to...
Fantastic news! We've Found the answer you've been seeking!
Question:
Transcribed Image Text:
Number of Workers Output 1 150 2 275 3 375 4 450 5 500 Refer to the table. Assume that fixed costs are $5,000, and variable costs are $250 per worker. For this firm, what are the shapes of the production function and the total-cost curve? Cost Figure A Cost Figure B Quantity Quantity Cost Cost Figure C Figure D Quantity Quantity Refer to the Figure. Which of the figures represents the marginal-cost curve for a typical firm? AO Figure B BO Figure C CO Figure A DO Figure D Cost D B A Quantity Refer to the Figure. Which curve is most likely to represent marginal cost? AO Curve C BO Curve A CO Curve D DO Curve B Output 200 180 160 140 120 100 80 60 40 20 0 12 3 45 6 7 8 Workers Refer to the Figure. The graph illustrates the firm's production function. Based on its shape, what does the coresponding total-cost curve look like? AO ahorizontal straight line BO an upward-sloping curve that increases at a constant rate CO an upward-sloping curve that increases at an increasing rate DO an upward-sloping curve that increases at a decreasing rate Number of Workers Output 1 150 2 275 3 375 4 450 5 500 Refer to the table. Assume that fixed costs are $5,000, and variable costs are $250 per worker. For this firm, what are the shapes of the production function and the total-cost curve? Cost Figure A Cost Figure B Quantity Quantity Cost Cost Figure C Figure D Quantity Quantity Refer to the Figure. Which of the figures represents the marginal-cost curve for a typical firm? AO Figure B BO Figure C CO Figure A DO Figure D Cost D B A Quantity Refer to the Figure. Which curve is most likely to represent marginal cost? AO Curve C BO Curve A CO Curve D DO Curve B Output 200 180 160 140 120 100 80 60 40 20 0 12 3 45 6 7 8 Workers Refer to the Figure. The graph illustrates the firm's production function. Based on its shape, what does the coresponding total-cost curve look like? AO ahorizontal straight line BO an upward-sloping curve that increases at a constant rate CO an upward-sloping curve that increases at an increasing rate DO an upward-sloping curve that increases at a decreasing rate Number of Workers Output 1 150 2 275 3 375 4 450 5 500 Refer to the table. Assume that fixed costs are $5,000, and variable costs are $250 per worker. For this firm, what are the shapes of the production function and the total-cost curve? Cost Figure A Cost Figure B Quantity Quantity Cost Cost Figure C Figure D Quantity Quantity Refer to the Figure. Which of the figures represents the marginal-cost curve for a typical firm? AO Figure B BO Figure C CO Figure A DO Figure D Cost D B A Quantity Refer to the Figure. Which curve is most likely to represent marginal cost? AO Curve C BO Curve A CO Curve D DO Curve B Output 200 180 160 140 120 100 80 60 40 20 0 12 3 45 6 7 8 Workers Refer to the Figure. The graph illustrates the firm's production function. Based on its shape, what does the coresponding total-cost curve look like? AO ahorizontal straight line BO an upward-sloping curve that increases at a constant rate CO an upward-sloping curve that increases at an increasing rate DO an upward-sloping curve that increases at a decreasing rate Number of Workers Output 1 150 2 275 3 375 4 450 5 500 Refer to the table. Assume that fixed costs are $5,000, and variable costs are $250 per worker. For this firm, what are the shapes of the production function and the total-cost curve? Cost Figure A Cost Figure B Quantity Quantity Cost Cost Figure C Figure D Quantity Quantity Refer to the Figure. Which of the figures represents the marginal-cost curve for a typical firm? AO Figure B BO Figure C CO Figure A DO Figure D Cost D B A Quantity Refer to the Figure. Which curve is most likely to represent marginal cost? AO Curve C BO Curve A CO Curve D DO Curve B Output 200 180 160 140 120 100 80 60 40 20 0 12 3 45 6 7 8 Workers Refer to the Figure. The graph illustrates the firm's production function. Based on its shape, what does the coresponding total-cost curve look like? AO ahorizontal straight line BO an upward-sloping curve that increases at a constant rate CO an upward-sloping curve that increases at an increasing rate DO an upward-sloping curve that increases at a decreasing rate
Expert Answer:
Answer rating: 100% (QA)
Answer 1 Answer A The production function is increasing at a decreasing rate whereas the totalcost f... View the full answer
Related Book For
Posted Date:
Students also viewed these accounting questions
-
Refer to the table in Problem 3.8. In Problem 3.8, the City Commission of Nashville has decided to build a botanical garden and picnic area in the heart of the city for the recreation of its...
-
Refer to the table given in Exercise 5.109. a. If one person is chosen randomly from the group of 1858 people, what is the probability that the person is conservative? b. If one person is chosen...
-
Refer to the table in Problem 61. (A) How many females are of age 16-19 and earn mini mum wage? (B) How many males are of age 16-24 and earn below minimum wage? (C) How many workers are of age 20-24...
-
When something burns, a. it combines with phlogiston b. it gives off phlogiston c. it combines with oxygen d. it gives off oxygen
-
Tingham Village issued 500 five-year bonds on July 1, 2015. The interest payments are due semiannually (January 1 and July 1) at an annual rate of 6 percent. The effective interest rate on the bonds...
-
You have been asked to calculate the debt ratio for a firm that has the following components to its financing mix: The firm has 1 million shares outstanding, trading at $50 per share. The firm has...
-
Companies can use a variety of sources for data analytics, both internal and external to the company. a. Based on an Internet search, what is the estimated number of companies using external sources...
-
Farr Co. elects to use the percentage-of-sales basis in 2017 to record bad debt expense. It estimates that 2% of net credit sales will become uncollectible. Sales revenues are $800,000 for 2017,...
-
Identifica y explica como las estrategias, la tecnologa y alianzas estratgicas pueden afectar el desarrollo de productos. Cual de las estrategias de desarrollo de productos tiene el mas alto riesgo?
-
Three years ago, the Oak Street TCBY bought a frozen yogurt machine for $8,000. A salesman has just suggested to the TCBY manager that she replace the machine with a new, $12,500 machine. The manager...
-
The nation of Kona cultivates coffee beans and cassava, from which all their consumer goods are produced. ( a ) Calculate the cost of the market basket of goods in the table in 2 0 1 0 and in 2 0 1 5...
-
We notice that you have some experience with SQL Server 2014 DBMS. How would go about creating a SQL Server maintenance job? (provide a summary of the process) What are some of the steps in the...
-
How do modern operating systems leverage advanced CPU scheduling mechanisms such as Multi-Level Feedback Queues (MLFQ) and lottery scheduling to prioritize tasks based on factors like priority,...
-
What is marginal costing and absorption/full costing ? Why is variable costing relevant to decision making ? What is CVP analysis; BE analysis, and how it is related to marginal costing ? What are...
-
Discuss the meaning of "internal control" in the context of accounting.Then share five examples of internal control procedures designed to prevent fraud and accidental accounting errors.
-
Part A What is the difference between a standard and budget? Give an example of both.(5 Marks) Part B Who is usually in the best position to explain why the variances occurred? Explain your answer (5...
-
Competitive advantage of tata group based on global level with explanations and provide reference Organization Location Building capacities and spending money on research and development Marketing...
-
The Cholesterol Level data sets give cholesterol levels of heart attack patients. Cholesterol measures are taken 2, 4, and 14 days aft er a patient has suffered a heart attack. Is there a significant...
-
Draw a fish-bone chart detailing reasons why an airline customer might be dissatisfied.
-
What are the steps in the intuitive lowest-cost method?
-
Develop a flowchart for one of the following: a) Filling up with gasoline at a self-serve station. b) Determining your account balance and making a withdrawal at an ATM. c) Getting a cone of yogurt...
-
Kelley (1992, 1998) outlined types of followers as: A. Sheep, or yes, people. B. Alienated followers. C. Effective, or exemplary, followers. D. All of the above.
-
Gardner (1990) identified the following tasks that leaders perform: A. Representing the group by speaking on its behalf. B. serving as a symbol by acting in ways that convey the values of the group...
-
Warren Bennis asserted that leaders have the following competencies: A. Foster a clear vision with an endowed purpose that is owned by the people involved with the leader. B. Must keep reminding...
Study smarter with the SolutionInn App