

A typical macroeconomy is modelled as follow = = 1 E+1 [E+1] BE+++++ =...
Fantastic news! We've Found the answer you've been seeking!
Question:
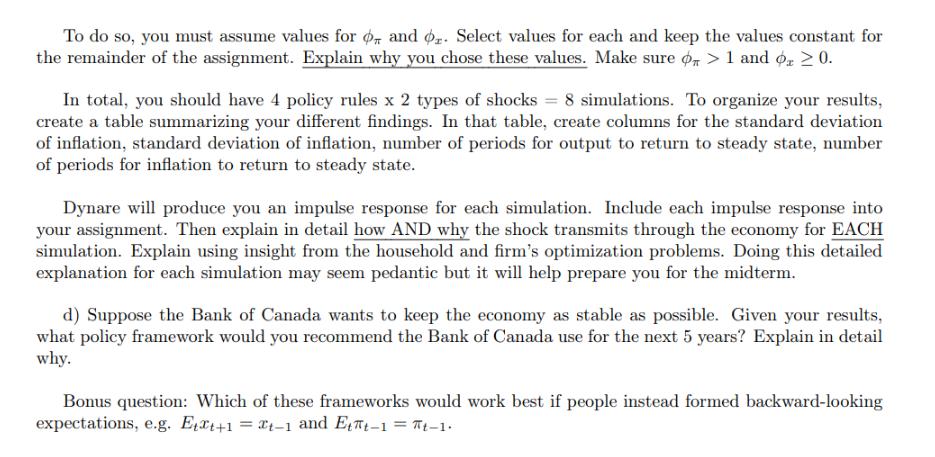
![A typical macroeconomy is modelled as follow It = t it = = 1 - 0 E+1 BEtt+1+KIt ? [it-E+1] Assume o = 1, 3 =](https://dsd5zvtm8ll6.cloudfront.net/questions/2024/01/659fbc7fb7096_1704967176791.jpg)
Transcribed Image Text:
A typical macroeconomy is modelled as follow = = 1 E₁+1 [E₁₁+1] σ BE+++++ Пе = ? Assume σ =1, 3=0.99, w = 0.5, and K = 3 (1-w)(1-wẞ) العا Each period, assume that there are shocks to the economy given by the process u = 0.65-1+ & These could be shocks to aggregate demand (+) or to inflation (+). Finally, assume that agents form rational expectations (ET+1 = +1 and E₁₁+1 = x++1). Suppose the Bank of Canada went through a mandate renewal and could change their policy rule. They have many options: i) Flexible inflation targeting: +==+ + + ii) Average inflation target over a 2 period horizon: i = x+0x₁ where ₁ = (π₁ +π-1)/2 iii) Average inflation target over a 4 period horizon: i=0+, where π = (+++-1)/4 iv) Reacting to lagged inflation and output: i=0-1+0x1-1 Simulate the model for both a positive demand shock and a positive supply shock. In other words, do the simulation first for a one-standard deviation positive demand shock and then again for a one-standard deviation positive inflation shock. To do so, you must assume values for or and or. Select values for each and keep the values constant for the remainder of the assignment. Explain why you chose these values. Make sure o > 1 and or ≥ 0. In total, you should have 4 policy rules x 2 types of shocks = 8 simulations. To organize your results, create a table summarizing your different findings. In that table, create columns for the standard deviation of inflation, standard deviation of inflation, number of periods for output to return to steady state, number of periods for inflation to return to steady state. Dynare will produce you an impulse response for each simulation. Include each impulse response into your assignment. Then explain in detail how AND why the shock transmits through the economy for EACH simulation. Explain using insight from the household and firm's optimization problems. Doing this detailed explanation for each simulation may seem pedantic but it will help prepare you for the midterm. d) Suppose the Bank of Canada wants to keep the economy as stable as possible. Given your results, what policy framework would you recommend the Bank of Canada use for the next 5 years? Explain in detail why. Bonus question: Which of these frameworks would work best if people instead formed backward-looking expectations, e.g. E₁x+1 = -1 and E₁₁-1 = π-1. A typical macroeconomy is modelled as follow = = 1 E₁+1 [E₁₁+1] σ BE+++++ Пе = ? Assume σ =1, 3=0.99, w = 0.5, and K = 3 (1-w)(1-wẞ) العا Each period, assume that there are shocks to the economy given by the process u = 0.65-1+ & These could be shocks to aggregate demand (+) or to inflation (+). Finally, assume that agents form rational expectations (ET+1 = +1 and E₁₁+1 = x++1). Suppose the Bank of Canada went through a mandate renewal and could change their policy rule. They have many options: i) Flexible inflation targeting: +==+ + + ii) Average inflation target over a 2 period horizon: i = x+0x₁ where ₁ = (π₁ +π-1)/2 iii) Average inflation target over a 4 period horizon: i=0+, where π = (+++-1)/4 iv) Reacting to lagged inflation and output: i=0-1+0x1-1 Simulate the model for both a positive demand shock and a positive supply shock. In other words, do the simulation first for a one-standard deviation positive demand shock and then again for a one-standard deviation positive inflation shock. To do so, you must assume values for or and or. Select values for each and keep the values constant for the remainder of the assignment. Explain why you chose these values. Make sure o > 1 and or ≥ 0. In total, you should have 4 policy rules x 2 types of shocks = 8 simulations. To organize your results, create a table summarizing your different findings. In that table, create columns for the standard deviation of inflation, standard deviation of inflation, number of periods for output to return to steady state, number of periods for inflation to return to steady state. Dynare will produce you an impulse response for each simulation. Include each impulse response into your assignment. Then explain in detail how AND why the shock transmits through the economy for EACH simulation. Explain using insight from the household and firm's optimization problems. Doing this detailed explanation for each simulation may seem pedantic but it will help prepare you for the midterm. d) Suppose the Bank of Canada wants to keep the economy as stable as possible. Given your results, what policy framework would you recommend the Bank of Canada use for the next 5 years? Explain in detail why. Bonus question: Which of these frameworks would work best if people instead formed backward-looking expectations, e.g. E₁x+1 = -1 and E₁₁-1 = π-1. A typical macroeconomy is modelled as follow = = 1 E₁+1 [E₁₁+1] σ BE+++++ Пе = ? Assume σ =1, 3=0.99, w = 0.5, and K = 3 (1-w)(1-wẞ) العا Each period, assume that there are shocks to the economy given by the process u = 0.65-1+ & These could be shocks to aggregate demand (+) or to inflation (+). Finally, assume that agents form rational expectations (ET+1 = +1 and E₁₁+1 = x++1). Suppose the Bank of Canada went through a mandate renewal and could change their policy rule. They have many options: i) Flexible inflation targeting: +==+ + + ii) Average inflation target over a 2 period horizon: i = x+0x₁ where ₁ = (π₁ +π-1)/2 iii) Average inflation target over a 4 period horizon: i=0+, where π = (+++-1)/4 iv) Reacting to lagged inflation and output: i=0-1+0x1-1 Simulate the model for both a positive demand shock and a positive supply shock. In other words, do the simulation first for a one-standard deviation positive demand shock and then again for a one-standard deviation positive inflation shock. To do so, you must assume values for or and or. Select values for each and keep the values constant for the remainder of the assignment. Explain why you chose these values. Make sure o > 1 and or ≥ 0. In total, you should have 4 policy rules x 2 types of shocks = 8 simulations. To organize your results, create a table summarizing your different findings. In that table, create columns for the standard deviation of inflation, standard deviation of inflation, number of periods for output to return to steady state, number of periods for inflation to return to steady state. Dynare will produce you an impulse response for each simulation. Include each impulse response into your assignment. Then explain in detail how AND why the shock transmits through the economy for EACH simulation. Explain using insight from the household and firm's optimization problems. Doing this detailed explanation for each simulation may seem pedantic but it will help prepare you for the midterm. d) Suppose the Bank of Canada wants to keep the economy as stable as possible. Given your results, what policy framework would you recommend the Bank of Canada use for the next 5 years? Explain in detail why. Bonus question: Which of these frameworks would work best if people instead formed backward-looking expectations, e.g. E₁x+1 = -1 and E₁₁-1 = π-1. A typical macroeconomy is modelled as follow = = 1 E₁+1 [E₁₁+1] σ BE+++++ Пе = ? Assume σ =1, 3=0.99, w = 0.5, and K = 3 (1-w)(1-wẞ) العا Each period, assume that there are shocks to the economy given by the process u = 0.65-1+ & These could be shocks to aggregate demand (+) or to inflation (+). Finally, assume that agents form rational expectations (ET+1 = +1 and E₁₁+1 = x++1). Suppose the Bank of Canada went through a mandate renewal and could change their policy rule. They have many options: i) Flexible inflation targeting: +==+ + + ii) Average inflation target over a 2 period horizon: i = x+0x₁ where ₁ = (π₁ +π-1)/2 iii) Average inflation target over a 4 period horizon: i=0+, where π = (+++-1)/4 iv) Reacting to lagged inflation and output: i=0-1+0x1-1 Simulate the model for both a positive demand shock and a positive supply shock. In other words, do the simulation first for a one-standard deviation positive demand shock and then again for a one-standard deviation positive inflation shock. To do so, you must assume values for or and or. Select values for each and keep the values constant for the remainder of the assignment. Explain why you chose these values. Make sure o > 1 and or ≥ 0. In total, you should have 4 policy rules x 2 types of shocks = 8 simulations. To organize your results, create a table summarizing your different findings. In that table, create columns for the standard deviation of inflation, standard deviation of inflation, number of periods for output to return to steady state, number of periods for inflation to return to steady state. Dynare will produce you an impulse response for each simulation. Include each impulse response into your assignment. Then explain in detail how AND why the shock transmits through the economy for EACH simulation. Explain using insight from the household and firm's optimization problems. Doing this detailed explanation for each simulation may seem pedantic but it will help prepare you for the midterm. d) Suppose the Bank of Canada wants to keep the economy as stable as possible. Given your results, what policy framework would you recommend the Bank of Canada use for the next 5 years? Explain in detail why. Bonus question: Which of these frameworks would work best if people instead formed backward-looking expectations, e.g. E₁x+1 = -1 and E₁₁-1 = π-1.
Expert Answer:

Related Book For 

Macroeconomics Principles and Applications
ISBN: 978-1111822354
6th edition
Authors: Robert E. Hall, Marc Lieberman
Posted Date:
Students also viewed these general management questions
-
KYC's stock price can go up by 15 percent every year, or down by 10 percent. Both outcomes are equally likely. The risk free rate is 5 percent, and the current stock price of KYC is 100. (a) Price a...
-
Planning is one of the most important management functions in any business. A front office managers first step in planning should involve determine the departments goals. Planning also includes...
-
There is a mathematical puzzle called "Four Fours." In it, you use four 4s to make other whole numbers. Examples: You can make 61 (4+4)+4+4-6 Four Fourths You can also make 9! You Try! What other...
-
a. XYZ Corporation had 158 million shares outstanding on January 1, 2012. On February 2, 2012, it issued an additional 30 million shares to the market at the market price of$55 per share. What was...
-
The cast iron cylinder shown in Figure P525 carries only an axial compressive load of 75 000 lb. (The torque T = 0.) Compute the design factor if it is made from gray cast iron, Grade 40A, having a...
-
Hotbox Ltd produces pizza boxes using two processes cutting and packaging. The production budget for the year ending 30 June 2025 estimated raw materials use of $400 000, factory overhead of $270...
-
1. Using the data in E, prepare a cost of production summary for the month ended January 31, 2016. In E, Chavez Concrete Inc. has two production departments. Blending had 1,000 units in process at...
-
Compute uxxx for u(x, t) 8 sech (2x-t). = (Use symbolic notation and fractions where needed.) Uxxx = 512 tanh (2x-t) sech (2x t) Incorrect
-
Ethan is the leader of a team with N members. He has assigned an error score to each member in his team based on the bugs that he has found in that particular team member's task. Because the error...
-
Consider a water hose situated on the ground with its nozzle angled 60 deg with respect to the leveled surface. A jet of water leaves the nozzle at 1 m/s. You can assume that the flow is inviscid,...
-
Inflation is testing Americans' loyalty to Procter & Gamble Co.'s PG -0.15%decrease; red down pointing triangle biggest brands, but the maker of Tide detergent, Pampers diapers and Gillette razors is...
-
November 2021 (actual) December 2021 (budgeted) January 2022 (budgeted) Cash sales $ 80.000 Credit sales Total sales 240,000 $320,000 $100,000 360,000 $460,000 $ 60,000 180,000 $240,000 Management...
-
an application to do conversion similar to the Convert Temperature presented in this lesson. You can choose what type of conversion your application will perform. It can be any measurement between...
-
#2 Suppose we know that an algorithm has 5 classes of complexity for a problem of size n. The complexities T(n) .. Ts(n) are given below. Regarding probabilities, suppose that p is twice as likely as...
-
The Rolling Department of Kraus Steel Company had 5,300 tons in beginning work in process inventory (20% complete) on October 1. During October, 88,800 tons were completed. The ending work in process...
-
_epitomized the ways in which factories generally operated before the Civil War. Waltham-Lowell System ONaugatuck Valley factory and manufacturing corridor O model factories built in the Chesapeake...
-
Write the binomial probability in words. Then, use a continuity correction to convert the binomial probability to a normal distribution probability. P(x 110)
-
A bond promises to pay its owner $500 one year from now. For the following prices, find the corresponding interest payments and interest rates that the bond offers. As the price of the bond rises,...
-
What would be the effect on real GDP and total employment of each of the following changes? a. As a result of restrictions on imports into the United States, net exports (NX) increase. b. The federal...
-
Draw an aggregate expenditure line and 45-degree line for an imaginary economy that produces only services. Label the axes Real GDP per day and Aggregate expenditure per day. Remember that with...
-
Speeds of bullet trains. Determine whether the data are qualitative or quantitative. Explain your reasoning.
-
Widths of veins in different species of leaves. Determine whether the data are qualitative or quantitative. Explain your reasoning.
-
American Standard Code for Information Interchange (ASCII) codes. Determine whether the data are qualitative or quantitative. Explain your reasoning.

Study smarter with the SolutionInn App