

Create a line graph using excel: a) x axis being the concentration (M) and the y axis
Fantastic news! We've Found the answer you've been seeking!
Question:
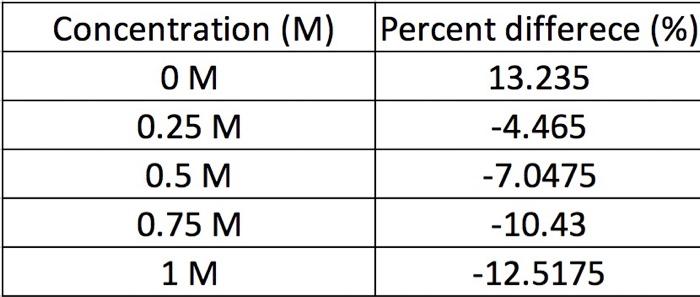
Create a line graph using excel:
a) x axis being the concentration (M) and the y axis labeled percent difference of mass (%) and title of the graph: Estimating the Isomotic Point in Potato Cores.
b) include vertical error bars to the line graph
Expert Answer:

Related Book For 

Posted Date:
