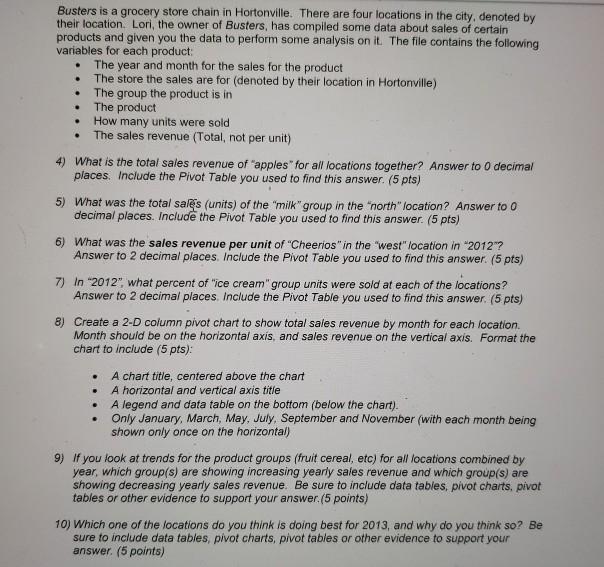
Busters is a grocery store chain in Hortonville. There are four locations in the city, denoted...
Fantastic news! We've Found the answer you've been seeking!
Question:
Transcribed Image Text:
Busters is a grocery store chain in Hortonville. There are four locations in the city, denoted by their location. Lori, the owner of Busters, has compiled some data about sales of certain products and given you the data to perform some analysis on it. The file contains the following variables for each product: The year and month for the sales for the product . The store the sales are for (denoted by their location in Hortonville) The group the product is in The product . How many units were sold . The sales revenue (Total, not per unit) 4) What is the total sales revenue of "apples" for all locations together? Answer to 0 decimal places. Include the Pivot Table you used to find this answer. (5 pts) 5) What was the total sales (units) of the "milk" group in the "north" location? Answer to 0 decimal places. Include the Pivot Table you used to find this answer. (5 pts) 6) What was the sales revenue per unit of "Cheerios" in the "west" location in "2012"? Answer to 2 decimal places. Include the Pivot Table you used to find this answer. (5 pts) 7) In "2012", what percent of "ice cream" group units were sold at each of the locations? Answer to 2 decimal places. Include the Pivot Table you used to find this answer. (5 pts) 8) Create a 2-D column pivot chart to show total sales revenue by month for each location. Month should be on the horizontal axis, and sales revenue on the vertical axis. Format the chart to include (5 pts): A chart title, centered above the chart . A horizontal and vertical axis title . A legend and data table on the bottom (below the chart). . Only January, March, May, July, September and November (with each month being shown only once on the horizontal) 9) If you look at trends for the product groups (fruit cereal, etc) for all locations combined by year, which group(s) are showing increasing yearly sales revenue and which group(s) are showing decreasing yearly sales revenue. Be sure to include data tables, pivot charts, pivot tables or other evidence to support your answer. (5 points) 10) Which one of the locations do you think is doing best for 2013, and why do you think so? Be sure to include data tables, pivot charts, pivot tables or other evidence to support your answer. (5 points) Busters is a grocery store chain in Hortonville. There are four locations in the city, denoted by their location. Lori, the owner of Busters, has compiled some data about sales of certain products and given you the data to perform some analysis on it. The file contains the following variables for each product: The year and month for the sales for the product . The store the sales are for (denoted by their location in Hortonville) The group the product is in The product . How many units were sold . The sales revenue (Total, not per unit) 4) What is the total sales revenue of "apples" for all locations together? Answer to 0 decimal places. Include the Pivot Table you used to find this answer. (5 pts) 5) What was the total sales (units) of the "milk" group in the "north" location? Answer to 0 decimal places. Include the Pivot Table you used to find this answer. (5 pts) 6) What was the sales revenue per unit of "Cheerios" in the "west" location in "2012"? Answer to 2 decimal places. Include the Pivot Table you used to find this answer. (5 pts) 7) In "2012", what percent of "ice cream" group units were sold at each of the locations? Answer to 2 decimal places. Include the Pivot Table you used to find this answer. (5 pts) 8) Create a 2-D column pivot chart to show total sales revenue by month for each location. Month should be on the horizontal axis, and sales revenue on the vertical axis. Format the chart to include (5 pts): A chart title, centered above the chart . A horizontal and vertical axis title . A legend and data table on the bottom (below the chart). . Only January, March, May, July, September and November (with each month being shown only once on the horizontal) 9) If you look at trends for the product groups (fruit cereal, etc) for all locations combined by year, which group(s) are showing increasing yearly sales revenue and which group(s) are showing decreasing yearly sales revenue. Be sure to include data tables, pivot charts, pivot tables or other evidence to support your answer. (5 points) 10) Which one of the locations do you think is doing best for 2013, and why do you think so? Be sure to include data tables, pivot charts, pivot tables or other evidence to support your answer. (5 points)
Expert Answer:
Answer rating: 100% (QA)
ONLY GUIDANCE FOR FIRST 4 SUB PARTS PROVIDED HERE NOTE For instruction guidance have taken a sample ... View the full answer
Related Book For
Elementary Statistics A step by step approach
ISBN: 978-0073386102
8th edition
Authors: Allan Bluman
Posted Date:
Students also viewed these mathematics questions
-
A grocery store chain is trying to decide how much shelf space to devote to organic produce. If they don't stock enough, their more upscale customers will shop at the competing grocery store. If they...
-
A grocery store chain has decided to help customers save money by instituting temporary repricing to help cut costs. Nine products from the sale flyer are featured below with their regular price and...
-
Three Bags Full is a small grocery store chain in the Lehigh Valley. The company is trying to decide whether to include a bakery section in its stores. You have been asked to run the numbers using...
-
Below is list of ethical principles that a business might follow. Think of a situation where following each might not necessarily be the right thing. a. Follow contracts to the letter. b. Never...
-
The oven shown in Figure has a heating element with appreciable capacitance C1. The other capacitance is that of the oven air C. The corresponding temperatures are T1 and T2, and the outside...
-
What is the meaning of a colonial legacy? Discuss any disadvantages and possible advantages.
-
Between z = 1.96 and z = 1.96 Find the indicated area under the standard normal curve. If convenient, use technology to find the area.
-
You are auditing a bank, and someone provides you with an anonymous tip that an employee is embezzling money from the bank. You decide to investigate the allegation. Your interviews with other bank...
-
Throughout the course, have learned about various concepts in international finance. This assignment provides an opportunity for you to apply those concepts and reflect on important topics in...
-
The General Social Survey has asked subjects, How long have you lived in the city, town, or community where you live now? The responses of 1415 subjects in one survey had a mode of less than 1 year,...
-
Fill in the blanks with the correct terms from the word pool. Write your answer on your Math notebook. Monomial Literal Coefficient Numerical Coefficient Variable Algebraic Expressions Terms...
-
Design an interactive product management system using Python function. In the stock.txt file, there are product names and their corresponding stock numbers. coke, 10 juice, 5 milk, 13 Import the...
-
Compute the value of the function y = xe-x cos (2x) when x = 10. 2. MATRICES (a) Construct a matrix A, where A = 1 3 5 7) 10 8 6 4 2 4 68 3 5 7 9, (b) Construct matrix Bfrom A, where Btakes only the...
-
5. You want to speculate in the forward market by either buying or selling 1,000,000. Suppose that the one-year forward rate is $1.10/, and the current spot rate is $1.30/. You expect the future spot...
-
Need a explanation for doing each in depth and the concepts as well. https://cs6035.s3.amazonaws.com/MITM/mitm_spring2024.pcap Your second task will require you to recover a payload from the...
-
Maria has a bad eyesight and has to wear glasses ( minus ) 2 D . She tried to swim underwater wearing the glasses but the vision is not clear. She wiil buy underwater glasses. Compute the optical...
-
Championship Corporation's three divisions had the following operating data during 20X1. Jordan Pippen Rodman Total assets $450,000 $320,000 $220,000 Variable costs 90,000 135,000 50,000 Revenue...
-
Catherine (aged 42) and Johnson (aged 45) have been married for 12 years. Johnson is a project manager of an event company at a monthly salary of $55,000 with an additional one-month salary of...
-
The number of students who belong to the dance company at each of several randomly selected small universities is shown below. Estimate the true population mean size of a university dance company...
-
What is the difference between a point estimate and an interval estimate of a parameter? Which is better? Why?
-
Students in a statistics class were asked to report the number of hours they slept on weeknights and on weekends. At = 0.05, is there sufficient evidence that there is a difference in the mean...
-
A plane layer of coal of thickness \(L=1 \mathrm{~m}\) experiences uniform volumetric generation at a rate of \(\dot{q}=10 \mathrm{~W} / \mathrm{m}^{3}\) due to slow oxidation of the coal particles....
-
The steady-state temperature distribution in a onedimensional wall of thermal conductivity \(k\) and thickness \(L\) is of the form \(T=a x^{2}+b x+c\). Derive expressions for the heat fluxes at the...
-
One-dimensional, steady-state conduction with no energy generation is occurring in a plane wall of constant thermal conductivity. (a) Is the prescribed temperature distribution possible? Briefly...
Study smarter with the SolutionInn App