

Consolidated Statement of Shareholders' Equity In millions, except per share data ............. Balance at December 31,...
Fantastic news! We've Found the answer you've been seeking!
Question:
Transcribed Image Text:
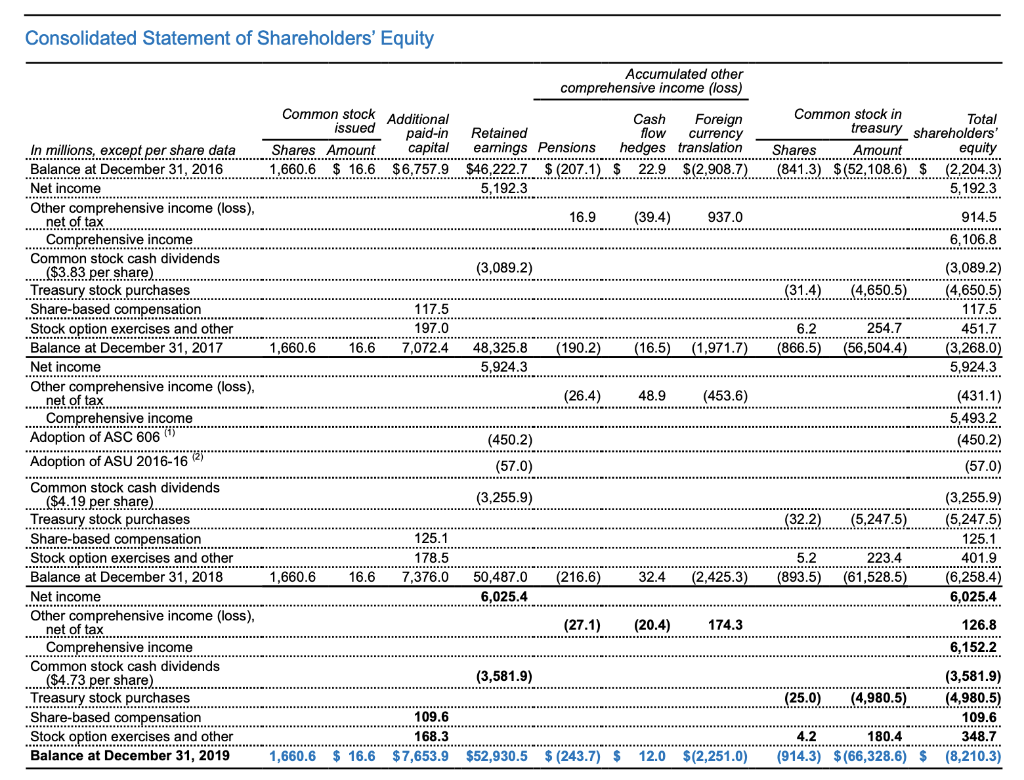
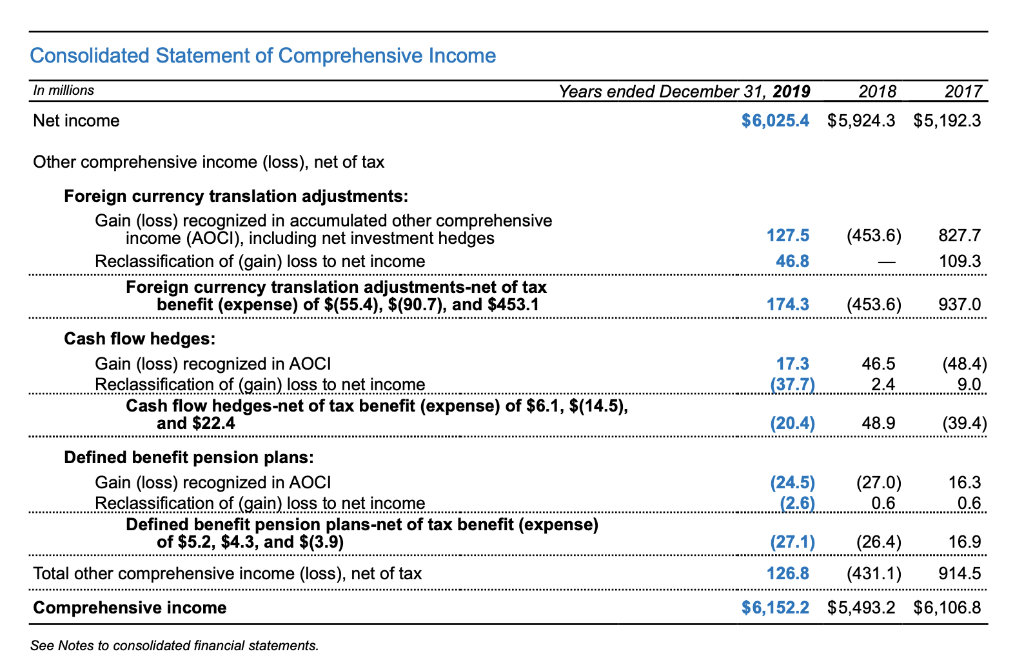
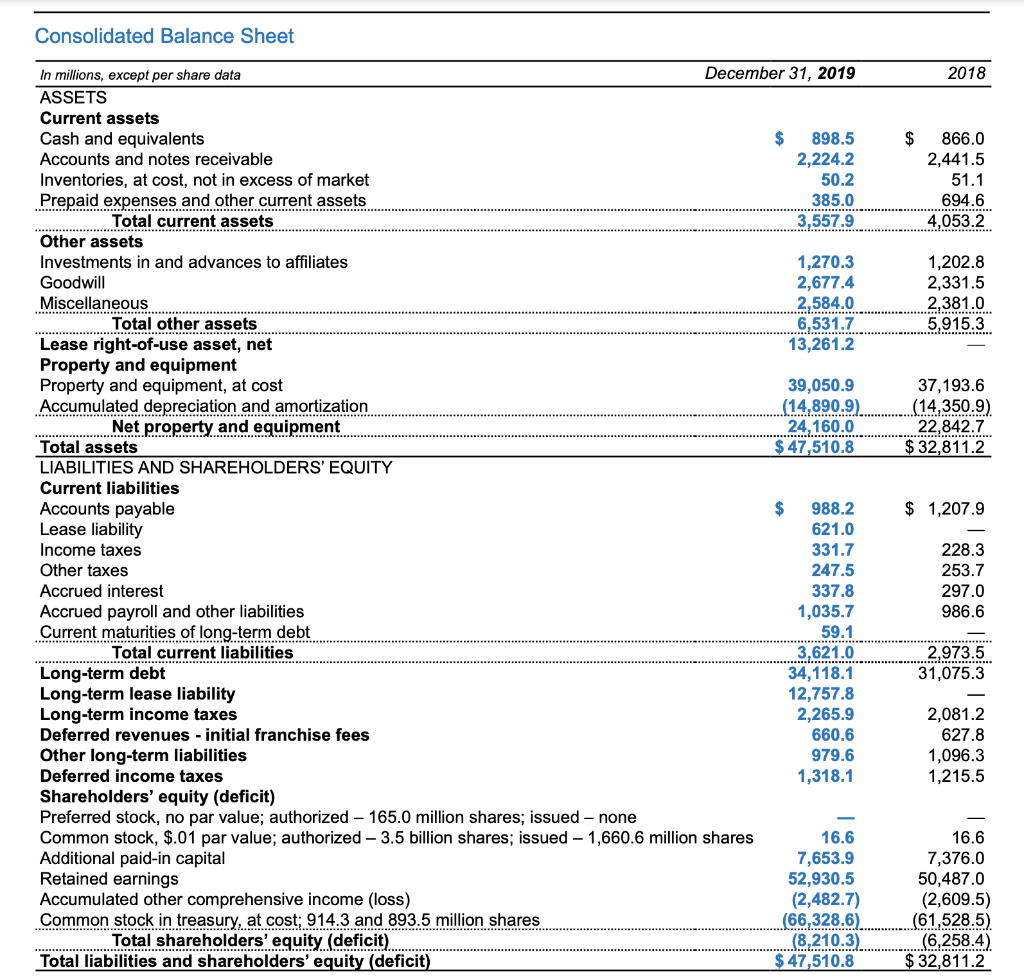
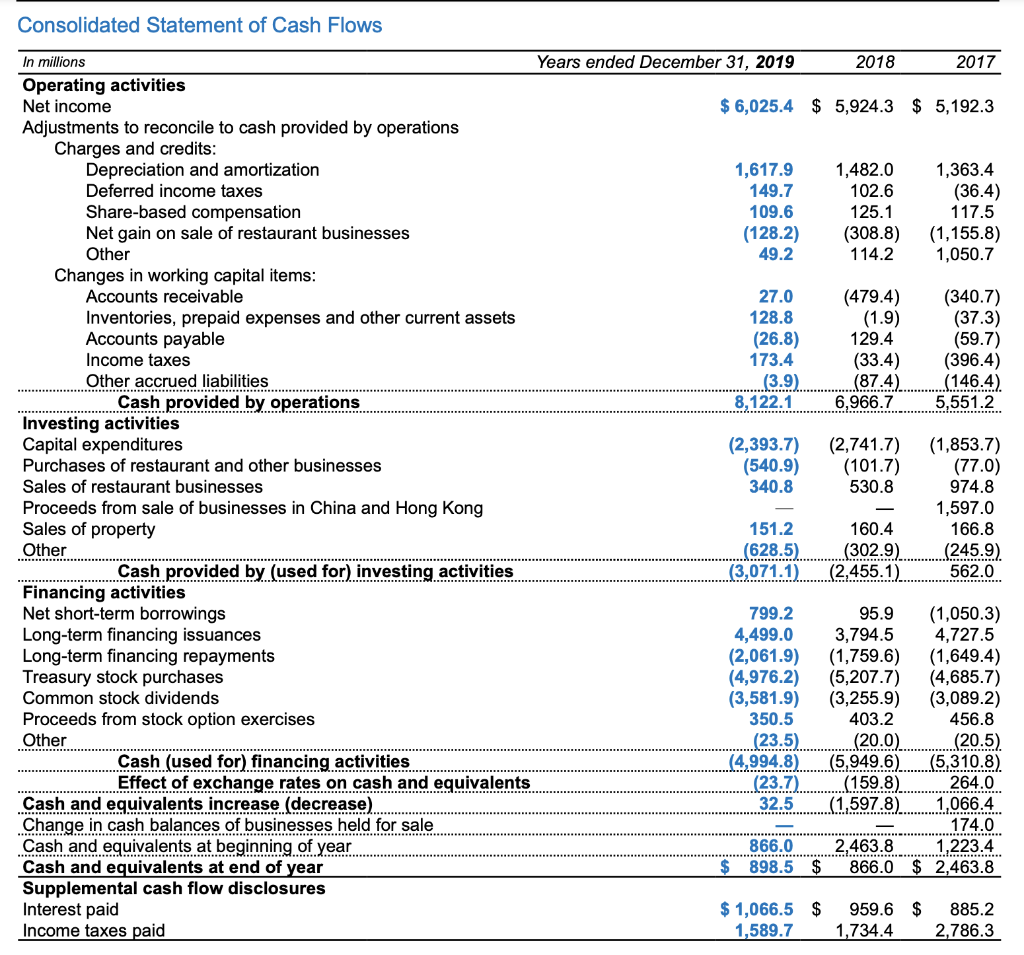
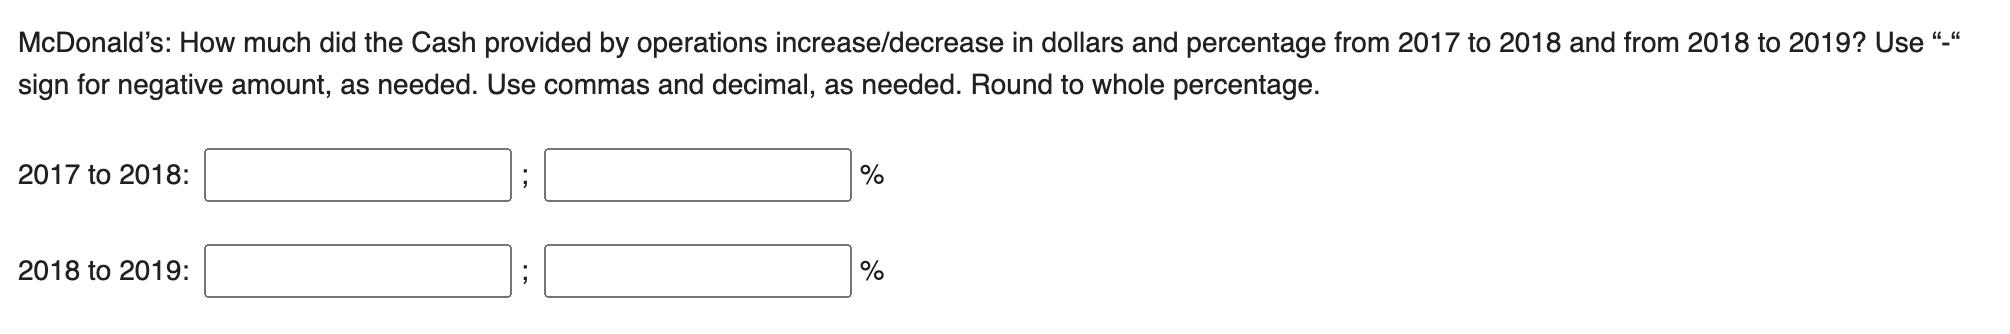
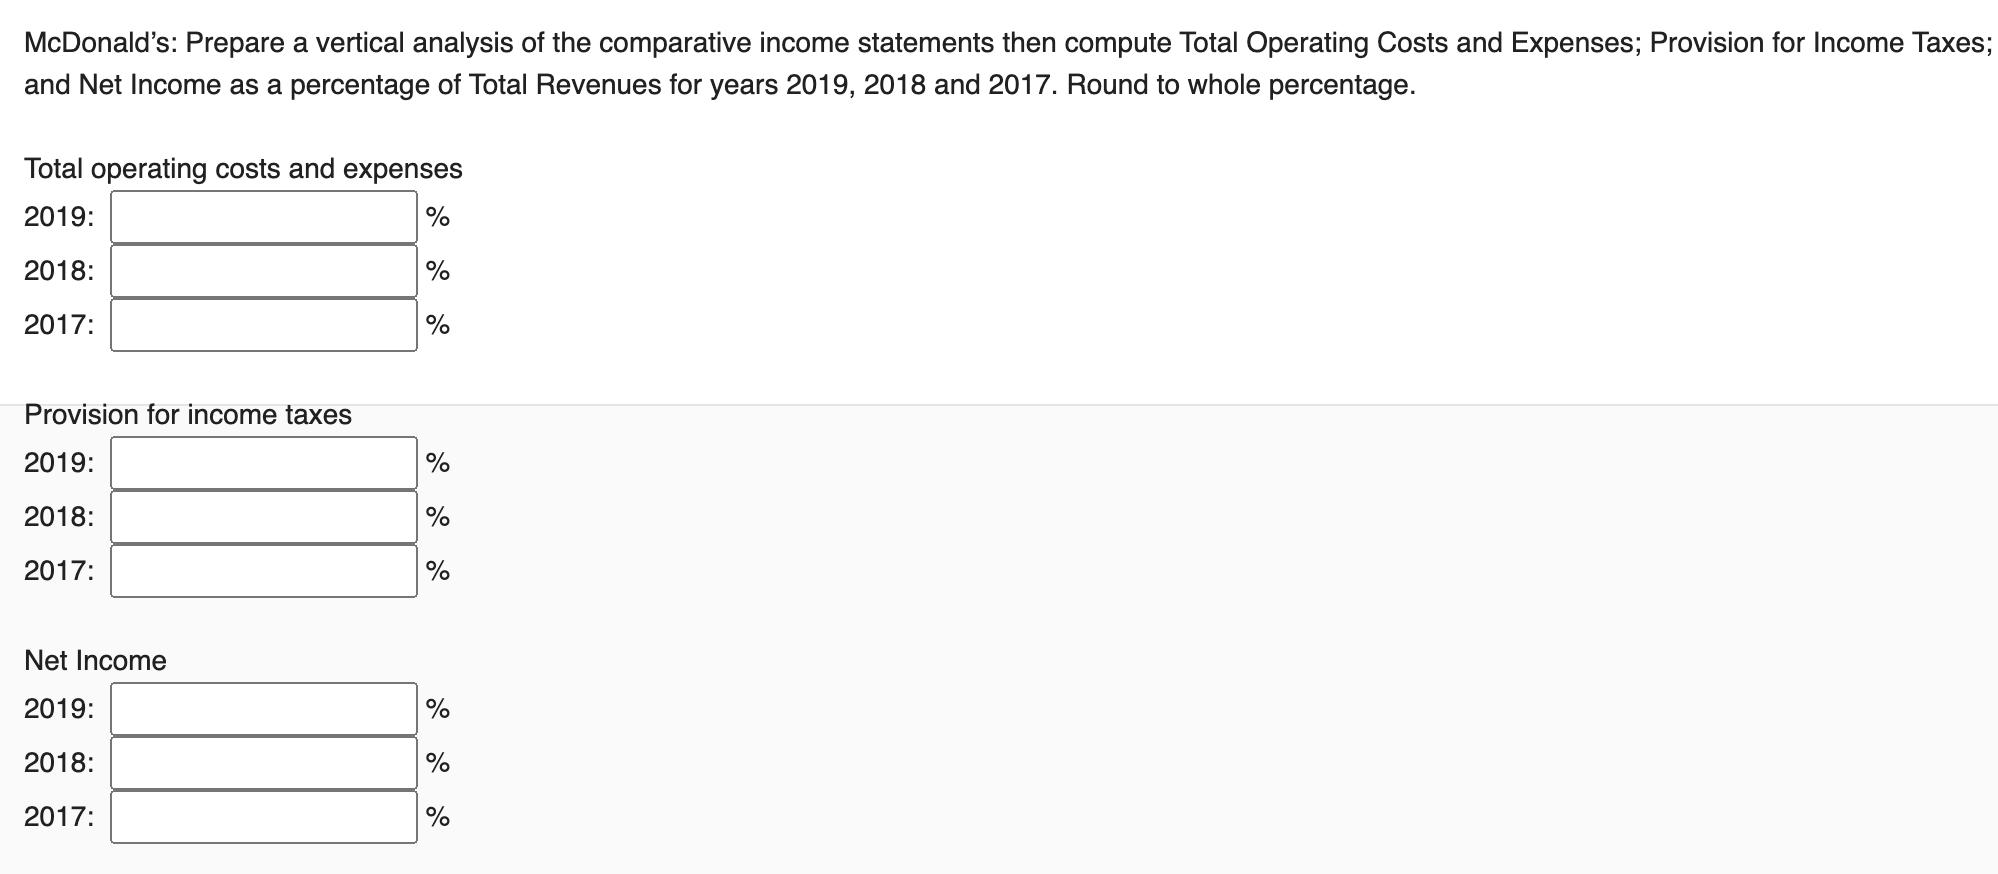
Consolidated Statement of Shareholders' Equity In millions, except per share data ..………..……………………......……………….…………….. Balance at December 31, 2016 Net income Other comprehensive income (loss), net of tax Comprehensive income Common stock cash dividends ($3.83 per share) Treasury stock purchases …………………… Share-based compensation ...……….…......….…………... Stock option exercises and other Balance at December 31, 2017 Net income Other comprehensive income (loss), net of tax............... Comprehensive income Adoption of ASC 606 ….…………………………………….……....... Adoption of ASU 2016-16 (2) ……………………………………. Common stock cash dividends ($4.19 per share) Treasury stock purchases Share-based compensation Stock option exercises and other Balance at December 31, 2018 Net income ******** Other comprehensive income (loss), ...... net of tax Comprehensive income Common stock cash dividends ($4.73 per share) Treasury stock purchases Share-based compensation Stock option exercises and other Balance at December 31, 2019 Common stock Additional issued paid-in Shares Amount capital 1,660.6 $16.6 $6,757.9 1,660.6 1,660.6 117.5 197.0 16.6 7,072.4 125.1 178.5 16.6 7,376.0 Cash flow Foreign currency Retained earnings Pensions hedges translation $46,222.7 $(207.1) $ 22.9 $(2,908.7) 5,192.3 (3,089.2) 48,325.8 5,924.3 (450.2) (57.0) (3,255.9) 50,487.0 6,025.4 Accumulated other comprehensive income (loss) (3,581.9) 16.9 (39.4) 937.0 (190.2) (26.4) (216.6) 48.9 6.2 (16.5) (1,971.7) (866.5) (453.6) 32.4 (2,425.3) (27.1) (20.4) 174.3 Common stock in Total treasury shareholders' Amount equity Shares (841.3) $(52,108.6) $ (2,204.3) 5.192.3 109.6 168.3 1,660.6 $ 16.6 $7,653.9 $52,930.5 $(243.7) $ 12.0 $(2,251.0) (31.4) (32.2) 5.2 (893.5) (4,650.5) (25.0) 254.7 (56,504.4) (5,247.5) 223.4 (61,528.5) 914.5 0,100.0. 6.106.8 (4,980.5) (3,089.2) (4,650.5) 117.5 451.7 (3,268.0) 5,924.3 wwwwww (431.1) .........…..…... 5,493.2 (450.2) (57.0) (3,255.9) …………………….... (5,247.5) 125.1 401.9 (6,258.4) 6,025.4 (3,581.9) (4,980.5) 4,900.0 109.6 4.2 180.4 348.7 (914.3) $(66,328.6) $ (8,210.3) 126.8 6.152.2 Consolidated Statement of Comprehensive Income In millions Net income Other comprehensive income (loss), net of tax Foreign currency translation adjustments: Gain (loss) recognized in accumulated other comprehensive income (AOCI), including net investment hedges Reclassification of (gain) loss to net income Foreign currency translation adjustments-net of tax benefit (expense) of $(55.4), $(90.7), and $453.1 Cash flow hedges: Gain (loss) recognized in AOCI Reclassification of (gain) loss to net income Cash flow hedges-net of tax benefit (expense) of $6.1, $(14.5), and $22.4 Defined benefit pension plans: Gain (loss) recognized in AOCI Reclassification of (gain) loss to net income Defined benefit pension plans-net of tax benefit (expense) of $5.2, $4.3, and $(3.9) Total other comprehensive income (loss), net of tax Comprehensive income Years ended December 31, 2019 See Notes to consolidated financial statements. 2018 2017 $6,025.4 $5,924.3 $5,192.3 127.5 46.8 174.3 17.3 (37.7) (20.4) (24.5) (2.6) (453.6) 827.7 109.3 (453.6) 46.5 (48.4) 2.4 9.0 (39.4) 48.9 937.0 (27.0) 0.6 16.3 0.6 (27.1) (26.4) 16.9 126.8 (431.1) 914.5 $6,152.2 $5,493.2 $6,106.8 Consolidated Balance Sheet In millions, except per share data ASSETS Current assets Cash and equivalents Accounts and notes receivable Inventories, at cost, not in excess of market Prepaid expenses and other current assets Total current assets Other assets Investments in and advances to affiliates Goodwill Miscellaneous Total other assets Lease right-of-use asset, net Property and equipment Property and equipment, at cost Accumulated imulated depreciation and amortization Net property and equipment Total assets LIABILITIES AND SHAREHOLDERS' EQUITY Current liabilities Accounts payable Lease liability Income taxes Other taxes Accrued interest Accrued payroll and other liabilities Current maturities of long-term debt Total current liabilities Long-term debt Long-term lease liability Long-term income taxes Deferred revenues - initial franchise fees Other long-term liabilities Deferred income taxes December 31, 2019 Shareholders' equity (deficit) Preferred stock, no par value; authorized - 165.0 million shares; issued - none Common stock, $.01 par value; authorized - 3.5 billion shares; issued - 1,660.6 million shares Additional paid-in capital Retained earnings Accumulated other comprehensive income (loss) Common stock in treasury, at cost; 914.3 and 893.5 million shares Total shareholders' equity (deficit) Total liabilities and shareholders' equity (deficit) $ 898.5 2,224.2 50.2 385.0 3,557.9 1,270.3 2,677.4 2,584.0 6,531.7 13,261.2 39,050.9 (14,890.9) 24,160.0 $ 47,510.8 $ 988.2 621.0 331.7 247.5 337.8 1,035.7 59.1 3,621.0 34,118.1 12,757.8 2,265.9 660.6 979.6 1,318.1 16.6 7,653.9 52,930.5 (2,482.7) (66,328.6) (8,210.3) $ 47,510.8 $ 2018 866.0 2,441.5 51.1 694.6 4,053.2 1,202.8 2,331.5 2.381.0 5,915.3 37,193.6 (14,350.9) 22,842.7 $ 32,811.2 $ 1,207.9 228.3 253.7 297.0 986.6 ********* 2,973.5 31,075.3 2,081.2 627.8 1,096.3 1,215.5 16.6 7,376.0 50,487.0 (2,609.5) (61,528.5) (6,258.4) $ 32,811.2 Consolidated Statement of Cash Flows In millions Operating activities Net income Adjustments to reconcile to cash provided by operations Charges and credits: Depreciation and amortization Deferred income taxes Share-based compensation Net gain on sale of restaurant businesses Other Changes in working capital items: Accounts receivable Inventories, prepaid expenses and other current assets Accounts payable Income taxes Other accrued liabilities Cash provided by operations Investing activities Capital expenditures Purchases of restaurant and other businesses Sales of restaurant businesses Proceeds from sale of businesses in China and Hong Kong Sales of property Other Cash provided by (used for) investing activities Financing activities Net short-term borrowings Long-term financing issuances Long-term financing repayments Treasury stock purchases Common stock dividends Proceeds from stock option exercises Other Cash (used for) financing activities Effect of exchange rates on cash and equivalents Cash and equivalents increase (decrease) Change in cash balances of businesses held for sale Cash and equivalents at beginning of year Cash and equivalents at end of year Supplemental cash flow disclosures Interest paid Income taxes paid Years ended December 31, 2019 1,617.9 149.7 109.6 (128.2) 49.2 $6,025.4 $ 5,924.3 $ 5,192.3 27.0 128.8 (26.8) 173.4 (3.9) 2018 151.2 (628.5) (3,071.1) (33.4) (87.4) 8,122.1 6,966.7 1,482.0 102.6 125.1 (308.8) 114.2 (479.4) (1.9) (2,393.7) (2,741.7) (540.9) (101.7) 340.8 530.8 (23.7) 32.5 94.9 129.4 866.0 $ 898.5 $ 799.2 95.9 4,499.0 3,794.5 (2,061.9) (1,759.6) (4,976.2) (5,207.7) (3,581.9) (3,255.9) 403.2 350.5 (23.5) (20.0) 160.4 (302.9) (2,455.1) (4,994.8) (5,949.6) (159.8) (1,597.8) 2017 2,463.8 1,363.4 (36.4) 117.5 (1,155.8) 1,050.7 (340.7) (37.3) (59.7) (396.4) (146.4) 5,551.2 (1,853.7) (77.0) 974.8 1,597.0 166.8 (245.9) 562.0 (1,050.3) 4,727.5 (1,649.4) (4,685.7) (3,089.2) 456.8 (20.5) (5,310.8) 264.0 1,066.4 174.0 1,223.4 866.0 $ 2,463.8 $1,066.5 $ 959.6 $ 885.2 1,589.7 1,734.4 2,786.3 McDonald's: How much did the Cash provided by operations increase/decrease in dollars and percentage from 2017 to 2018 and from 2018 to 2019? Use "-" sign for negative amount, as needed. Use commas and decimal, as needed. Round to whole percentage. 2017 to 2018: 2018 to 2019: % % McDonald's: Prepare a vertical analysis of the comparative income statements then compute Total Operating Costs and Expenses; Provision for Income Taxes; and Net Income as a percentage of Total Revenues for years 2019, 2018 and 2017. Round to whole percentage. Total operating costs and expenses 2019: % 2018: 2017: Provision for income taxes 2019: 2018: 2017: Net Income 2019: 2018: 2017: % % % % % % % % Consolidated Statement of Shareholders' Equity In millions, except per share data ..………..……………………......……………….…………….. Balance at December 31, 2016 Net income Other comprehensive income (loss), net of tax Comprehensive income Common stock cash dividends ($3.83 per share) Treasury stock purchases …………………… Share-based compensation ...……….…......….…………... Stock option exercises and other Balance at December 31, 2017 Net income Other comprehensive income (loss), net of tax............... Comprehensive income Adoption of ASC 606 ….…………………………………….……....... Adoption of ASU 2016-16 (2) ……………………………………. Common stock cash dividends ($4.19 per share) Treasury stock purchases Share-based compensation Stock option exercises and other Balance at December 31, 2018 Net income ******** Other comprehensive income (loss), ...... net of tax Comprehensive income Common stock cash dividends ($4.73 per share) Treasury stock purchases Share-based compensation Stock option exercises and other Balance at December 31, 2019 Common stock Additional issued paid-in Shares Amount capital 1,660.6 $16.6 $6,757.9 1,660.6 1,660.6 117.5 197.0 16.6 7,072.4 125.1 178.5 16.6 7,376.0 Cash flow Foreign currency Retained earnings Pensions hedges translation $46,222.7 $(207.1) $ 22.9 $(2,908.7) 5,192.3 (3,089.2) 48,325.8 5,924.3 (450.2) (57.0) (3,255.9) 50,487.0 6,025.4 Accumulated other comprehensive income (loss) (3,581.9) 16.9 (39.4) 937.0 (190.2) (26.4) (216.6) 48.9 6.2 (16.5) (1,971.7) (866.5) (453.6) 32.4 (2,425.3) (27.1) (20.4) 174.3 Common stock in Total treasury shareholders' Amount equity Shares (841.3) $(52,108.6) $ (2,204.3) 5.192.3 109.6 168.3 1,660.6 $ 16.6 $7,653.9 $52,930.5 $(243.7) $ 12.0 $(2,251.0) (31.4) (32.2) 5.2 (893.5) (4,650.5) (25.0) 254.7 (56,504.4) (5,247.5) 223.4 (61,528.5) 914.5 0,100.0. 6.106.8 (4,980.5) (3,089.2) (4,650.5) 117.5 451.7 (3,268.0) 5,924.3 wwwwww (431.1) .........…..…... 5,493.2 (450.2) (57.0) (3,255.9) …………………….... (5,247.5) 125.1 401.9 (6,258.4) 6,025.4 (3,581.9) (4,980.5) 4,900.0 109.6 4.2 180.4 348.7 (914.3) $(66,328.6) $ (8,210.3) 126.8 6.152.2 Consolidated Statement of Comprehensive Income In millions Net income Other comprehensive income (loss), net of tax Foreign currency translation adjustments: Gain (loss) recognized in accumulated other comprehensive income (AOCI), including net investment hedges Reclassification of (gain) loss to net income Foreign currency translation adjustments-net of tax benefit (expense) of $(55.4), $(90.7), and $453.1 Cash flow hedges: Gain (loss) recognized in AOCI Reclassification of (gain) loss to net income Cash flow hedges-net of tax benefit (expense) of $6.1, $(14.5), and $22.4 Defined benefit pension plans: Gain (loss) recognized in AOCI Reclassification of (gain) loss to net income Defined benefit pension plans-net of tax benefit (expense) of $5.2, $4.3, and $(3.9) Total other comprehensive income (loss), net of tax Comprehensive income Years ended December 31, 2019 See Notes to consolidated financial statements. 2018 2017 $6,025.4 $5,924.3 $5,192.3 127.5 46.8 174.3 17.3 (37.7) (20.4) (24.5) (2.6) (453.6) 827.7 109.3 (453.6) 46.5 (48.4) 2.4 9.0 (39.4) 48.9 937.0 (27.0) 0.6 16.3 0.6 (27.1) (26.4) 16.9 126.8 (431.1) 914.5 $6,152.2 $5,493.2 $6,106.8 Consolidated Balance Sheet In millions, except per share data ASSETS Current assets Cash and equivalents Accounts and notes receivable Inventories, at cost, not in excess of market Prepaid expenses and other current assets Total current assets Other assets Investments in and advances to affiliates Goodwill Miscellaneous Total other assets Lease right-of-use asset, net Property and equipment Property and equipment, at cost Accumulated imulated depreciation and amortization Net property and equipment Total assets LIABILITIES AND SHAREHOLDERS' EQUITY Current liabilities Accounts payable Lease liability Income taxes Other taxes Accrued interest Accrued payroll and other liabilities Current maturities of long-term debt Total current liabilities Long-term debt Long-term lease liability Long-term income taxes Deferred revenues - initial franchise fees Other long-term liabilities Deferred income taxes December 31, 2019 Shareholders' equity (deficit) Preferred stock, no par value; authorized - 165.0 million shares; issued - none Common stock, $.01 par value; authorized - 3.5 billion shares; issued - 1,660.6 million shares Additional paid-in capital Retained earnings Accumulated other comprehensive income (loss) Common stock in treasury, at cost; 914.3 and 893.5 million shares Total shareholders' equity (deficit) Total liabilities and shareholders' equity (deficit) $ 898.5 2,224.2 50.2 385.0 3,557.9 1,270.3 2,677.4 2,584.0 6,531.7 13,261.2 39,050.9 (14,890.9) 24,160.0 $ 47,510.8 $ 988.2 621.0 331.7 247.5 337.8 1,035.7 59.1 3,621.0 34,118.1 12,757.8 2,265.9 660.6 979.6 1,318.1 16.6 7,653.9 52,930.5 (2,482.7) (66,328.6) (8,210.3) $ 47,510.8 $ 2018 866.0 2,441.5 51.1 694.6 4,053.2 1,202.8 2,331.5 2.381.0 5,915.3 37,193.6 (14,350.9) 22,842.7 $ 32,811.2 $ 1,207.9 228.3 253.7 297.0 986.6 ********* 2,973.5 31,075.3 2,081.2 627.8 1,096.3 1,215.5 16.6 7,376.0 50,487.0 (2,609.5) (61,528.5) (6,258.4) $ 32,811.2 Consolidated Statement of Cash Flows In millions Operating activities Net income Adjustments to reconcile to cash provided by operations Charges and credits: Depreciation and amortization Deferred income taxes Share-based compensation Net gain on sale of restaurant businesses Other Changes in working capital items: Accounts receivable Inventories, prepaid expenses and other current assets Accounts payable Income taxes Other accrued liabilities Cash provided by operations Investing activities Capital expenditures Purchases of restaurant and other businesses Sales of restaurant businesses Proceeds from sale of businesses in China and Hong Kong Sales of property Other Cash provided by (used for) investing activities Financing activities Net short-term borrowings Long-term financing issuances Long-term financing repayments Treasury stock purchases Common stock dividends Proceeds from stock option exercises Other Cash (used for) financing activities Effect of exchange rates on cash and equivalents Cash and equivalents increase (decrease) Change in cash balances of businesses held for sale Cash and equivalents at beginning of year Cash and equivalents at end of year Supplemental cash flow disclosures Interest paid Income taxes paid Years ended December 31, 2019 1,617.9 149.7 109.6 (128.2) 49.2 $6,025.4 $ 5,924.3 $ 5,192.3 27.0 128.8 (26.8) 173.4 (3.9) 2018 151.2 (628.5) (3,071.1) (33.4) (87.4) 8,122.1 6,966.7 1,482.0 102.6 125.1 (308.8) 114.2 (479.4) (1.9) (2,393.7) (2,741.7) (540.9) (101.7) 340.8 530.8 (23.7) 32.5 94.9 129.4 866.0 $ 898.5 $ 799.2 95.9 4,499.0 3,794.5 (2,061.9) (1,759.6) (4,976.2) (5,207.7) (3,581.9) (3,255.9) 403.2 350.5 (23.5) (20.0) 160.4 (302.9) (2,455.1) (4,994.8) (5,949.6) (159.8) (1,597.8) 2017 2,463.8 1,363.4 (36.4) 117.5 (1,155.8) 1,050.7 (340.7) (37.3) (59.7) (396.4) (146.4) 5,551.2 (1,853.7) (77.0) 974.8 1,597.0 166.8 (245.9) 562.0 (1,050.3) 4,727.5 (1,649.4) (4,685.7) (3,089.2) 456.8 (20.5) (5,310.8) 264.0 1,066.4 174.0 1,223.4 866.0 $ 2,463.8 $1,066.5 $ 959.6 $ 885.2 1,589.7 1,734.4 2,786.3 McDonald's: How much did the Cash provided by operations increase/decrease in dollars and percentage from 2017 to 2018 and from 2018 to 2019? Use "-" sign for negative amount, as needed. Use commas and decimal, as needed. Round to whole percentage. 2017 to 2018: 2018 to 2019: % % McDonald's: Prepare a vertical analysis of the comparative income statements then compute Total Operating Costs and Expenses; Provision for Income Taxes; and Net Income as a percentage of Total Revenues for years 2019, 2018 and 2017. Round to whole percentage. Total operating costs and expenses 2019: % 2018: 2017: Provision for income taxes 2019: 2018: 2017: Net Income 2019: 2018: 2017: % % % % % % % %
Expert Answer:

Related Book For 
Posted Date:
Students also viewed these accounting questions
-
Make a shareholders' equity statement of Nike Inc. from 2016 to 2020. with format like the first picture. this is an financial statement analysis question. second picture is the balance sheet. NIKE...
-
The NF Corp has the following classes of share capital outstanding as of Dec 31, 2021. Ordinary share capital, P20 par value, 20,000 shares outstanding Preference share capital, 5% P100 par value,...
-
CRANE COMPANY Income Statements For the Years Ended December 31 2017 2016 Net sales $1,896,140 $1,756,100 Cost of goods sold 1,064,140 1,011,600 Gross profit 832,000 744,500 Selling and...
-
Transfer pricing is a significant area of concern for taxing authorities and multinational entities (MNE). Examine at least two (2) potential transfer pricing issues that create concern for both...
-
What do all members of the family of linear functions f(X) = c - x have in common? Sketch several members of the family.
-
At the roller rink, two \(20-\mathrm{kg}\) girls accelerate toward each other until they are each moving at \(2.0 \mathrm{~m} / \mathrm{s}\) in the Earth reference frame. They then collide...
-
A person is required to toss 8 unbiased coins and note down the outcome of each. The random variable represents the number of heads. Determine whether the experiment is a binomial experiment. If it...
-
Sales mix, new and upgrade customers. Zapo 1-2-3 is a top-selling electronic spreadsheet product. Zapo is about to release version 5.0. It divides its customers into two groups: new customers and...
-
The volume of the solid obtained by rotating the region bounded by about the line x = y = x, y = 3x, 3 can be computed using the method of washers via an integral with limits of integration a = and b...
-
Bottle-Up, Inc., was organized on January 8, 2010, and made its S election on January 24, 2010. The necessary consents to the election were filed in a timely manner. Its address is 1234 Hill Street,...
-
ABC Company estimates that the annual dollar loss that would occur should a destructive fire take place is -$1,000,000. The company also estimates that the annual possibility that the fire will occur...
-
Has the increased use of mobile devices impacted on the decision-making process? Develop a critical discussion.
-
What are the most important factors making up the micro-environment?
-
Apple was founded in 1976 by Steve Jobs, Steve Wozniak and Ronald Wayne. Wozniak was the electronics man: he designed and hand-built the first Apple computer, the Apple 1, which was first shown to...
-
Given that businesses are made up of people, how is it that the same people are included as part of the firm's internal environment?
-
Samsung was founded in 1938 in what is now South Korea. The company, whose name means Three Stars, was originally a simple trading company, dealing in dried fish, groceries and noodles. During the...
-
describe what topic you intend to research for your project. What macroeconomic concepts from the previous weeks will you be using the gain a better understanding of the topic? These concepts may...
-
For liquid water the isothermal compressibility is given by; where r and b are functions of temperature only. If 1 kg of water is compressed isothermally and reversibly from I to 500 bar at 60(C. how...
-
The following items were extracted from the 2012 financial records of Cummins Inc. (dollars in millions): Allowance for doubtful accounts 12 (cr.) During the following year, the company wrote off $5...
-
The financial information below was taken from the records of Lotechnic Enterprises. The company pays no dividends. a. Compute the current ratio, the debt/equity ratio, and return on assets for each...
-
Biomet Inc. provided the following disclosures in Note 4 of its 2012 annual report. It describes the companys investments in available-for-sale equity securities (dollars in millions). a. Compute the...
-
Sample size = 81, sample mean = 4.5 km, sample standard deviation = 3.1 km Assume that population means are to be estimated from the samples described. In each case, use the sample results to...
-
n = 100, x = 8.0 ft, s = 2.0 ft Assume that population means are to be estimated from the samples described. In each case, use the sample results to approximate the margin of error and 95% confidence...
-
Margin of error = \($5\), standard deviation = \($20\)

Study smarter with the SolutionInn App