

Demand for walnut fudge ice cream at the Sweet Cream Dairy can be approximated by a...
Fantastic news! We've Found the answer you've been seeking!
Question:
Transcribed Image Text:
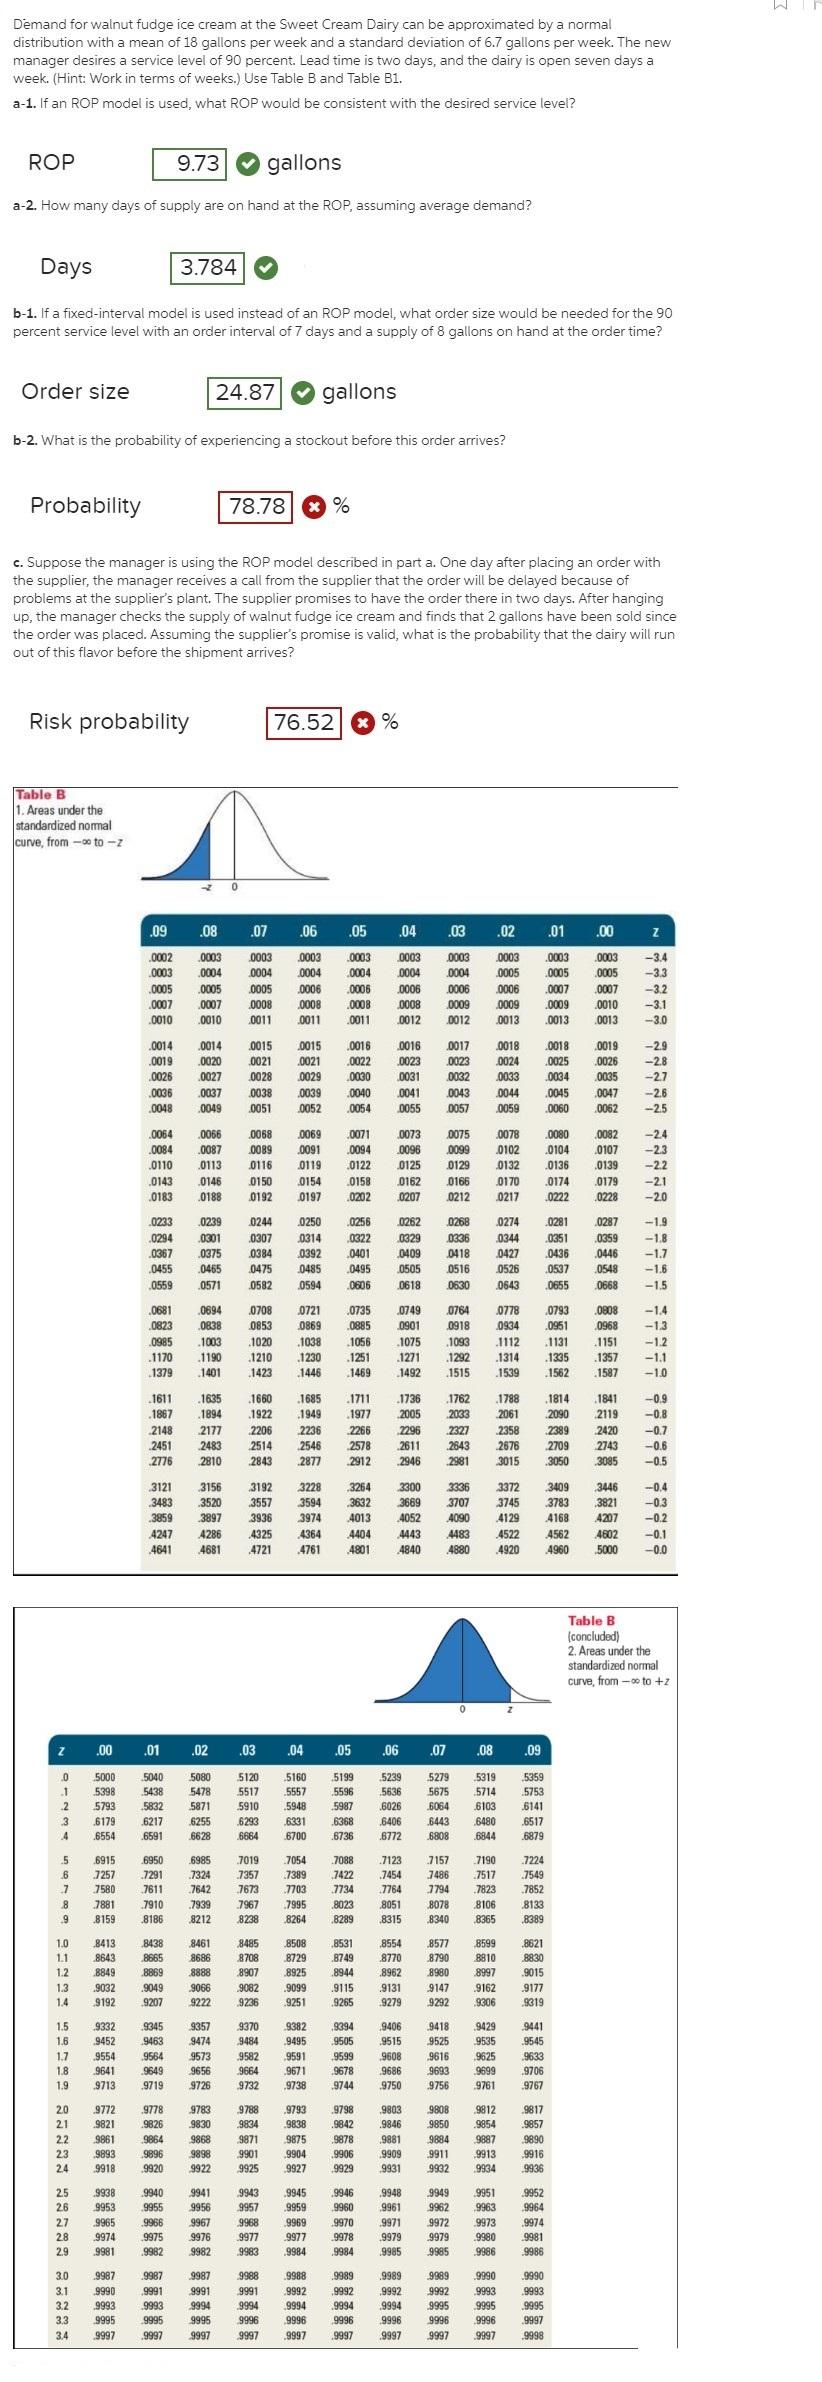
Demand for walnut fudge ice cream at the Sweet Cream Dairy can be approximated by a normal distribution with a mean of 18 gallons per week and a standard deviation of 6.7 gallons per week. The new manager desires a service level of 90 percent. Lead time is two days, and the dairy is open seven days a week. (Hint: Work in terms of weeks.) Use Table B and Table B1. a-1. If an ROP model is used, what ROP would be consistent with the desired service level? ROP 9.73 gallons a-2. How many days of supply are on hand at the ROP, assuming average demand? Days 3.784 b-1. If a fixed-interval model is used instead of an ROP model, what order size would be needed for the 90 percent service level with an order interval of 7 days and a supply of 8 gallons on hand at the order time? Order size 24.87 gallons b-2. What is the probability of experiencing a stockout before this order arrives? Probability 78.78 c. Suppose the manager is using the ROP model described in part a. One day after placing an order with the supplier, the manager receives a call from the supplier that the order will be delayed because of problems at the supplier's plant. The supplier promises to have the order there in two days. After hanging up, the manager checks the supply of walnut fudge ice cream and finds that 2 gallons have been sold since the order was placed. Assuming the supplier's promise is valid, what is the probability that the dairy will run out of this flavor before the shipment arrives? Risk probability 76.52 % Table B 1. Areas under the standardized nomal curve, from -0 to -z .09 .08 .07 .06 .05 .04 .03 .02 .01 .00 .0002 0003 .0003 0003 0003 0003 0003 0003 .0003 0003 -3.4 .0003 0004 .0005 0004 0004 0004 0004 0004 0005 .0006 .0005 .0005 -3.3 .0005 0005 0006 0008 0011 0006 0006 0008 0006 .0007 .0007 -3.2 .0007 0008 0011 .0008 .0011 0009 0012 .0009 0013 0009 .0013 .0007 0010 0013 -3.1 .0010 .0010 0012 -3.0 0014 .0014 0015 0021 0015 0016 0016 0017 0018 .0018 .0019 -2.9 -2.8 .0019 0020 0021 .0022 0023 0023 0024 .0025 0026 .0026 .0027 0028 0029 0030 0031 0032 0033 0034 0035 -27 .0036 .0037 0038 0051 0039 0040 0041 0043 0044 .0045 0060 0047 -2.6 -2.5 0048 0049 0052 .0054 0055 0057 0059 0062 0066 .0087 .0113 .0064 .0068 0069 .0071 0073 0075 0078 .0080 .0082 -2.4 0102 .0084 0110 0089 0091 0119 .0094 0122 0096 0125 0099 0129 .0104 0107 .0139 -2.3 0116 0132 .0136 -2.2 0143 .0183 0150 0162 0166 0170 0217 0146 0154 0158 .0174 0179 -2.1 .0188 0192 0197 0202 0207 0212 0222 .0228 -2.0 0233 .0239 0244 0250 0256 0262 0268 0274 .0281 .0287 -1.9 .0344 .0359 .0294 .0367 .0301 .0307 0314 0322 0329 0336 .0351 -1.8 0375 0384 0392 0485 .0401 0409 0418 0427 0526 .0436 .0446 -1.7 .0455 0465 0475 .0495 0505 0516 .0537 0548 -1.6 .0559 .0571 0582 0594 .0606 0618 0630 0643 .0655 0668 -1.5 .0681 0694 0708 0721 0735 0749 0764 0778 0793 .0808 -1.4 .0823 0838 0853 0869 .0885 0901 0918 0934 .0951 0968 -13 .0985 1003 1020 .1038 1056 1075 1093 .1112 .1131 .1151 -1.2 .1170 .1190 .1210 .1230 .1251 .1271 1292 .1314 .1335 .1357 -1.1 .1379 1401 1423 1446 1469 1492 1515 1539 .1562 1587 -1.0 .1611 .1635 1660 .1922 1685 .1711 .1736 1762 2033 1788 .1814 .1841 -0.9 .1867 .1894 1949 1977 2005 2061 2090 2119 -0.8 2266 2358 2678 2148 2177 2206 2514 2843 2236 2296 2327 2389 2420 -0.7 2451 2776 2483 2546 2877 2578 2611 2643 2709 3050 2743 3085 -0.6 2810 2912 2946 2981 3015 -0.5 3121 3156 3192 3228 3300 3669 3336 --0.4 -0.3 3264 3372 3409 3446 3483 3520 3557 3594 3632 3707 3745 3783 3821 3859 3897 3936 3974 4013 4052 4090 4129 4168 4207 -0.2 4247 A286 4325 4364 4404 4443 4483 4522 4562 4602 -0.1 4641 4681 4721 4761 4801 4840 4880 4920 4960 5000 -0.0 Table B (concluded) 2. Areas under the standardized normal curve, from -o to +z .00 .01 .02 .03 .04 .05 .06 .07 .08 .09 5000 5040 5080 5120 5160 5199 5239 5279 5319 5359 5398 5438 5478 5517 .5557 5596 5636 5675 5714 5753 5793 5832 5871 5910 5948 5987 .6026 6064 6103 6141 3 6179 6217 6255 6293 6331 6368 6406 6443 6480 .6517 .4 6554 6591 6628 6664 6700 .6736 6772 6808 6844 6879 in 6915 6950 6985 7019 7054 7088 .7123 7157 7190 7224 7257 7291 7324 7357 7389 7422 7454 7486 7517 7549 7580 7611 7642 7673 7703 7734 7764 7794 7823 7852 8 7881 7910 7939 7967 7995 8023 8051 8078 8106 8133 8159 8186 8212 8238 8264 .8289 8315 8340 8365 8389 1.0 8413 8438 8461 8485 8508 8531 8554 8577 8599 8621 8643 8665 8869 1.1 8686 8708 8729 8749 8770 8790 8810 8830 1.2 8849 8888 8907 8925 .8944 8962 8980 8997 9015 1.3 .9032 .9049 9066 9082 .9099 .9115 .9131 9147 9162 9177 1.4 9192 9207 9222 9236 9251 9265 9279 9292 9306 9319 1.5 9332 9345 9357 9370 9382 9394 9406 9418 9429 9441 1.6 9452 9463 9474 9484 9495 9505 9515 9525 9535 9545 1.7 9554 9564 9573 9582 9591 9599 9608 9616 9625 9633 1.8 9641 9649 9656 9664 9671 9678 9686 9693 9699 9706 1.9 9713 9719 9726 9732 9738 .9744 9750 9756 9761 9767 2.0 9772 9778 9783 9788 9793 9798 9803 9808 9812 9817 21 9821 9826 9830 9834 9838 .9842 9846 9850 9854 9857 9868 9898 9890 9916 22 9861 9864 9871 9875 9878 9881 9884 9887 23 9893 9896 9901 9904 9906 9909 9911 9913 24 9918 9920 9922 9925 9927 9929 9931 9932 9934 9936 2.5 9938 .9940 9941 9943 9945 9946 9948 9949 9951 9952 26 9953 9955 9956 9957 9959 9960 9961 9962 9963 9964 27 9965 9966 9967 9968 9969 .9970 9971 9972 9973 9974 28 9974 9975 9976 9977 9977 9978 9979 9979 9980 9981 2.9 9981 .9982 9982 9983 9984 .9984 9985 9985 9986 9986 8866 9988 9992 3.0 9987 9987 9987 9989 .9989 9989 9990 9990 3.1 9990 9991 9991 9991 9992 9992 9992 9993 9993 3.2 9993 .9993 9994 9994 9994 9994 9994 9995 9995 9995 3.3 9995 9995 9995 9996 9996 9996 9996 9996 9996 9997 3.4 9997 .9997 9997 9997 9997 .9997 9997 9997 9997 9998 Demand for walnut fudge ice cream at the Sweet Cream Dairy can be approximated by a normal distribution with a mean of 18 gallons per week and a standard deviation of 6.7 gallons per week. The new manager desires a service level of 90 percent. Lead time is two days, and the dairy is open seven days a week. (Hint: Work in terms of weeks.) Use Table B and Table B1. a-1. If an ROP model is used, what ROP would be consistent with the desired service level? ROP 9.73 gallons a-2. How many days of supply are on hand at the ROP, assuming average demand? Days 3.784 b-1. If a fixed-interval model is used instead of an ROP model, what order size would be needed for the 90 percent service level with an order interval of 7 days and a supply of 8 gallons on hand at the order time? Order size 24.87 gallons b-2. What is the probability of experiencing a stockout before this order arrives? Probability 78.78 c. Suppose the manager is using the ROP model described in part a. One day after placing an order with the supplier, the manager receives a call from the supplier that the order will be delayed because of problems at the supplier's plant. The supplier promises to have the order there in two days. After hanging up, the manager checks the supply of walnut fudge ice cream and finds that 2 gallons have been sold since the order was placed. Assuming the supplier's promise is valid, what is the probability that the dairy will run out of this flavor before the shipment arrives? Risk probability 76.52 % Table B 1. Areas under the standardized nomal curve, from -0 to -z .09 .08 .07 .06 .05 .04 .03 .02 .01 .00 .0002 0003 .0003 0003 0003 0003 0003 0003 .0003 0003 -3.4 .0003 0004 .0005 0004 0004 0004 0004 0004 0005 .0006 .0005 .0005 -3.3 .0005 0005 0006 0008 0011 0006 0006 0008 0006 .0007 .0007 -3.2 .0007 0008 0011 .0008 .0011 0009 0012 .0009 0013 0009 .0013 .0007 0010 0013 -3.1 .0010 .0010 0012 -3.0 0014 .0014 0015 0021 0015 0016 0016 0017 0018 .0018 .0019 -2.9 -2.8 .0019 0020 0021 .0022 0023 0023 0024 .0025 0026 .0026 .0027 0028 0029 0030 0031 0032 0033 0034 0035 -27 .0036 .0037 0038 0051 0039 0040 0041 0043 0044 .0045 0060 0047 -2.6 -2.5 0048 0049 0052 .0054 0055 0057 0059 0062 0066 .0087 .0113 .0064 .0068 0069 .0071 0073 0075 0078 .0080 .0082 -2.4 0102 .0084 0110 0089 0091 0119 .0094 0122 0096 0125 0099 0129 .0104 0107 .0139 -2.3 0116 0132 .0136 -2.2 0143 .0183 0150 0162 0166 0170 0217 0146 0154 0158 .0174 0179 -2.1 .0188 0192 0197 0202 0207 0212 0222 .0228 -2.0 0233 .0239 0244 0250 0256 0262 0268 0274 .0281 .0287 -1.9 .0344 .0359 .0294 .0367 .0301 .0307 0314 0322 0329 0336 .0351 -1.8 0375 0384 0392 0485 .0401 0409 0418 0427 0526 .0436 .0446 -1.7 .0455 0465 0475 .0495 0505 0516 .0537 0548 -1.6 .0559 .0571 0582 0594 .0606 0618 0630 0643 .0655 0668 -1.5 .0681 0694 0708 0721 0735 0749 0764 0778 0793 .0808 -1.4 .0823 0838 0853 0869 .0885 0901 0918 0934 .0951 0968 -13 .0985 1003 1020 .1038 1056 1075 1093 .1112 .1131 .1151 -1.2 .1170 .1190 .1210 .1230 .1251 .1271 1292 .1314 .1335 .1357 -1.1 .1379 1401 1423 1446 1469 1492 1515 1539 .1562 1587 -1.0 .1611 .1635 1660 .1922 1685 .1711 .1736 1762 2033 1788 .1814 .1841 -0.9 .1867 .1894 1949 1977 2005 2061 2090 2119 -0.8 2266 2358 2678 2148 2177 2206 2514 2843 2236 2296 2327 2389 2420 -0.7 2451 2776 2483 2546 2877 2578 2611 2643 2709 3050 2743 3085 -0.6 2810 2912 2946 2981 3015 -0.5 3121 3156 3192 3228 3300 3669 3336 --0.4 -0.3 3264 3372 3409 3446 3483 3520 3557 3594 3632 3707 3745 3783 3821 3859 3897 3936 3974 4013 4052 4090 4129 4168 4207 -0.2 4247 A286 4325 4364 4404 4443 4483 4522 4562 4602 -0.1 4641 4681 4721 4761 4801 4840 4880 4920 4960 5000 -0.0 Table B (concluded) 2. Areas under the standardized normal curve, from -o to +z .00 .01 .02 .03 .04 .05 .06 .07 .08 .09 5000 5040 5080 5120 5160 5199 5239 5279 5319 5359 5398 5438 5478 5517 .5557 5596 5636 5675 5714 5753 5793 5832 5871 5910 5948 5987 .6026 6064 6103 6141 3 6179 6217 6255 6293 6331 6368 6406 6443 6480 .6517 .4 6554 6591 6628 6664 6700 .6736 6772 6808 6844 6879 in 6915 6950 6985 7019 7054 7088 .7123 7157 7190 7224 7257 7291 7324 7357 7389 7422 7454 7486 7517 7549 7580 7611 7642 7673 7703 7734 7764 7794 7823 7852 8 7881 7910 7939 7967 7995 8023 8051 8078 8106 8133 8159 8186 8212 8238 8264 .8289 8315 8340 8365 8389 1.0 8413 8438 8461 8485 8508 8531 8554 8577 8599 8621 8643 8665 8869 1.1 8686 8708 8729 8749 8770 8790 8810 8830 1.2 8849 8888 8907 8925 .8944 8962 8980 8997 9015 1.3 .9032 .9049 9066 9082 .9099 .9115 .9131 9147 9162 9177 1.4 9192 9207 9222 9236 9251 9265 9279 9292 9306 9319 1.5 9332 9345 9357 9370 9382 9394 9406 9418 9429 9441 1.6 9452 9463 9474 9484 9495 9505 9515 9525 9535 9545 1.7 9554 9564 9573 9582 9591 9599 9608 9616 9625 9633 1.8 9641 9649 9656 9664 9671 9678 9686 9693 9699 9706 1.9 9713 9719 9726 9732 9738 .9744 9750 9756 9761 9767 2.0 9772 9778 9783 9788 9793 9798 9803 9808 9812 9817 21 9821 9826 9830 9834 9838 .9842 9846 9850 9854 9857 9868 9898 9890 9916 22 9861 9864 9871 9875 9878 9881 9884 9887 23 9893 9896 9901 9904 9906 9909 9911 9913 24 9918 9920 9922 9925 9927 9929 9931 9932 9934 9936 2.5 9938 .9940 9941 9943 9945 9946 9948 9949 9951 9952 26 9953 9955 9956 9957 9959 9960 9961 9962 9963 9964 27 9965 9966 9967 9968 9969 .9970 9971 9972 9973 9974 28 9974 9975 9976 9977 9977 9978 9979 9979 9980 9981 2.9 9981 .9982 9982 9983 9984 .9984 9985 9985 9986 9986 8866 9988 9992 3.0 9987 9987 9987 9989 .9989 9989 9990 9990 3.1 9990 9991 9991 9991 9992 9992 9992 9993 9993 3.2 9993 .9993 9994 9994 9994 9994 9994 9995 9995 9995 3.3 9995 9995 9995 9996 9996 9996 9996 9996 9996 9997 3.4 9997 .9997 9997 9997 9997 .9997 9997 9997 9997 9998
Expert Answer:

Related Book For 

Posted Date:
Students also viewed these general management questions
-
Demand for walnut fudge ice cream at the Sweet Cream Dairy can be approximated by a normal distribution with a mean of 21 gallons per week and a standard deviation of 3.5 gallons per week. The new...
-
For a normal distribution with a mean of = 60 and a standard deviation of = 10, find the proportion of the population corresponding to each of the following. a. Scores greater than 65. b. Scores...
-
The shape of a bacterium can be approximated by a cylinder of radius r and height h capped on each end by a hemisphere. The volume and surface area of the bacterium are given by It is known that the...
-
What is the relationship between group norms and group cohesiveness? What roles do both cohesiveness and norms plan in shaping group performance?
-
What is the difference between hard product variety and soft product variety?
-
A simple random sample of size n = 150 is obtained from a population whose size is N = 10,000 and whose population proportion with a specified characteristic is p = 0.6. (a) Describe the sampling...
-
Fit a Gompertz curve of the form \[y=e^{e^{\alpha x+\beta}}\] to the data of Exercise 11.26. Data From Exercise 11.26 11.26 The following data pertain to water pressure at various depths below sea...
-
Oxford Company has five employees. All are paid on a monthly basis. The fiscal year of the business is June 1 to May 31. The accounts kept by Oxford Company include the following: The following...
-
What is the purpose of the Fed's Discount Window that offers the Discount Rate?
-
The Golden Nursery School Company provides baby-sitting and child-care programs. On January 31, 2011, the company had the following trial balance; During the month of February, the company completed...
-
Service efforts and accomplishments measures suffer from the same problem as line-item or object-of-expenditures budgeting; that is, focusing only on resource inputs while ignoring outputs and...
-
What is the net present value (NPV), the internal rate of return (IRR), and the modified IRR (MIRR)? 2. Based on the evaluation, replacing the old equipment appears to be a (good or bad) decision...
-
Using any one of the infographic creation tools listed below, you are asked to create one infographic report summarizing key research points for your major project. To do this, you will have to do...
-
For the stage-discharge data in Table Q6, fit a regression equation for use in estimation of stage for a known value of discharge. i. Develop a gauge(stage)-discharge relationship for this stream at...
-
Subtract as indicated. 2 x + 2x 2 x + 4x-5 2 X-10 x+4x-5 x + 4x-5
-
Learning outcome: To understand, be able to think critically, to be aware of the contemporary issues about a business in management accounting. Assignment Brief 1. This assignment is concerned with...
-
Solve 4b only K Grade A prints custom training material for corporations. The business was started January 1, 2020. The company uses a normal-costing system. It has two direct-cost pools, materials...
-
Could a set of three vectors in span all of? Explain. What about n vectors in when n is less than m? R4
-
What are some of the advantages of e-business?
-
Given this payoff table:
-
What is job design, and why is it important?
-
Nestls financial statements are presented in Appendix B. Financial statements of Delfi Limited are presented in Appendix C. Instructions Refer to the financial statements and answer the following...
-
Writing Financial statement information about four different companies is as follows. Instructions a. Determine the missing amounts. (Hint: For example, to solve for (a), Assets Liabilities = Equity...
-
The financial statements of TSMC are presented in Appendix A. The complete annual report, including the notes to the financial statements, is available at the companys website. Instructions Refer to...

Study smarter with the SolutionInn App