

Discuss the pros and cos of B&B's owners wanting to keep 100% control of their business....
Fantastic news! We've Found the answer you've been seeking!
Question:
Transcribed Image Text:
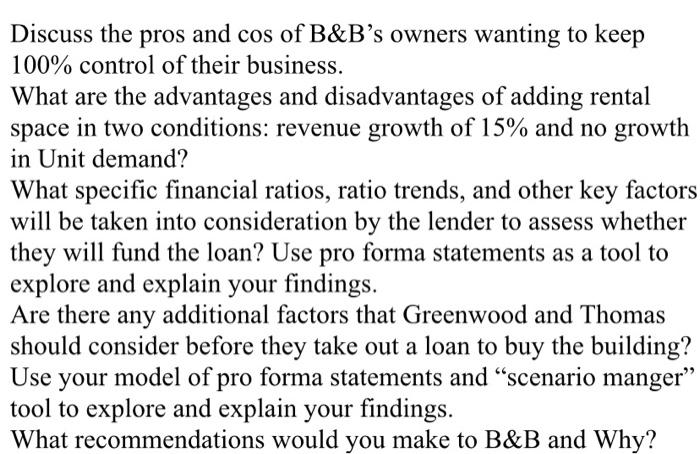
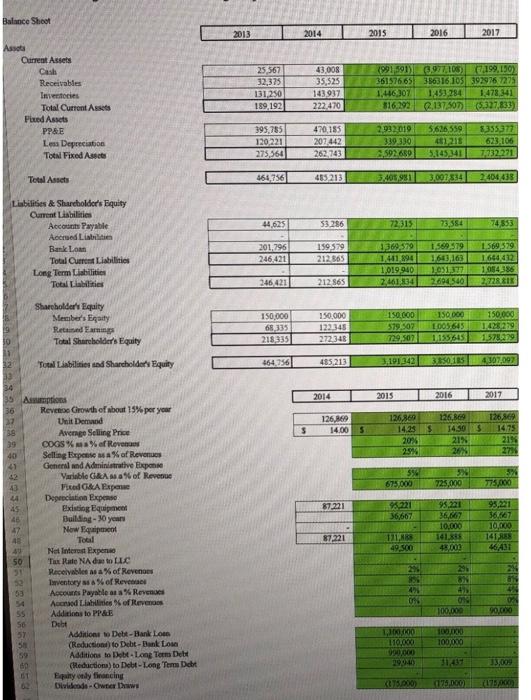
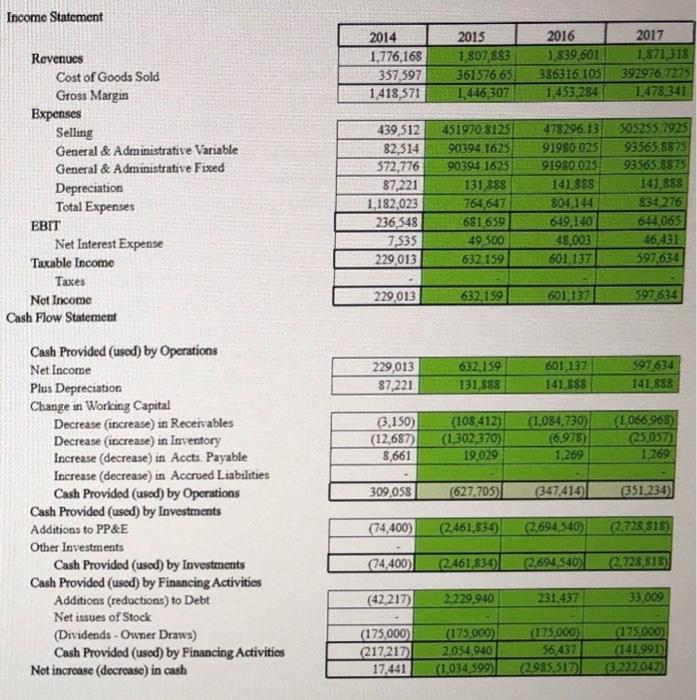
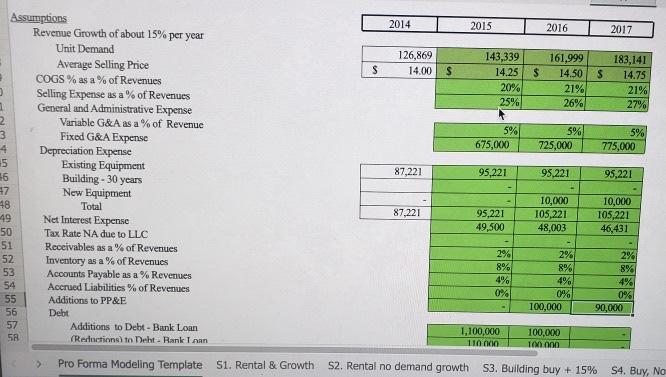
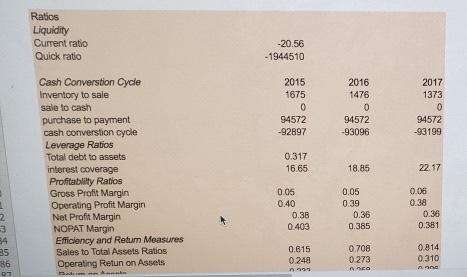
Discuss the pros and cos of B&B's owners wanting to keep 100% control of their business. What are the advantages and disadvantages of adding rental space in two conditions: revenue growth of 15% and no growth in Unit demand? What specific financial ratios, ratio trends, and other key factors will be taken into consideration by the lender to assess whether they will fund the loan? Use pro forma statements as a tool to explore and explain your findings. Are there any additional factors that Greenwood and Thomas should consider before they take out a loan to buy the building? Use your model of pro forma statements and "scenario manger" tool to explore and explain your findings. What recommendations would you make to B&B and Why? Balance Shoot 2013 2014 2015 2016 2017 Assota Current Assets Cash Receivables (991591) 361576.65 C199,150) 43,008 35,525 143937 222,470 6,977106) 386316105 392976 7275 1453 284 816.292 Q137507) 25,567 32,375 Inventories 131,250 1.446307 1,478 341 Total CurrontAssets 189 192 (5,327,833) Fixed Assets 5.626 559 441218 5.45341 2,932019 8355377 623.106 PPAE 395,785 470, 185 120221 275,564 Lesa Depreciation 207,442 339.330 Total Fixed Assets 262.743 .592689 7.732.271 Total Assets 464,756 485213 3007834 2404 435 Lisbilities & Shareholders Equity Curent Liabilities Accounts Payable 44,625 53.286 72.315 73,584 74,853 Accrued Liabilitien 201,796 246,421 1369,579 1,441,894 1,019940 2.461834 1569,579 1644,432 1,054386 2728.8IX 159.579 212.865 1,569.579 Bank Loan Total Current Liabilities Long Term Lisbilities 1643,163 1051377 2694540 Total Liabilities 246 421 212 865 Sharcholder's Equity Member's Eqaity Retained EarmingP Total Sharebolder's Equity 150,000 150.000 68,335 218335 150,000 1005645 1,155645 150,000 150.000 579.507 79,507 1428279 1.578.279 122345 272,348 32 Total Liabilities snd Sharcholders Equity 464.756 485,213 3,191342 3850185 4307.097 34 35 Assmptions 2014 2015 2016 2017 Revense Crowth of about 15% per your Unit Demand Avernge Seling Price COGS % % ef Revenaes Selling Expense MA% of Revenues General and Administrative Exponse Variable GAas a of Revenue Fited GA Expeae Depreciation Expense Exiating Equipment Building - 30 yean Now Equipment Total 36 27 126869 126,869 126,869 126, 14.00 14.25 1430 1475 20% 21% 21% 39 40 41 25% 26 276 42 675,000 725,000 775,000 43 44 245 95.221 36,667 10,000 141.85 48,003 95,221 36.667 10.000 95221 36,667 87.221 141 88 46AS 87.221 49,500 Net Interest Expene Tax Rate NA da to LLC Receivables as a % of Revenoes 29% Inventory as a% of Revenac Accounts Payable asa% Revenues Accnsed Liahilities % of Revenas Additions to PP&E Debt 53 0% 100,000 90,000 55 56 100,000 100,000 Additions Dete-Bank Losn (Reduction) to Debt-Bank Losn Additions to Dobt- Long Term Dett (Redactions) to Debt - Long Tem Dcbt Equity only fieoncing Dividende - Owner Daws L100,000 110,000 000000 29940 57 59 60 31439 33,009 175.000) (475A00) 375000) Income Statement 2017 1,871318 392976 7275 1,478 341 2015 2016 1,839,601 386316.105 1453,284 2014 1,776,168 357,597 1418,571 1,807,883 361576.65 1,446,307 Revenues Cost of Goods Sold Gross Margin Bxpenses Selling General & Administrative Variable 505255.7925 93565.8875 451970 8125 439,512 82,514 572,776 87,221 1,182,023 236,548 7,535 229,013 478296. 13 91980 025 91980.025 141 888 804,144 649,140 48,003 601 137 90394 1625 93565.8875 141,888 834 276 644,065 46,431 597,634 General & Administrative Fixed 90394 1625 131,888 Depreciation Total Expenses 764,647 681 659 49 300 EBIT Net Interest Expense Taxable Income 632.159 Taxes 229,013 632,159 601 137 597,634 Net Income Cash Flow Staterment Cash Provided (used) by Operations 229,013 87,221 597,634 141,888 632,159 601,137 141,888 Net Income 131,888 Plus Depreciation Change in Working Capital Decrease (increase) in Receivables Decrease (increase) in Inventory Increase (decrease) in Accts. Payable Increase (decrease) in Accrued Liabilities Cash Provided (used) by Operations Cash Provided (used) by Investments (3,150) (12,687) 8,661 (108412) (1,302,370) 19,029 (1,084,730) (6,975) 1,269 (1,066 968) 25.057) 1,269 309,058 (627,705) 347,414) 351,234) Additions to PP&E (74,400) (2461,834) (2.694 540) (2.728 818) Other Investments (74,400) (2.461,834)| (2694,540) 2.728 818) Cash Provided (used) by Investments Cash Provided (used) by Financing Activities Additions (reductions) to Debt (42,217) 2229,940 231,437 33,009 Net issues of Stock (Dividends - Owner Draws) Cash Provided (used) by Financing Activitios Net increase (decrease) in cash (175,000) (217,217) 17,441 (175,000) 2,054,940 (1,034,599) (175.000) 56,437 (2985 517) (175,000) (141,991) (3,222,042) Assumptions Revenue Growth of about 15% per year 2014 2015 2016 2017 Unit Demand 126,869 143,339 161,999 183,141 Average Selling Price COGS % as a % of Revenues Selling Expense as a % of Revenues General and Administrative Expense 14.00 14.25 14.50 14.75 20% 25% 21% 26% 21% 27% Variable G&A as a % of Revenue 5% 5% 725,000 5% Fixed G&A Expense Depreciation Expense Existing Equipment Building - 30 years New Equipment 675,000 775,000 15 87,221 95,221 95,221 95,221 48 49 10,000 105,221 10,000 105,221 46,431 Total 87,221 95,221 Net Interest Expense 50 49,500 48,003 Tax Rate NA due to LLC Receivables as a % of Revenues 51 2% 8% 4% 0% 100,000 2% 2% 8% 4% 0% 90,000 52 Inventory as a % of Revenues Accounts Payable as a % Revenues Accrued Liabilities % of Revenues 8% 4% 0% 53 54 55 Additions to PP&E 56 Debt 57 Additions to Debt - Bank Loan 1,100,000 110 000 100,000 100 000 58 (Reductions) to Deht - Rank Inan Pro Forma Modeling Template S1. Rental & Growth S2. Rental no demand growth S3. Building buy + 15% S4. Buy, No Ratios Liquidity Current ratio -20.56 Quick ratio -1944510 Cash Converstion Cycle Inventory to sale sale to cash 2015 2016 1476 2017 1675 1373 94572 purchase to payment cash converstion cycle Leverage Ratios Total debt to assets 94572 94572 -92897 -93096 -93199 0.317 interest coverage 16.65 18.85 22.17 Profitablity Ratios Gross Profit Margin Operating Profit Margin Net Profit Margin NOPAT Margin Efficiency and Retun Measures Sales to Total Assets Ratios Operating Retun on Assets 0.06 0.38 0.36 0.05 0.05 0.40 0.39 0.38 0.36 0.403 0.385 0.381 0.615 0.708 0.814 35 86 0.248 0 273 0.310 Discuss the pros and cos of B&B's owners wanting to keep 100% control of their business. What are the advantages and disadvantages of adding rental space in two conditions: revenue growth of 15% and no growth in Unit demand? What specific financial ratios, ratio trends, and other key factors will be taken into consideration by the lender to assess whether they will fund the loan? Use pro forma statements as a tool to explore and explain your findings. Are there any additional factors that Greenwood and Thomas should consider before they take out a loan to buy the building? Use your model of pro forma statements and "scenario manger" tool to explore and explain your findings. What recommendations would you make to B&B and Why? Balance Shoot 2013 2014 2015 2016 2017 Assota Current Assets Cash Receivables (991591) 361576.65 C199,150) 43,008 35,525 143937 222,470 6,977106) 386316105 392976 7275 1453 284 816.292 Q137507) 25,567 32,375 Inventories 131,250 1.446307 1,478 341 Total CurrontAssets 189 192 (5,327,833) Fixed Assets 5.626 559 441218 5.45341 2,932019 8355377 623.106 PPAE 395,785 470, 185 120221 275,564 Lesa Depreciation 207,442 339.330 Total Fixed Assets 262.743 .592689 7.732.271 Total Assets 464,756 485213 3007834 2404 435 Lisbilities & Shareholders Equity Curent Liabilities Accounts Payable 44,625 53.286 72.315 73,584 74,853 Accrued Liabilitien 201,796 246,421 1369,579 1,441,894 1,019940 2.461834 1569,579 1644,432 1,054386 2728.8IX 159.579 212.865 1,569.579 Bank Loan Total Current Liabilities Long Term Lisbilities 1643,163 1051377 2694540 Total Liabilities 246 421 212 865 Sharcholder's Equity Member's Eqaity Retained EarmingP Total Sharebolder's Equity 150,000 150.000 68,335 218335 150,000 1005645 1,155645 150,000 150.000 579.507 79,507 1428279 1.578.279 122345 272,348 32 Total Liabilities snd Sharcholders Equity 464.756 485,213 3,191342 3850185 4307.097 34 35 Assmptions 2014 2015 2016 2017 Revense Crowth of about 15% per your Unit Demand Avernge Seling Price COGS % % ef Revenaes Selling Expense MA% of Revenues General and Administrative Exponse Variable GAas a of Revenue Fited GA Expeae Depreciation Expense Exiating Equipment Building - 30 yean Now Equipment Total 36 27 126869 126,869 126,869 126, 14.00 14.25 1430 1475 20% 21% 21% 39 40 41 25% 26 276 42 675,000 725,000 775,000 43 44 245 95.221 36,667 10,000 141.85 48,003 95,221 36.667 10.000 95221 36,667 87.221 141 88 46AS 87.221 49,500 Net Interest Expene Tax Rate NA da to LLC Receivables as a % of Revenoes 29% Inventory as a% of Revenac Accounts Payable asa% Revenues Accnsed Liahilities % of Revenas Additions to PP&E Debt 53 0% 100,000 90,000 55 56 100,000 100,000 Additions Dete-Bank Losn (Reduction) to Debt-Bank Losn Additions to Dobt- Long Term Dett (Redactions) to Debt - Long Tem Dcbt Equity only fieoncing Dividende - Owner Daws L100,000 110,000 000000 29940 57 59 60 31439 33,009 175.000) (475A00) 375000) Income Statement 2017 1,871318 392976 7275 1,478 341 2015 2016 1,839,601 386316.105 1453,284 2014 1,776,168 357,597 1418,571 1,807,883 361576.65 1,446,307 Revenues Cost of Goods Sold Gross Margin Bxpenses Selling General & Administrative Variable 505255.7925 93565.8875 451970 8125 439,512 82,514 572,776 87,221 1,182,023 236,548 7,535 229,013 478296. 13 91980 025 91980.025 141 888 804,144 649,140 48,003 601 137 90394 1625 93565.8875 141,888 834 276 644,065 46,431 597,634 General & Administrative Fixed 90394 1625 131,888 Depreciation Total Expenses 764,647 681 659 49 300 EBIT Net Interest Expense Taxable Income 632.159 Taxes 229,013 632,159 601 137 597,634 Net Income Cash Flow Staterment Cash Provided (used) by Operations 229,013 87,221 597,634 141,888 632,159 601,137 141,888 Net Income 131,888 Plus Depreciation Change in Working Capital Decrease (increase) in Receivables Decrease (increase) in Inventory Increase (decrease) in Accts. Payable Increase (decrease) in Accrued Liabilities Cash Provided (used) by Operations Cash Provided (used) by Investments (3,150) (12,687) 8,661 (108412) (1,302,370) 19,029 (1,084,730) (6,975) 1,269 (1,066 968) 25.057) 1,269 309,058 (627,705) 347,414) 351,234) Additions to PP&E (74,400) (2461,834) (2.694 540) (2.728 818) Other Investments (74,400) (2.461,834)| (2694,540) 2.728 818) Cash Provided (used) by Investments Cash Provided (used) by Financing Activities Additions (reductions) to Debt (42,217) 2229,940 231,437 33,009 Net issues of Stock (Dividends - Owner Draws) Cash Provided (used) by Financing Activitios Net increase (decrease) in cash (175,000) (217,217) 17,441 (175,000) 2,054,940 (1,034,599) (175.000) 56,437 (2985 517) (175,000) (141,991) (3,222,042) Assumptions Revenue Growth of about 15% per year 2014 2015 2016 2017 Unit Demand 126,869 143,339 161,999 183,141 Average Selling Price COGS % as a % of Revenues Selling Expense as a % of Revenues General and Administrative Expense 14.00 14.25 14.50 14.75 20% 25% 21% 26% 21% 27% Variable G&A as a % of Revenue 5% 5% 725,000 5% Fixed G&A Expense Depreciation Expense Existing Equipment Building - 30 years New Equipment 675,000 775,000 15 87,221 95,221 95,221 95,221 48 49 10,000 105,221 10,000 105,221 46,431 Total 87,221 95,221 Net Interest Expense 50 49,500 48,003 Tax Rate NA due to LLC Receivables as a % of Revenues 51 2% 8% 4% 0% 100,000 2% 2% 8% 4% 0% 90,000 52 Inventory as a % of Revenues Accounts Payable as a % Revenues Accrued Liabilities % of Revenues 8% 4% 0% 53 54 55 Additions to PP&E 56 Debt 57 Additions to Debt - Bank Loan 1,100,000 110 000 100,000 100 000 58 (Reductions) to Deht - Rank Inan Pro Forma Modeling Template S1. Rental & Growth S2. Rental no demand growth S3. Building buy + 15% S4. Buy, No Ratios Liquidity Current ratio -20.56 Quick ratio -1944510 Cash Converstion Cycle Inventory to sale sale to cash 2015 2016 1476 2017 1675 1373 94572 purchase to payment cash converstion cycle Leverage Ratios Total debt to assets 94572 94572 -92897 -93096 -93199 0.317 interest coverage 16.65 18.85 22.17 Profitablity Ratios Gross Profit Margin Operating Profit Margin Net Profit Margin NOPAT Margin Efficiency and Retun Measures Sales to Total Assets Ratios Operating Retun on Assets 0.06 0.38 0.36 0.05 0.05 0.40 0.39 0.38 0.36 0.403 0.385 0.381 0.615 0.708 0.814 35 86 0.248 0 273 0.310
Expert Answer:
Answer rating: 100% (QA)
Advantages of Small Business Ownership Being a business owner can be extremely rewarding Having the courage to take a risk and start a venture is part of the American dream Success brings with it many ... View the full answer

Related Book For 
Posted Date:
Students also viewed these accounting questions
-
What are the advantages and disadvantages of beginning export operations in a foreign country?
-
What are the advantages and disadvantages of beginning export operations in a foreign country?
-
What are the advantages and disadvantages of control charts for attributes over those for variables?
-
What are the values of m and n after executing the following code? int n = 123456789; int m= 0; while (n != 0) { } m (10 m) + (n % 10); n = n/ 10;
-
Assume that (12x)/(1x+x2) + (2x4x3)/(1x2+x4) + (4x38x7)/(1 x4+x8) + = (1 + 2x)/(1+x+x2), for x < 1, and let x = 0.25. Write and execute an algorithm that determines the number of terms needed on...
-
Yellow light of wavelength 590 nm passes through a diffraction grating and makes an interference pattern on a screen 80 cm away. The first bright fringes are 1.9 cm from the center of the pattern....
-
What is speed stability?
-
Equation 3.9 indicates that the choice as to whether to convert from a deductible IRA into a Roth IRA when the taxpayer expects his future tax rate to decline depends on the relative magnitude of the...
-
Given that 57.7 fex is equal to 1 gal and that 14.3 glo is equal to 1 day, how many cL/hr are there in 0.568 fex/glo? ( NOTE: A fex and glo are are both fictitious units of volume and time,...
-
2. EMORY ALUMINUM The Emory Aluminum company rolls and sells aluminum foil in several widths. (Length is the same for all orders). Customers can order rolls of foil 24 inches, 20 inches, 12 inches,...
-
Excel A1 File 2 8 0 9 McGraw Hill Excel Question - Saved Home Insert Draw X A < Cash Accounts receivable Office supplies Office equipment 10 Land 11 Accounts payable 12 Common stock 13 Cash...
-
1)Consider the crowding out model. Assume there are men and women in the labor force and three occupations: preschool, elementary and secondary teachers. Suppose only women can work as elementary and...
-
What type of cost does not change with changes in production volume?
-
An aluminum-alloy rod has a length of 9.2293 cm at 20.00C and a length of 9.2767 cm at the boiling point of water. (a) What is the length of the rod at the freezing point of water? (b) What is the...
-
1. Why have neo-classical economists generally argued that international economic relations are not zero-sum in character? What theoretical frameworks have they used to support this argument? It's...
-
In some labor markets, the supply of labor is as follows (where W represents wages and L represents the number of employees): W = 113 + 0.21L However, the demand for labor is: W = 958 -0.28L a) At...
-
Find the rule that describes the piecease-defined function Write the rule for the function. Select the correct choice below and S8 in the answer boxes to complete your choice (Type an exact answer...
-
How is use of the word consistent helpful in fraud reports?
-
Discuss the concept of stockout costs. How can a stockout cost be calculated?
-
Discuss the order delivery stage of the order cycle.
-
Discuss how technological considerations can help in managing truck drivers and their productivity.
-
Determine the probability mass function of \(X\) from the following cumulative distribution function: \[ F(x)=\left\{\begin{array}{lr} 0 & x. \] Figure 3.3 displays a plot of \(F(x)\). From the plot,...
-
The probability that a wafer contains a large particle of contamination is 0.01. If it is assumed that the wafers are independent, what is the probability that exactly 125 wafers need to be analyzed...
-
Two new product designs are to be compared on the basis of revenue potential. Marketing believes that the revenue from design A can be predicted quite accurately to be \(\$ 3\) million. The revenue...

Study smarter with the SolutionInn App