

1) Management of ABC Movie Theaters, Inc. is interested in analyzing the relationship between weekly revenue...
Fantastic news! We've Found the answer you've been seeking!
Question:
Transcribed Image Text:
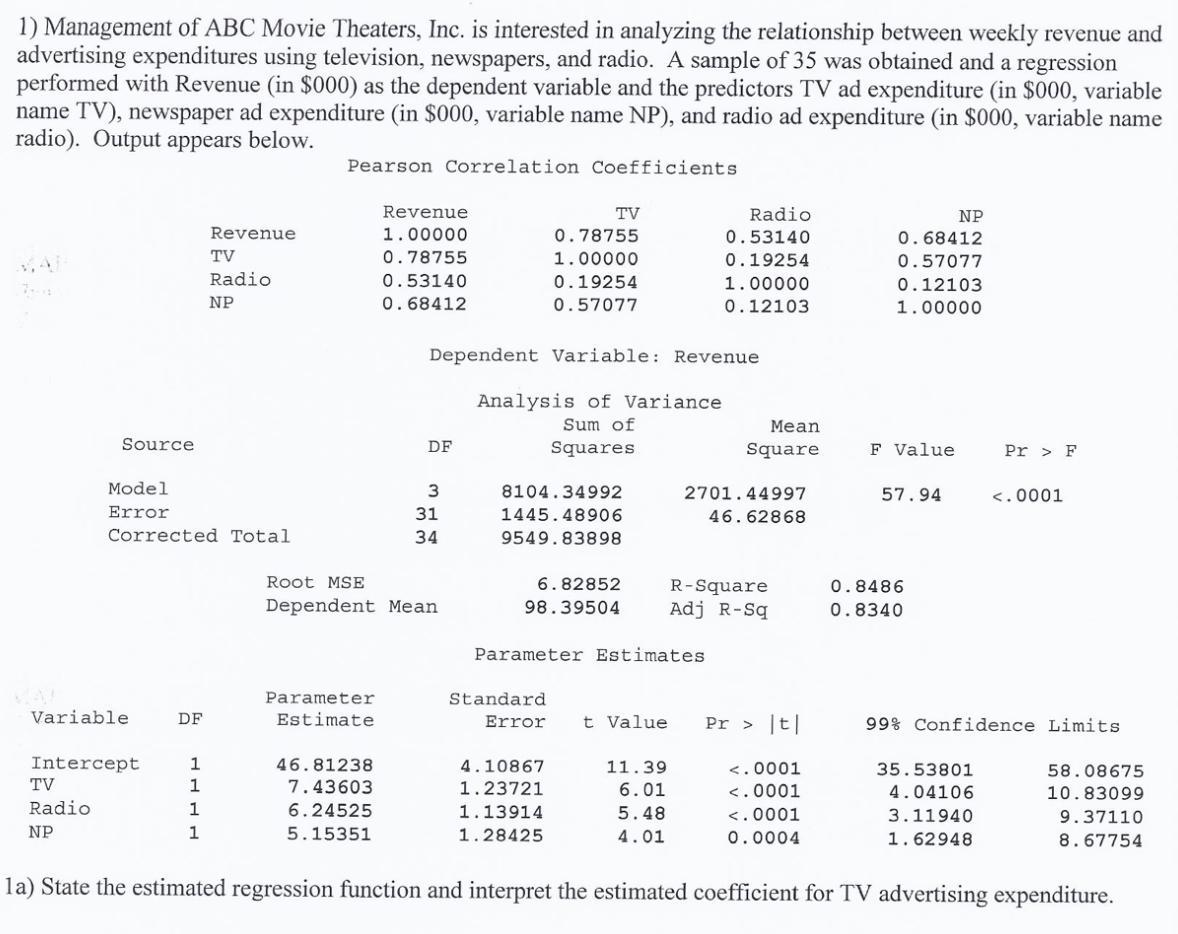
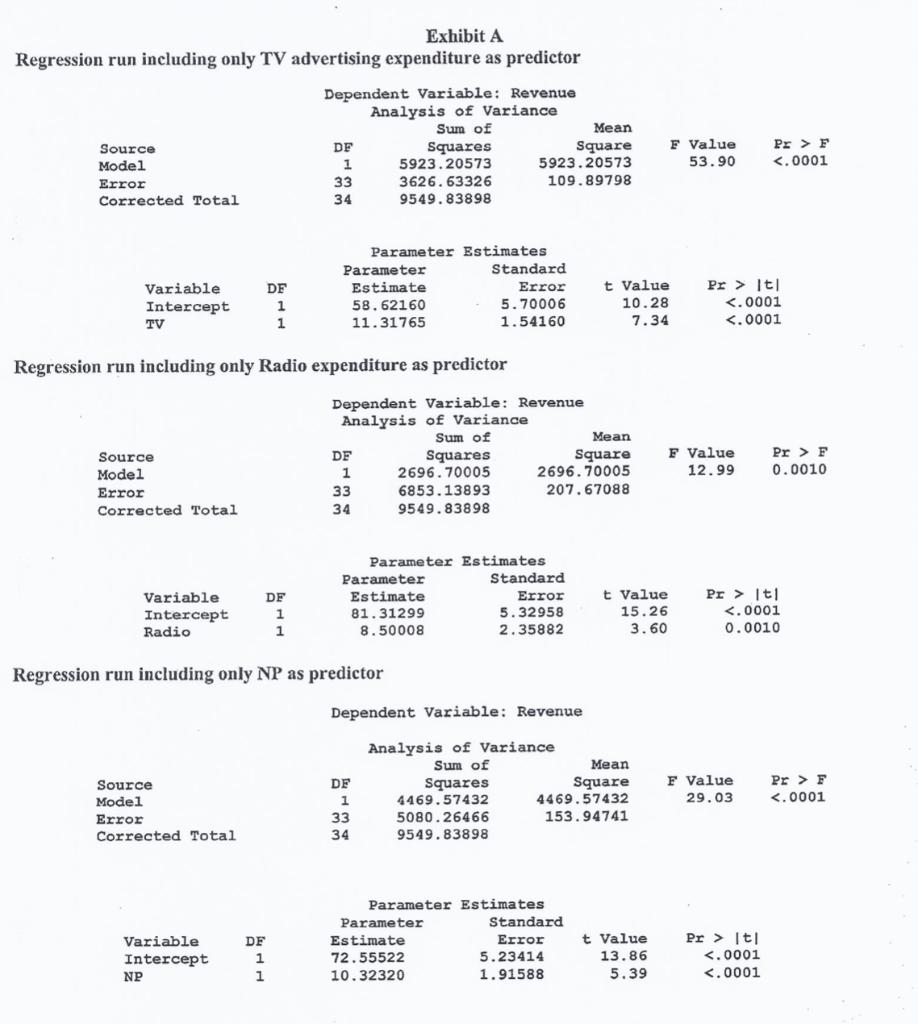
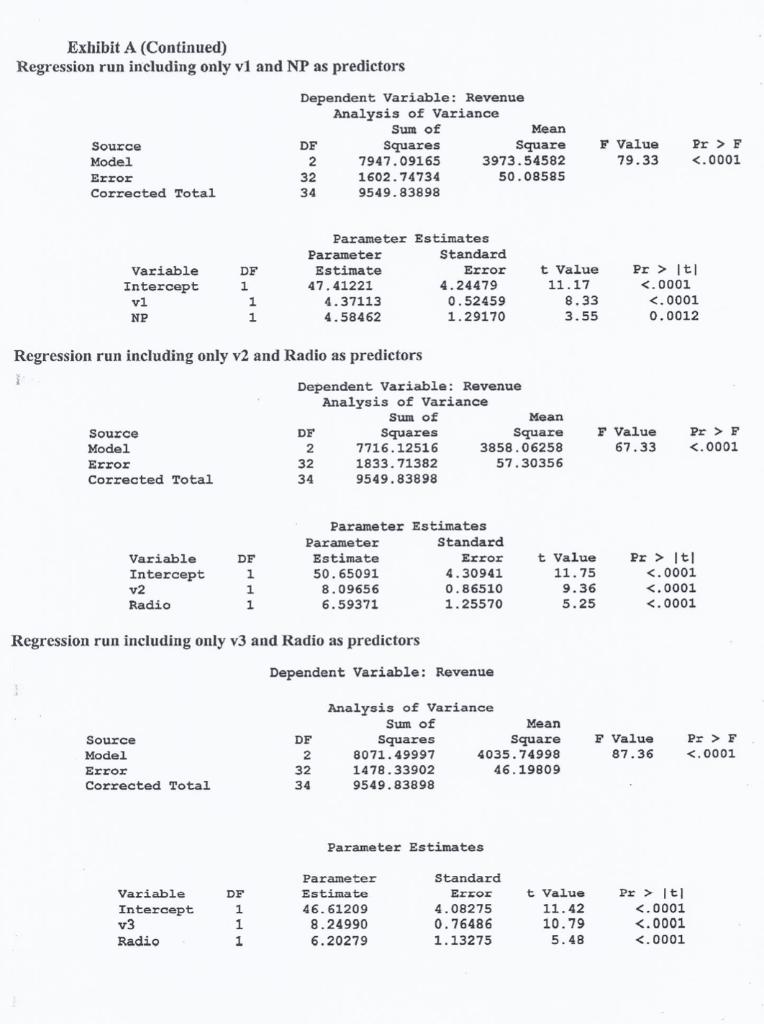
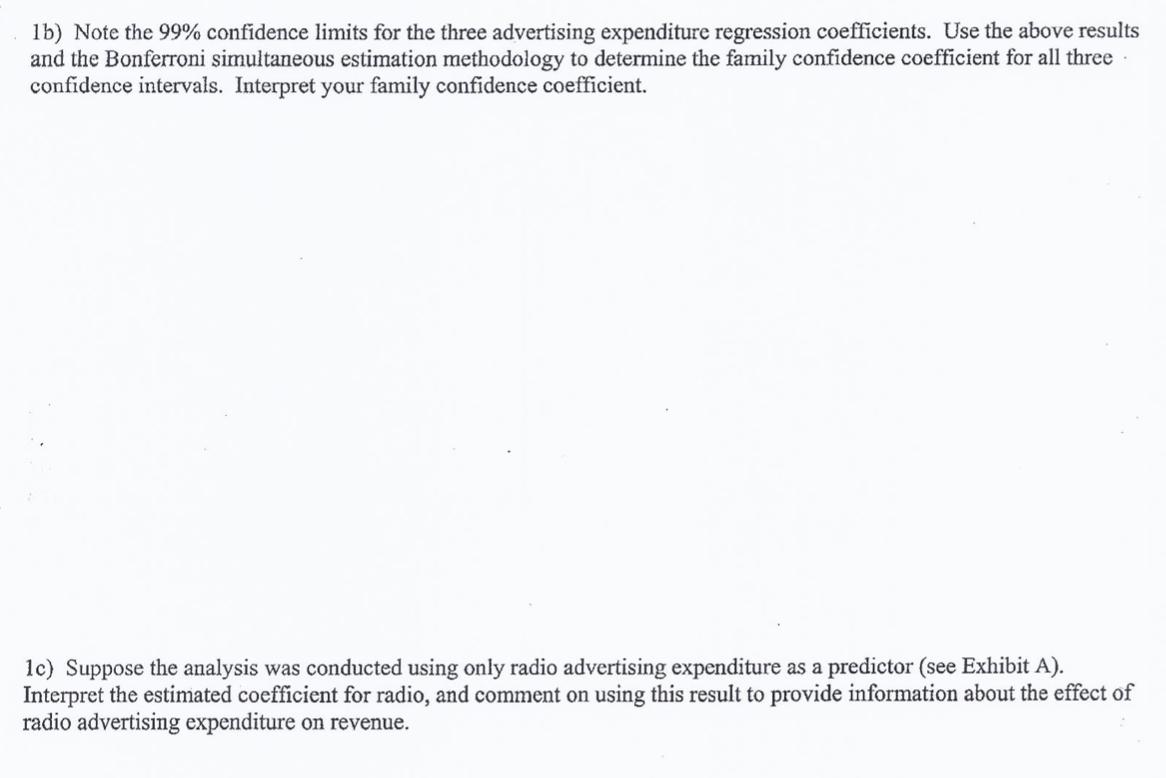
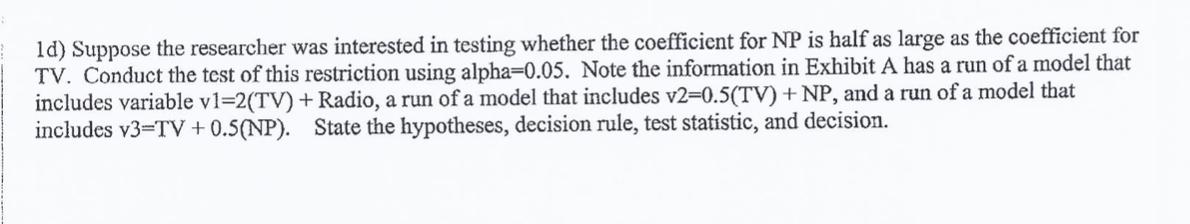
1) Management of ABC Movie Theaters, Inc. is interested in analyzing the relationship between weekly revenue and advertising expenditures using television, newspapers, and radio. A sample of 35 was obtained and a regression performed with Revenue (in $000) as the dependent variable and the predictors TV ad expenditure (in $000, variable name TV), newspaper ad expenditure (in $000, variable name NP), and radio ad expenditure (in $000, variable name radio). Output appears below. Pearson Correlation Coefficients Source Variable Model Error Corrected Total DF Intercept Revenue TV Radio NP 1 1 1 1 Parameter Estimate Revenue 1.00000 0.78755 0.53140 0.68412 46.81238 7.43603 6.24525 5.15351 DF Root MSE Dependent Mean 3 31 34 Dependent Variable: Revenue Analysis of Variance Sum of Squares TV 0.78755 1.00000 0.19254 0.57077 8104.34992 1445.48906 9549.83898 6.82852 98.39504 Standard Parameter Estimates Error t Value Radio 0.53140 0.19254 1.00000 0.12103 11.39 6.01 5.48 4.01 Mean Square 2701.44997 46.62868 R-Square Adj R-Sq Pr > |t| <.0001 <.0001 <.0001 0.0004 0.68412 0.57077 0.12103 1.00000 F Value 57.94 NP 0.8486 0.8340 4.10867 1.23721 TV Radio NP 1.13914 1.28425 la) State the estimated regression function and interpret the estimated coefficient for TV advertising expenditure. Pr > F <.0001 99% Confidence Limits 35.53801 4.04106 3.11940 1.62948 58.08675 10.83099 9.37110 8.67754 Exhibit A Regression run including only TV advertising expenditure as predictor Source Model Error Corrected Total Variable Intercept TV Source Model Error Corrected Total Variable Intercept Radio Source Model Error Corrected Total NP Variable Intercept DF 1 1 Regression run including only Radio expenditure as predictor DF 1 1 Dependent Variable: Revenue Analysis of Variance Sum of Squares 5923.20573 3626.63326 9549.83898 DF 1 1 DF 1 33 34 Parameter Estimate 58.62160 11.31765 DF 1 Parameter Estimates. 33 34 Regression run including only NP as predictor Dependent Variable: Revenue Analysis of Variance Sum of Squares 2696.70005 6853.13893 9549.83898 Parameter Estimate 81.31299 8.50008 DF 1 33 34 Mean Square 5923.20573 109.89798 Parameter Estimates Standard Error 5.70006 1.54160 4469.57432 5080.26466 9549.83898 Dependent Variable: Revenue Analysis of Variance Sum of Squares Parameter Estimate 72.55522 10.32320 Mean Square 2696.70005 207.67088 Standard Error 5.32958 2.35882 Parameter Estimates. Standard Error t Value 10.28 7.34 Mean Square 4469.57432 153.94741 5.23414 1.91588 t Value 15.26 3.60 t Value 13.86 5.39 F Value 53.90 F Value 12.99 Pr > It| <.0001 <.0001 Pr > F <.0001 F Value 29.03 Pr > |t| <.0001 0.0010 Pr > |t| <.0001 <.0001 Pr > F 0.0010 Pr > F <.0001 Exhibit A (Continued) Regression run including only v1 and NP as predictors Source Model Error Corrected Total i Variable Intercept v1 NP Source Model Error Corrected Total Variable Intercept v2 Radio Source Model Error Corrected Total DF 1 Variable Intercept v3 Radio Regression run including only v2 and Radio as predictors 1 1 DF 1 1 1 DF Dependent Variable: Revenue Analysis of Variance Sum of Squares 7947.09165 1602.74734 9549.83898 1 1 1 DF 2 32 34 Parameter Estimate 47.41221 Parameter Estimates. Standard Error DF 2 32 34 4.37113 4.58462 Regression run including only v3 and Radio as predictors Parameter Estimate 50.65091 DF 2 32 34 Dependent Variable: Revenue Analysis of Variance Sum of Squares 7716.12516 1833.71382 9549.83898 8.09656 6.59371 3973.54582 50.08585 4.24479 Parameter Estimates 0.52459 1.29170 Parameter Estimate 46.61209 8.24990 6.20279 Dependent Variable: Revenue Standard Error 4.30941 0.86510 1.25570 3858.06258 57.30356 Analysis of Variance Sum of Squares 8071.49997 1478.33902 9549.83898 Mean Square Parameter Estimates Standard Error t Value 11.17 4.08275 0.76486 1.13275 Mean Square 4035.74998 46.19809 t Value 11.75 9.36 5.25 Mean Square 8.33 3.55 t Value 11.42 10.79 5.48 F Value 79.33 Pr > |t| <.0001 <.0001 0.0012 F Value 67.33 Pr > F <.0001 F Value 87.36 Pr > |t| <.0001 <.0001 <.0001 Pr > |t| <.0001 <.0001 <.0001 Pr > F <.0001 Pr > F <.0001 1b) Note the 99% confidence limits for the three advertising expenditure regression coefficients. Use the above results and the Bonferroni simultaneous estimation methodology to determine the family confidence coefficient for all three confidence intervals. Interpret your family confidence coefficient. 1c) Suppose the analysis was conducted using only radio advertising expenditure as a predictor (see Exhibit A). Interpret the estimated coefficient for radio, and comment on using this result to provide information about the effect of radio advertising expenditure on revenue. 1d) Suppose the researcher was interested in testing whether the coefficient for NP is half as large as the coefficient for TV. Conduct the test of this restriction using alpha-0.05. Note the information in Exhibit A has a run of a model that includes variable v1=2(TV) + Radio, a run of a model that includes v2=0.5(TV) + NP, and a run of a model that includes v3=TV + 0.5(NP). State the hypotheses, decision rule, test statistic, and decision. 1) Management of ABC Movie Theaters, Inc. is interested in analyzing the relationship between weekly revenue and advertising expenditures using television, newspapers, and radio. A sample of 35 was obtained and a regression performed with Revenue (in $000) as the dependent variable and the predictors TV ad expenditure (in $000, variable name TV), newspaper ad expenditure (in $000, variable name NP), and radio ad expenditure (in $000, variable name radio). Output appears below. Pearson Correlation Coefficients Source Variable Model Error Corrected Total DF Intercept Revenue TV Radio NP 1 1 1 1 Parameter Estimate Revenue 1.00000 0.78755 0.53140 0.68412 46.81238 7.43603 6.24525 5.15351 DF Root MSE Dependent Mean 3 31 34 Dependent Variable: Revenue Analysis of Variance Sum of Squares TV 0.78755 1.00000 0.19254 0.57077 8104.34992 1445.48906 9549.83898 6.82852 98.39504 Standard Parameter Estimates Error t Value Radio 0.53140 0.19254 1.00000 0.12103 11.39 6.01 5.48 4.01 Mean Square 2701.44997 46.62868 R-Square Adj R-Sq Pr > |t| <.0001 <.0001 <.0001 0.0004 0.68412 0.57077 0.12103 1.00000 F Value 57.94 NP 0.8486 0.8340 4.10867 1.23721 TV Radio NP 1.13914 1.28425 la) State the estimated regression function and interpret the estimated coefficient for TV advertising expenditure. Pr > F <.0001 99% Confidence Limits 35.53801 4.04106 3.11940 1.62948 58.08675 10.83099 9.37110 8.67754 Exhibit A Regression run including only TV advertising expenditure as predictor Source Model Error Corrected Total Variable Intercept TV Source Model Error Corrected Total Variable Intercept Radio Source Model Error Corrected Total NP Variable Intercept DF 1 1 Regression run including only Radio expenditure as predictor DF 1 1 Dependent Variable: Revenue Analysis of Variance Sum of Squares 5923.20573 3626.63326 9549.83898 DF 1 1 DF 1 33 34 Parameter Estimate 58.62160 11.31765 DF 1 Parameter Estimates. 33 34 Regression run including only NP as predictor Dependent Variable: Revenue Analysis of Variance Sum of Squares 2696.70005 6853.13893 9549.83898 Parameter Estimate 81.31299 8.50008 DF 1 33 34 Mean Square 5923.20573 109.89798 Parameter Estimates Standard Error 5.70006 1.54160 4469.57432 5080.26466 9549.83898 Dependent Variable: Revenue Analysis of Variance Sum of Squares Parameter Estimate 72.55522 10.32320 Mean Square 2696.70005 207.67088 Standard Error 5.32958 2.35882 Parameter Estimates. Standard Error t Value 10.28 7.34 Mean Square 4469.57432 153.94741 5.23414 1.91588 t Value 15.26 3.60 t Value 13.86 5.39 F Value 53.90 F Value 12.99 Pr > It| <.0001 <.0001 Pr > F <.0001 F Value 29.03 Pr > |t| <.0001 0.0010 Pr > |t| <.0001 <.0001 Pr > F 0.0010 Pr > F <.0001 Exhibit A (Continued) Regression run including only v1 and NP as predictors Source Model Error Corrected Total i Variable Intercept v1 NP Source Model Error Corrected Total Variable Intercept v2 Radio Source Model Error Corrected Total DF 1 Variable Intercept v3 Radio Regression run including only v2 and Radio as predictors 1 1 DF 1 1 1 DF Dependent Variable: Revenue Analysis of Variance Sum of Squares 7947.09165 1602.74734 9549.83898 1 1 1 DF 2 32 34 Parameter Estimate 47.41221 Parameter Estimates. Standard Error DF 2 32 34 4.37113 4.58462 Regression run including only v3 and Radio as predictors Parameter Estimate 50.65091 DF 2 32 34 Dependent Variable: Revenue Analysis of Variance Sum of Squares 7716.12516 1833.71382 9549.83898 8.09656 6.59371 3973.54582 50.08585 4.24479 Parameter Estimates 0.52459 1.29170 Parameter Estimate 46.61209 8.24990 6.20279 Dependent Variable: Revenue Standard Error 4.30941 0.86510 1.25570 3858.06258 57.30356 Analysis of Variance Sum of Squares 8071.49997 1478.33902 9549.83898 Mean Square Parameter Estimates Standard Error t Value 11.17 4.08275 0.76486 1.13275 Mean Square 4035.74998 46.19809 t Value 11.75 9.36 5.25 Mean Square 8.33 3.55 t Value 11.42 10.79 5.48 F Value 79.33 Pr > |t| <.0001 <.0001 0.0012 F Value 67.33 Pr > F <.0001 F Value 87.36 Pr > |t| <.0001 <.0001 <.0001 Pr > |t| <.0001 <.0001 <.0001 Pr > F <.0001 Pr > F <.0001 1b) Note the 99% confidence limits for the three advertising expenditure regression coefficients. Use the above results and the Bonferroni simultaneous estimation methodology to determine the family confidence coefficient for all three confidence intervals. Interpret your family confidence coefficient. 1c) Suppose the analysis was conducted using only radio advertising expenditure as a predictor (see Exhibit A). Interpret the estimated coefficient for radio, and comment on using this result to provide information about the effect of radio advertising expenditure on revenue. 1d) Suppose the researcher was interested in testing whether the coefficient for NP is half as large as the coefficient for TV. Conduct the test of this restriction using alpha-0.05. Note the information in Exhibit A has a run of a model that includes variable v1=2(TV) + Radio, a run of a model that includes v2=0.5(TV) + NP, and a run of a model that includes v3=TV + 0.5(NP). State the hypotheses, decision rule, test statistic, and decision.
Expert Answer:
Answer rating: 100% (QA)
Analysis of covariance is used to test the main and interaction effects of categorical variables on a continuous dependent variable controlling for the effects of selected other continuous variables w... View the full answer

Related Book For 

Business Statistics a decision making approach
ISBN: 978-0133021844
9th edition
Authors: David F. Groebner, Patrick W. Shannon, Phillip C. Fry
Posted Date:
Students also viewed these accounting questions
-
A regression analysis attempting to link dependent variable y to independent variables x 1 and x 2 produced the estimated regression equation y = 59.89 + 8.11x 1 + 5.67x 2 Below is the ANOVA table...
-
In the regression model below, the dependent variable is the revenues each year (the t subscript is used as a general term for a year). The independent variables are the expenses for last year (t-1),...
-
A regression analysis has produced the following analysis of variance table: a. Compute se and s2. b. Compute SST. c. Compute R2 and the adjusted coefficient of determination. Analysis of Variance...
-
State the degree and leading coefficient of the polynomial f(x) = 4 + x = 2x 2 - 7x 3 .
-
Repeat Exercise 1 using Algorithm 6.3. In Exercise 1 a. x1 5x2 + x3 = 7, 10x1 + 20x3 = 6, 5x1 x3 = 4 b. x1 + x2 x3 = 1, x1 + x2 + 4x3 = 2, 2x1 x2 + 2x3 = 3 c. 2x1 3x2 + 2x3 = 5, 4x1 + 2x2 6x3 =...
-
Evaluate the integral. fx x + c dx
-
Given the following results from a \(2^{3}\) factorial experiment, Interpret the effects based on the confidence intervals. Factor A Factor B Factor C Rep. I Rep. 2 -1 13.8 14.6 10.8 8.4 1 9.0 9.8 1...
-
Ryan Company wishes to prepare a forecasted income statement, balance sheet, and statement of cash flows for 2012. Ryans balance sheet and income statement for 2011 follow: Balance Sheet 2011 Cash ....
-
What are some strategies to make use of Opportunities to minimize the Weaknesses of the company Revlon? What are some strategies to minimize the potential dangers lying in sectors where Weaknesses...
-
Describe three modern canons of statutory construction and three historical common law canons. Briefly distinguish formalism and realism as bases for the interpretation of legal texts. Explain the...
-
Could you elucidate the significance of information technology within the supply chain, delineating its multifaceted role and impact on operational efficiency and strategic decision-making processes?
-
You observe a stock price of $18.75. You expect a dividend growth rate of 5% and the most recent dividend paid was $1.50. What is the "implied" required return?
-
Two lives aged x and y take out a policy that will pay out 15,000 on the death of (x) provided that (y) has died at least 5 years earlier and no more than 15 years earlier. (1) Express the present...
-
11. Solve using quadratic formula a) 4x + 6(4-x) = 5 b) 8 (52x) + 8(5x) = 6
-
Describe in detail how excessive praise might influence child development in negative ways. Tie this in with Erikson's ideas about Industry v Inferiority. How might excessive and unrealistic praise...
-
We start with some review problems A crate of mass 2 2 . 6 kg rests on a level surface, with a coefficient of kinetic friction 0 . 2 9 2 . You push on the crate with an applied force of 3 8 4 N ....
-
There are specific rules that apply to issuing and completing the Record of Employment ( ROE ) for commission employees who are paid by commission only. In your own words, explain how to complete...
-
Determine the resultant moment produced by the forces about point O. 0.25 m 0.125 m, 0 0.3 m- 60 F = 500 N F = 600 N
-
A manager is interested in testing whether three populations of interest have equal population means. Simple random samples of size 10 were selected from each population. The following ANOVA table...
-
Compute the correlation matrix for these data. Develop the decision rule for testing the significance of each coefficient. Which, if any, correlations are not significant? Use = 0.05. The J. J....
-
Hubble Construction Company has submitted a bid on a state government project that is to be funded by the federal governments stimulus money in Arizona. The price of the bid was predetermined in the...
-
Two projects of equal value have been evaluated using a multifactor productivity measure that combined labor-hours at \($30\) per hour and overhead expense calculated as 20% of labor expense for the...
-
One road-paving crew of six people worked 8 hours to pave 25 miles of two-lane road, while a smaller crew of four people worked 12 hours to pave 15 miles of four- lane road. Which crew was more...
-
The Bankston fulfilment center of Universal Logistics is a large warehouse that packs and ships customer orders from client on-line retailers. Five employees have been nominated for a productivity...

Study smarter with the SolutionInn App