

Place a control button in the worksheet that calls a VBA macro that processes the following...
Fantastic news! We've Found the answer you've been seeking!
Question:
Transcribed Image Text:
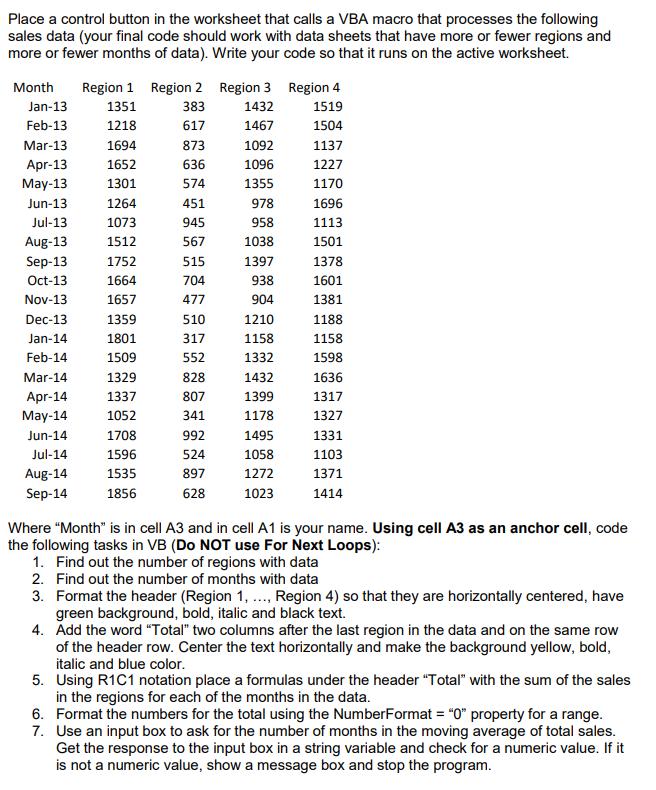
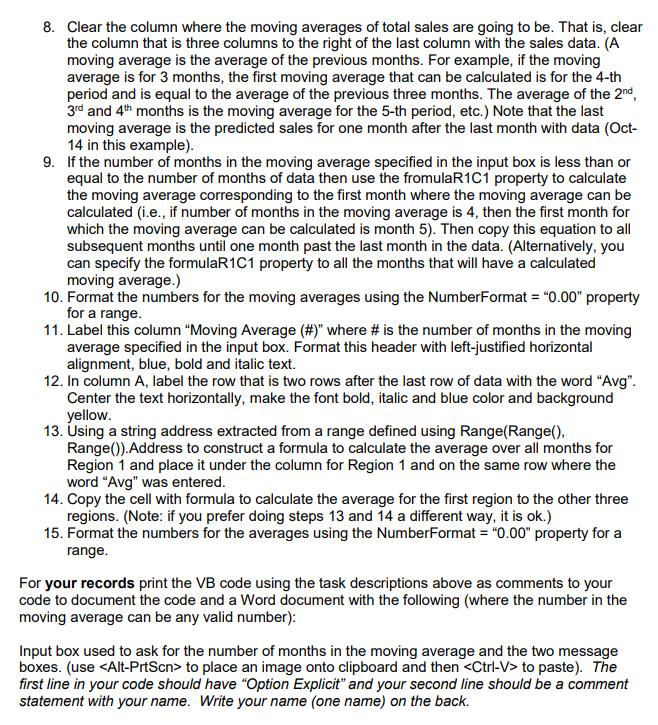
Place a control button in the worksheet that calls a VBA macro that processes the following sales data (your final code should work with data sheets that have more or fewer regions and more or fewer months of data). Write your code so that it runs on the active worksheet. Month Region 1 1351 1218 Mar-13 1694 Apr-13 1652 May-13 1301 Jun-13 1264 Jul-13 1073 Aug-13 1512 Sep-13 Oct-13 Nov-13 Jan-13 Feb-13 1752 1664 1657 Dec-13 1359 Jan-14 1801 Feb-14 1509 Mar-14 1329 Apr-14 1337 May-14 1052 Jun-14 1708 Jul-14 1596 Aug-14 1535 Sep-14 1856 Region 2 383 617 873 636 574 451 945 567 515 704 477 510 317 552 828 807 341 992 524 897 628 Region 3 1432 1467 1092 1096 1355 978 958 1038 1397 938 904 1210 1158 1332 1432 1399 1178 1495 1058 1272 1023 Region 4 1519 1504 1137 1227 1170 1696 1113 1501 1378 1601 1381 1188 1158 1598 1636 1317 1327 1331 1103 1371 1414 Where "Month" is in cell A3 and in cell A1 is your name. Using cell A3 as an anchor cell, code the following tasks in VB (Do NOT use For Next Loops): 1. Find out the number of regions with data 2. Find out the number of months with data 3. Format the header (Region 1, ..., Region 4) so that they are horizontally centered, have green background, bold, italic and black text. 4. Add the word "Total" two columns after the last region in the data and on the same row of the header row. Center the text horizontally and make the background yellow, bold, italic and blue color. 5. Using R1C1 notation place a formulas under the header "Total" with the sum of the sales in the regions for each of the months in the data. 6. Format the numbers for the total using the NumberFormat="0" property for a range. 7. Use an input box to ask for the number of months in the moving average of total sales. Get the response to the input box in a string variable and check for a numeric value. If it is not a numeric value, show a message box and stop the program. 8. Clear the column where the moving averages of total sales are going to be. That is, clear the column that is three columns to the right of the last column with the sales data. (A moving average is the average of the previous months. For example, if the moving average is for 3 months, the first moving average that can be calculated is for the 4-th period and is equal to the average of the previous three months. The average of the 2nd, 3rd and 4th months is the moving average for the 5-th period, etc.) Note that the last moving average is the predicted sales for one month after the last month with data (Oct- 14 in this example). 9. If the number of months in the moving average specified in the input box is less than or equal to the number of months of data then use the fromulaR1C1 property to calculate the moving average corresponding to the first month where the moving average can be calculated (i.e., if number of months in the moving average is 4, then the first month for which the moving average can be calculated is month 5). Then copy this equation to all subsequent months until one month past the last month in the data. (Alternatively, you can specify the formulaR1C1 property to all the months that will have a calculated moving average.) 10. Format the numbers for the moving averages using the NumberFormat = "0.00" property for a range. 11. Label this column "Moving Average (#)" where # is the number of months in the moving average specified in the input box. Format this header with left-justified horizontal alignment, blue, bold and italic text. 12. In column A, label the row that is two rows after the last row of data with the word "Avg". Center the text horizontally, make the font bold, italic and blue color and background yellow. 13. Using a string address extracted from a range defined using Range(Range(), Range()). Address to construct a formula to calculate the average over all months for Region 1 and place it under the column for Region 1 and on the same row where the word "Avg" was entered. 14. Copy the cell with formula to calculate the average for the first region to the other three regions. (Note: if you prefer doing steps 13 and 14 a different way, it is ok.) 15. Format the numbers for the averages using the NumberFormat = "0.00" property for a range. For your records print the VB code using the task descriptions above as comments to your code to document the code and a Word document with the following (where the number in the moving average can be any valid number): Input box used to ask for the number of months in the moving average and the two message boxes. (use <Alt-PrtScn> to place an image onto clipboard and then <Ctrl-V> to paste). The first line in your code should have "Option Explicit" and your second line should be a comment statement with your name. Write your name (one name) on the back. Place a control button in the worksheet that calls a VBA macro that processes the following sales data (your final code should work with data sheets that have more or fewer regions and more or fewer months of data). Write your code so that it runs on the active worksheet. Month Region 1 1351 1218 Mar-13 1694 Apr-13 1652 May-13 1301 Jun-13 1264 Jul-13 1073 Aug-13 1512 Sep-13 Oct-13 Nov-13 Jan-13 Feb-13 1752 1664 1657 Dec-13 1359 Jan-14 1801 Feb-14 1509 Mar-14 1329 Apr-14 1337 May-14 1052 Jun-14 1708 Jul-14 1596 Aug-14 1535 Sep-14 1856 Region 2 383 617 873 636 574 451 945 567 515 704 477 510 317 552 828 807 341 992 524 897 628 Region 3 1432 1467 1092 1096 1355 978 958 1038 1397 938 904 1210 1158 1332 1432 1399 1178 1495 1058 1272 1023 Region 4 1519 1504 1137 1227 1170 1696 1113 1501 1378 1601 1381 1188 1158 1598 1636 1317 1327 1331 1103 1371 1414 Where "Month" is in cell A3 and in cell A1 is your name. Using cell A3 as an anchor cell, code the following tasks in VB (Do NOT use For Next Loops): 1. Find out the number of regions with data 2. Find out the number of months with data 3. Format the header (Region 1, ..., Region 4) so that they are horizontally centered, have green background, bold, italic and black text. 4. Add the word "Total" two columns after the last region in the data and on the same row of the header row. Center the text horizontally and make the background yellow, bold, italic and blue color. 5. Using R1C1 notation place a formulas under the header "Total" with the sum of the sales in the regions for each of the months in the data. 6. Format the numbers for the total using the NumberFormat="0" property for a range. 7. Use an input box to ask for the number of months in the moving average of total sales. Get the response to the input box in a string variable and check for a numeric value. If it is not a numeric value, show a message box and stop the program. 8. Clear the column where the moving averages of total sales are going to be. That is, clear the column that is three columns to the right of the last column with the sales data. (A moving average is the average of the previous months. For example, if the moving average is for 3 months, the first moving average that can be calculated is for the 4-th period and is equal to the average of the previous three months. The average of the 2nd, 3rd and 4th months is the moving average for the 5-th period, etc.) Note that the last moving average is the predicted sales for one month after the last month with data (Oct- 14 in this example). 9. If the number of months in the moving average specified in the input box is less than or equal to the number of months of data then use the fromulaR1C1 property to calculate the moving average corresponding to the first month where the moving average can be calculated (i.e., if number of months in the moving average is 4, then the first month for which the moving average can be calculated is month 5). Then copy this equation to all subsequent months until one month past the last month in the data. (Alternatively, you can specify the formulaR1C1 property to all the months that will have a calculated moving average.) 10. Format the numbers for the moving averages using the NumberFormat = "0.00" property for a range. 11. Label this column "Moving Average (#)" where # is the number of months in the moving average specified in the input box. Format this header with left-justified horizontal alignment, blue, bold and italic text. 12. In column A, label the row that is two rows after the last row of data with the word "Avg". Center the text horizontally, make the font bold, italic and blue color and background yellow. 13. Using a string address extracted from a range defined using Range(Range(), Range()). Address to construct a formula to calculate the average over all months for Region 1 and place it under the column for Region 1 and on the same row where the word "Avg" was entered. 14. Copy the cell with formula to calculate the average for the first region to the other three regions. (Note: if you prefer doing steps 13 and 14 a different way, it is ok.) 15. Format the numbers for the averages using the NumberFormat = "0.00" property for a range. For your records print the VB code using the task descriptions above as comments to your code to document the code and a Word document with the following (where the number in the moving average can be any valid number): Input box used to ask for the number of months in the moving average and the two message boxes. (use <Alt-PrtScn> to place an image onto clipboard and then <Ctrl-V> to paste). The first line in your code should have "Option Explicit" and your second line should be a comment statement with your name. Write your name (one name) on the back.
Expert Answer:

Related Book For 

Statistics for Business and Economics
ISBN: 978-0134506593
13th edition
Authors: James T. McClave, P. George Benson, Terry Sincich
Posted Date:
Students also viewed these accounting questions
-
1. Did The Home Depot have more or fewer authorized common shares than Rona Inc. at the beginning of the fiscal year-end 2013? 2. From the Retained Earnings column in the Statement of Shareholders'...
-
Start Excel. Download and open the file named Exp19_Excel_Ch09_Cap_HouseCleaners.xfsx. Grader has automatically added your last name to the beginning of the filename. 1 2 The title and column labels...
-
(a) Find each sum. 1 + 2 + 3 + 4 + 5 = ? 1 + 2 + 3 + 4 + 5 + 6 + 7 + 8 = ? 1 + 2 + 3 + 4 + 5 + 6 + 7 + 8 + 9 + 10 = ? (b) Use the formula below for the sum of the first n natural numbers to verify...
-
S1 Ltd and S2 Ltd belong to the same capital gains group. In May 2014, S1 Ltd transferred a chargeable asset to S2 Ltd. This asset had originally cost 10,000 and its market value in May 2014 was...
-
Suggest indicators that could be used to assess an improvement in efficiency in each of the following areas: a. Reduce the energy used in production of goods and services b. Reduce the material...
-
Explain whether each of the following is a perfectly competitive market. For each market that is not perfectly competitive, explain why it is not. a. Tomato growing b. Coffee shops c. Automobile...
-
A single pressure transmitter (1oo1) is being used in a SIF to initiate a trip when the pressure output signal goes below 6 mA. This transmitter is connected to a safety PLC that is programmed to...
-
Jaguar Land Rover Automotive PLC (JLR) is a maker of luxury autos based in Coventry, United Kingdom. JLR uses IFRS and has a fiscal yearend of March 31. You have been asked to use your knowledge of...
-
Match each definition with its related term by selecting the appropriate term in the dropdown provided. 1. Actual Accounting System Term 2. Direct Labor Efficiency Variance 3. Direct Labor Rate...
-
Assests A, B, C, and D's prices and payoff are given below Construct TWO different trading strategies if there are arbitrage opportunities. $1 $1 $2.6 E A $2 $0 $2.3 B $1 $1 $3.5 $2 $0 $3 $0.7 D $0...
-
Suppose that there are 10 identical firms in a perfectly competitive market. Each firm has a total cost function of TC = 560 + 0.25q2, where q is a firms output. The market demand function is QD =...
-
A company budgets sales for the next three months as follows. The company's sales are 40% for cash and 60% on credit. All credit sales are fully collected in the month after the sale. Total sales...
-
Schultz Incorporated ("Schultz") is a California manufacturer. Schultz employs several hourly, nonexempt workers in assembly-line positions. As a result, they are entitled to receive meal and rest...
-
1. For a time series with horizontal pattern, methods that are generally used for forecasting are: a. Simple linear regression and multiple regression b. Holt's linear exponential smoothing c. Moving...
-
How many questions should you expect to see and how much time do you have to answer them? What are all of the content topics covered? What percentage of each content topic will you see? Familiarize...
-
The ACA expanded insurance coverage by creating health care exchanges or marketplaces. These were intended primarily for individuals that could not gain insurance through their employer. What was the...
-
Problem 1 (a) Draw a free-body diagram for the skydiver in Problem 4 of Chapter 5. (b) What is the magnitude of the air drag force on the skydiver, after he reaches terminal speed? Problem 2 A person...
-
Representative data read from a plot that appeared in the paper Effect of Cattle Treading on Erosion from Hill Pasture: Modeling Concepts and Analysis of Rainfall Simulator Data (Australian Journal...
-
The gross domestic product (GDP) is the total national output of goods and services valued at market prices. As such, the GDP is a commonly used barometer of the U.S. economy. One component of the...
-
Calculate the percentage of the population sampled and the finite population correction factor for each of the following situations. a. n = 1,000, N = 2,500 b. n = 1,000, N = 5,000 c. n = 1,000, N =...
-
Refer to the Financial Analysts Journal (July/August 2008) study of earnings forecasts of buy-side and sell-side analysts, Exercise 2.86 (p. 88). Recall that data were collected on 3,526 forecasts...
-
For many years, womens professional basketball struggled for consistency in the United States. Since 1978, when the Womens Professional Basketball League (WBL) was formed, leagues have had difficulty...
-
What are the five forms of financing, and how is each used within sport?
-
That financial ratios are most valuable when viewed in comparison to the organizations historical ratio values and competitors values. Why is this context valuable when examining financial ratio...

Study smarter with the SolutionInn App