

You are investigating the potential impacts of urbanization on water quality and macroinvertebrate diversity in rivers...
Fantastic news! We've Found the answer you've been seeking!
Question:
Transcribed Image Text:
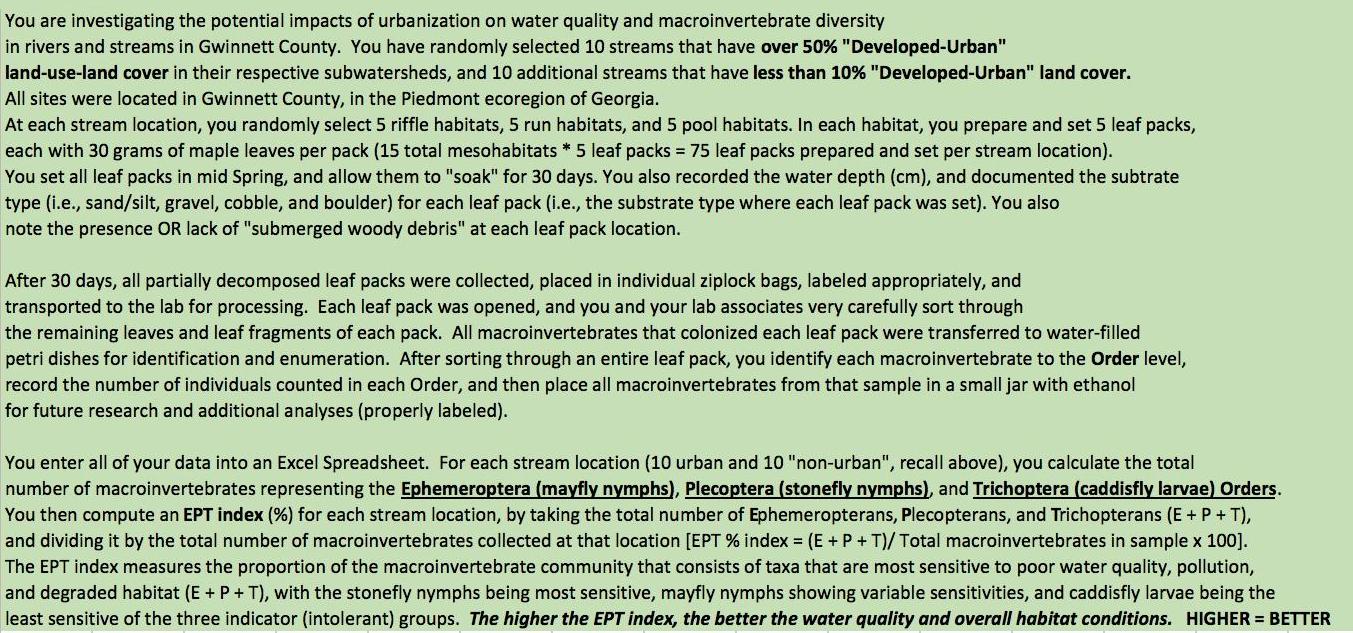
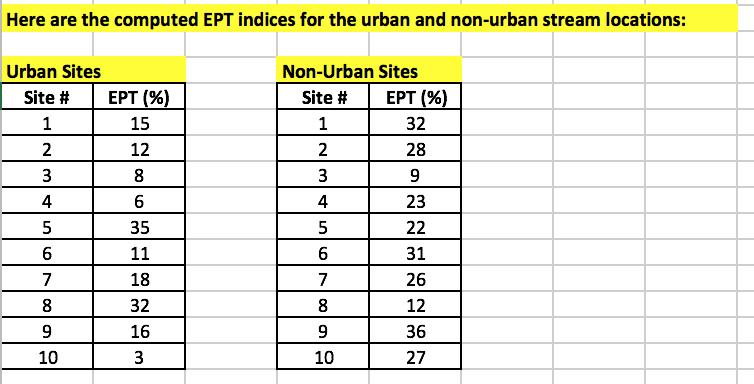
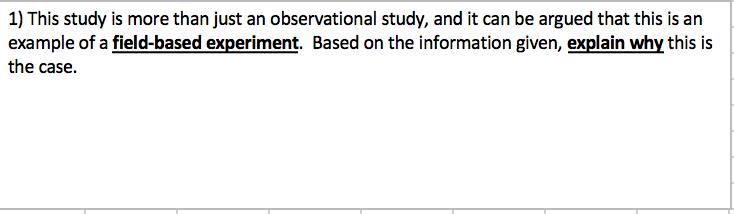
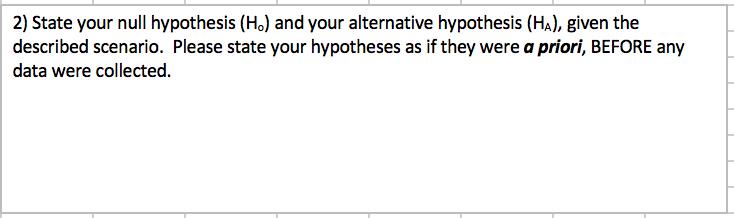
You are investigating the potential impacts of urbanization on water quality and macroinvertebrate diversity in rivers and streams in Gwinnett County. You have randomly selected 10 streams that have over 50% Developed-Urban land-use-land cover in their respective subwatersheds, and 10 additional streams that have less than 10% Developed-Urban land cover. All sites were located in Gwinnett County, in the Piedmont ecoregion of Georgia. At each stream location, you randomly select 5 riffle habitats, 5 run habitats, and 5 pool habitats. In each habitat, you prepare and set 5 leaf packs, each with 30 grams of maple leaves per pack (15 total mesohabitats * 5 leaf packs = 75 leaf packs prepared and set per stream location). You set all leaf packs in mid Spring, and allow them to soak for 30 days. You also recorded the water depth (cm), and documented the subtrate type (i.e., sand/silt, gravel, cobble, and boulder) for each leaf pack (i.e., the substrate type where each leaf pack was set). You also note the presence OR lack of submerged woody debris at each leaf pack location. After 30 days, all partially decomposed leaf packs were collected, placed in individual ziplock bags, labeled appropriately, and transported to the lab for processing. Each leaf pack was opened, and you and your lab associates very carefully sort through the remaining leaves and leaf fragments of each pack. All macroinvertebrates that colonized each leaf pack were transferred to water-filled petri dishes for identification and enumeration. After sorting through an entire leaf pack, you identify each macroinvertebrate to the Order level, record the number of individuals counted in each Order, and then place all macroinvertebrates from that sample in a small jar with ethanol for future research and additional analyses (properly labeled). Spreadsheet. For each stream location (10 urban and an , recall above), you calculate the tota You enter all of your into an number of macroinvertebrates representing the Ephemeroptera (mayfly nymphs), Plecoptera (stonefly nymphs), and Trichoptera (caddisfly larvae) Orders. You then compute an EPT index (%) for each stream location, by taking the total number of Ephemeropterans, Plecopterans, and Trichopterans (E + P + T), and dividing it by the total number of macroinvertebrates collected at that location [EPT % index = (E + P + T)/ Total macroinvertebrates in sample x 100]. The EPT index measures the proportion of the macroinvertebrate community that consists of taxa that are most sensitive to poor water quality, pollution, and degraded habitat (E + P + T), with the stonefly nymphs being most sensitive, mayfly nymphs showing variable sensitivities, and caddisfly larvae being the least sensitive of the three indicator (intolerant) groups. The higher the EPT index, the better the water quality and overall habitat conditions. HIGHER = BETTER Here are the computed EPT indices for the urban and non-urban stream locations: Urban Sites Site # 1 2 345 6 7 8 9 10 EPT (%) 15 12 8 6 35 11 18 32 16 3 Non-Urban Sites Site # 1 2 3 4 5 67 8 9 10 EPT (%) 32 28 9 23 22 31 26 12 36 27 1) This study is more than just an observational study, and it can be argued that this is an example of a field-based experiment. Based on the information given, explain why this is the case. 2) State your null hypothesis (H.) and your alternative hypothesis (HA), given the described scenario. Please state your hypotheses as if they were a priori, BEFORE any data were collected. 3) Using the data analysis function in Excel (see video tutorial), compute descriptive statistics for the urban and non-urban groups. Provide your output to the left, in this spreadsheet. 4) Conduct an F-Test Two-Sample For Variances first, to determine if variances in EPT differ between the urban and non-urban groups. Based on these results, perform the correct t-test to determine if the mean EPT is significantly different between the urban and non-urban groups. Provide all of your output to the left, in this spreadsheet. 5) Based on the results above (#4), do you reject or accept the null hypothesis? Explain. What is your overall conclusion? 6) You notice that two stream locations in urban areas had higher EPT values (35 and 32%), while two stream locations in non-urban areas had relatively lower EPT values (9 and 12%). How do you explain this? What could also be influencing EPT levels at these locations?????? 7) Construct a professional-looking bar chart, displaying the mean EPT (± S.E., Standard Error bars) for the two groups (urban vs. non-urban). Be sure to include x-axis and y-axis labels. You are investigating the potential impacts of urbanization on water quality and macroinvertebrate diversity in rivers and streams in Gwinnett County. You have randomly selected 10 streams that have over 50% Developed-Urban land-use-land cover in their respective subwatersheds, and 10 additional streams that have less than 10% Developed-Urban land cover. All sites were located in Gwinnett County, in the Piedmont ecoregion of Georgia. At each stream location, you randomly select 5 riffle habitats, 5 run habitats, and 5 pool habitats. In each habitat, you prepare and set 5 leaf packs, each with 30 grams of maple leaves per pack (15 total mesohabitats * 5 leaf packs = 75 leaf packs prepared and set per stream location). You set all leaf packs in mid Spring, and allow them to soak for 30 days. You also recorded the water depth (cm), and documented the subtrate type (i.e., sand/silt, gravel, cobble, and boulder) for each leaf pack (i.e., the substrate type where each leaf pack was set). You also note the presence OR lack of submerged woody debris at each leaf pack location. After 30 days, all partially decomposed leaf packs were collected, placed in individual ziplock bags, labeled appropriately, and transported to the lab for processing. Each leaf pack was opened, and you and your lab associates very carefully sort through the remaining leaves and leaf fragments of each pack. All macroinvertebrates that colonized each leaf pack were transferred to water-filled petri dishes for identification and enumeration. After sorting through an entire leaf pack, you identify each macroinvertebrate to the Order level, record the number of individuals counted in each Order, and then place all macroinvertebrates from that sample in a small jar with ethanol for future research and additional analyses (properly labeled). Spreadsheet. For each stream location (10 urban and an , recall above), you calculate the tota You enter all of your into an number of macroinvertebrates representing the Ephemeroptera (mayfly nymphs), Plecoptera (stonefly nymphs), and Trichoptera (caddisfly larvae) Orders. You then compute an EPT index (%) for each stream location, by taking the total number of Ephemeropterans, Plecopterans, and Trichopterans (E + P + T), and dividing it by the total number of macroinvertebrates collected at that location [EPT % index = (E + P + T)/ Total macroinvertebrates in sample x 100]. The EPT index measures the proportion of the macroinvertebrate community that consists of taxa that are most sensitive to poor water quality, pollution, and degraded habitat (E + P + T), with the stonefly nymphs being most sensitive, mayfly nymphs showing variable sensitivities, and caddisfly larvae being the least sensitive of the three indicator (intolerant) groups. The higher the EPT index, the better the water quality and overall habitat conditions. HIGHER = BETTER Here are the computed EPT indices for the urban and non-urban stream locations: Urban Sites Site # 1 2 345 6 7 8 9 10 EPT (%) 15 12 8 6 35 11 18 32 16 3 Non-Urban Sites Site # 1 2 3 4 5 67 8 9 10 EPT (%) 32 28 9 23 22 31 26 12 36 27 1) This study is more than just an observational study, and it can be argued that this is an example of a field-based experiment. Based on the information given, explain why this is the case. 2) State your null hypothesis (H.) and your alternative hypothesis (HA), given the described scenario. Please state your hypotheses as if they were a priori, BEFORE any data were collected. 3) Using the data analysis function in Excel (see video tutorial), compute descriptive statistics for the urban and non-urban groups. Provide your output to the left, in this spreadsheet. 4) Conduct an F-Test Two-Sample For Variances first, to determine if variances in EPT differ between the urban and non-urban groups. Based on these results, perform the correct t-test to determine if the mean EPT is significantly different between the urban and non-urban groups. Provide all of your output to the left, in this spreadsheet. 5) Based on the results above (#4), do you reject or accept the null hypothesis? Explain. What is your overall conclusion? 6) You notice that two stream locations in urban areas had higher EPT values (35 and 32%), while two stream locations in non-urban areas had relatively lower EPT values (9 and 12%). How do you explain this? What could also be influencing EPT levels at these locations?????? 7) Construct a professional-looking bar chart, displaying the mean EPT (± S.E., Standard Error bars) for the two groups (urban vs. non-urban). Be sure to include x-axis and y-axis labels.
Expert Answer:
Answer rating: 100% (QA)
File Home Insert Page Layout Formulas Data Review View Help 6 Share M7 fe A D E F G H K ... View the full answer

Related Book For 

Elementary Statistics Picturing the World
ISBN: 978-0321911216
6th edition
Authors: Ron Larson, Betsy Farber
Posted Date:
Students also viewed these biology questions
-
Prepare a science rough draft report on Water Quality and Contamination
-
You are investigating the possible benefits of a way-predicting level 1 cache. Assume that the 32 KB two-way set-associative single-banked level 1 data cache is currently the cycle time limiter. As...
-
You are investigating the report of a UFO landing in an isolated portion of New Mexico, and you encounter a strange object that is radiating sound waves uniformly in all directions. Assume that the...
-
Evaluate the integral (4e* + 2 In (2))dx.
-
Examine the diagram showing an a-helical protein structure in Section 2.13E. Between what specific atoms and of what functional groups are the hydrogen bonds formed that give the molecule its helical...
-
In Hollywood movies, it is common to have product placement (having products from sponsored companies, such as cars, appear in movies without telling viewers that these are commercials). As a...
-
Consider the property valuation data found in Table B.4. a. Use the all-possible-regressions method to find the "best" set of regressors. b. Use stepwise regression to select a subset regression...
-
A building contractor obtained bids for some asphalt paving, based on a specification. Three paving subcontractors quoted the following prices and ten of payment: The building contractor uses a 12%...
-
Standard Costing (Material and Labor Variances) ABC Company manufactures a chemical used for industrial maintenance. This chemical, which is sold by the drum. generally has a stable selling price....
-
The country of Emmental has three firms, whose information is displayed below (in thousands). Fill in the missing information (also in thousands). Assume that no international trade exists and that...
-
A jar of crunchy peanut butter contains 1.43kg of peanut butter. If von of the peanut butter for a sandwich, how many ounce take out of the container?
-
Discuss the information provided in the three main financial statements. And if you can only have access to one of these three statements in order to make a decision on whether to invest or not in a...
-
A property manager is preparing a monthly report pursuant to the terms of a property management agreement. This report details actual income received from rent and other fees, along with actual...
-
reply to this: hoose a king from the Divided Kingdom era that the Kings and Chronicles account both mention and write a thread. Provide a brief synopsis of the king's rule, then analyze how the...
-
What is a discount? How do you activate discounts? Activate discounts: Assign a discount account: 3. Discounts Given - What is the account type and detail type for this account?
-
What is driving the increase in the price of healthcare services today? Explain why it is important to know the scope of business being reviewed when using financial statements. Explain the content...
-
You will find the optimal regression tree for the dataset heart disease_train.csv and return its prediction to heart disease_test.csv. You will be evaluated based on square_loss. You will get a full...
-
The process of collaborative goal setting by a manager and subordinate, the extent to which goals are accomplished is a major factor in evaluating and rewarding the subordinate's performance. It is...
-
Use the normal distribution in Exercise 16. (a) What percent of the women have a total cholesterol level less than 217 milligrams per deciliter of blood? (b) Out of 200 randomly selected U.S. women...
-
About 30% of U.S. adults are trying to lose weight. You randomly select eight U.S. adults. Find the probability that the number of U.S. adults who say they are trying to lose weight is (a) Exactly...
-
In Exercises 20, use the frequency histogram to (a) Determine the number of classes. (b) Estimate the frequency of the class with the least frequency. (c) Estimate the frequency of the class with the...
-
A traveller walks \(30 \mathrm{~m}\) along a train platform, dragging their suitcase behind them using a strap attached to the top. The traveller's hand is \(0.25 \mathrm{~m}\) above the top of the...
-
You have lost your skateboard, so you choose to walk around the various sections of the local skate park. The coefficient of static friction between your shoes and the concrete surface is 0.53 . What...
-
A positively charged particle creates the electric field shown in Figure 30. 20. When the kinks in the electric field lines reach the rod, what is the direction of the current induced in the rod?...

Study smarter with the SolutionInn App