

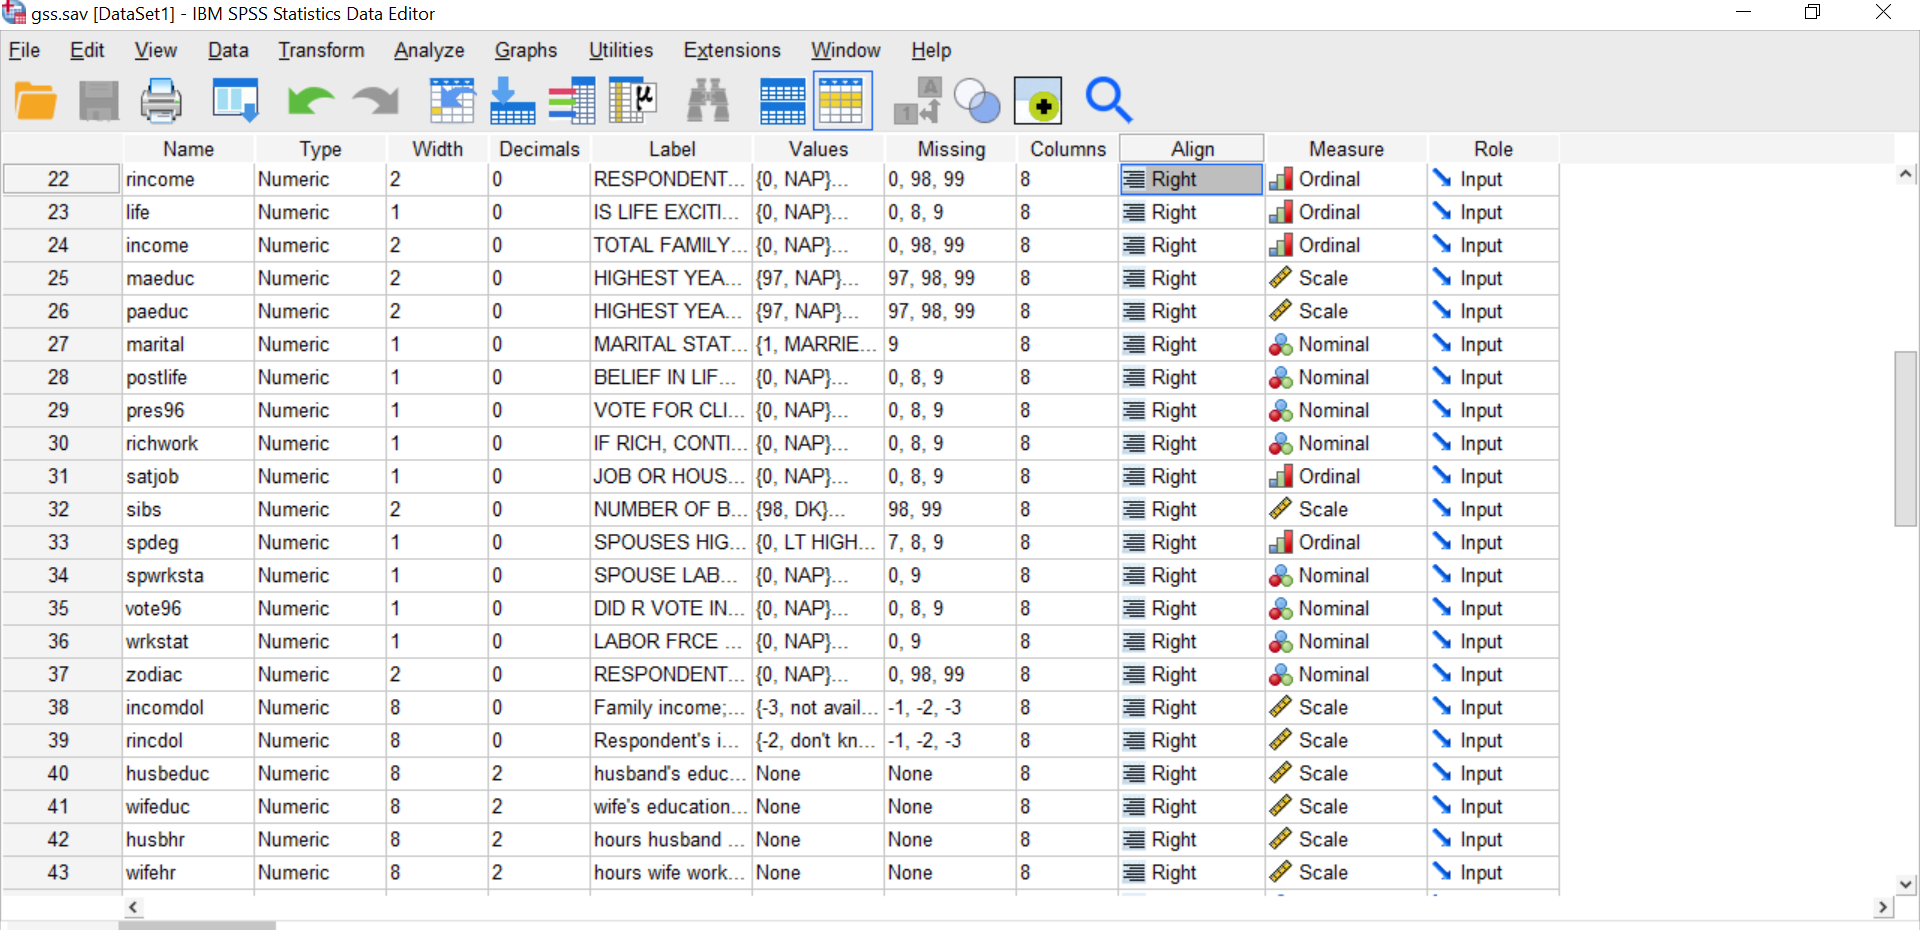
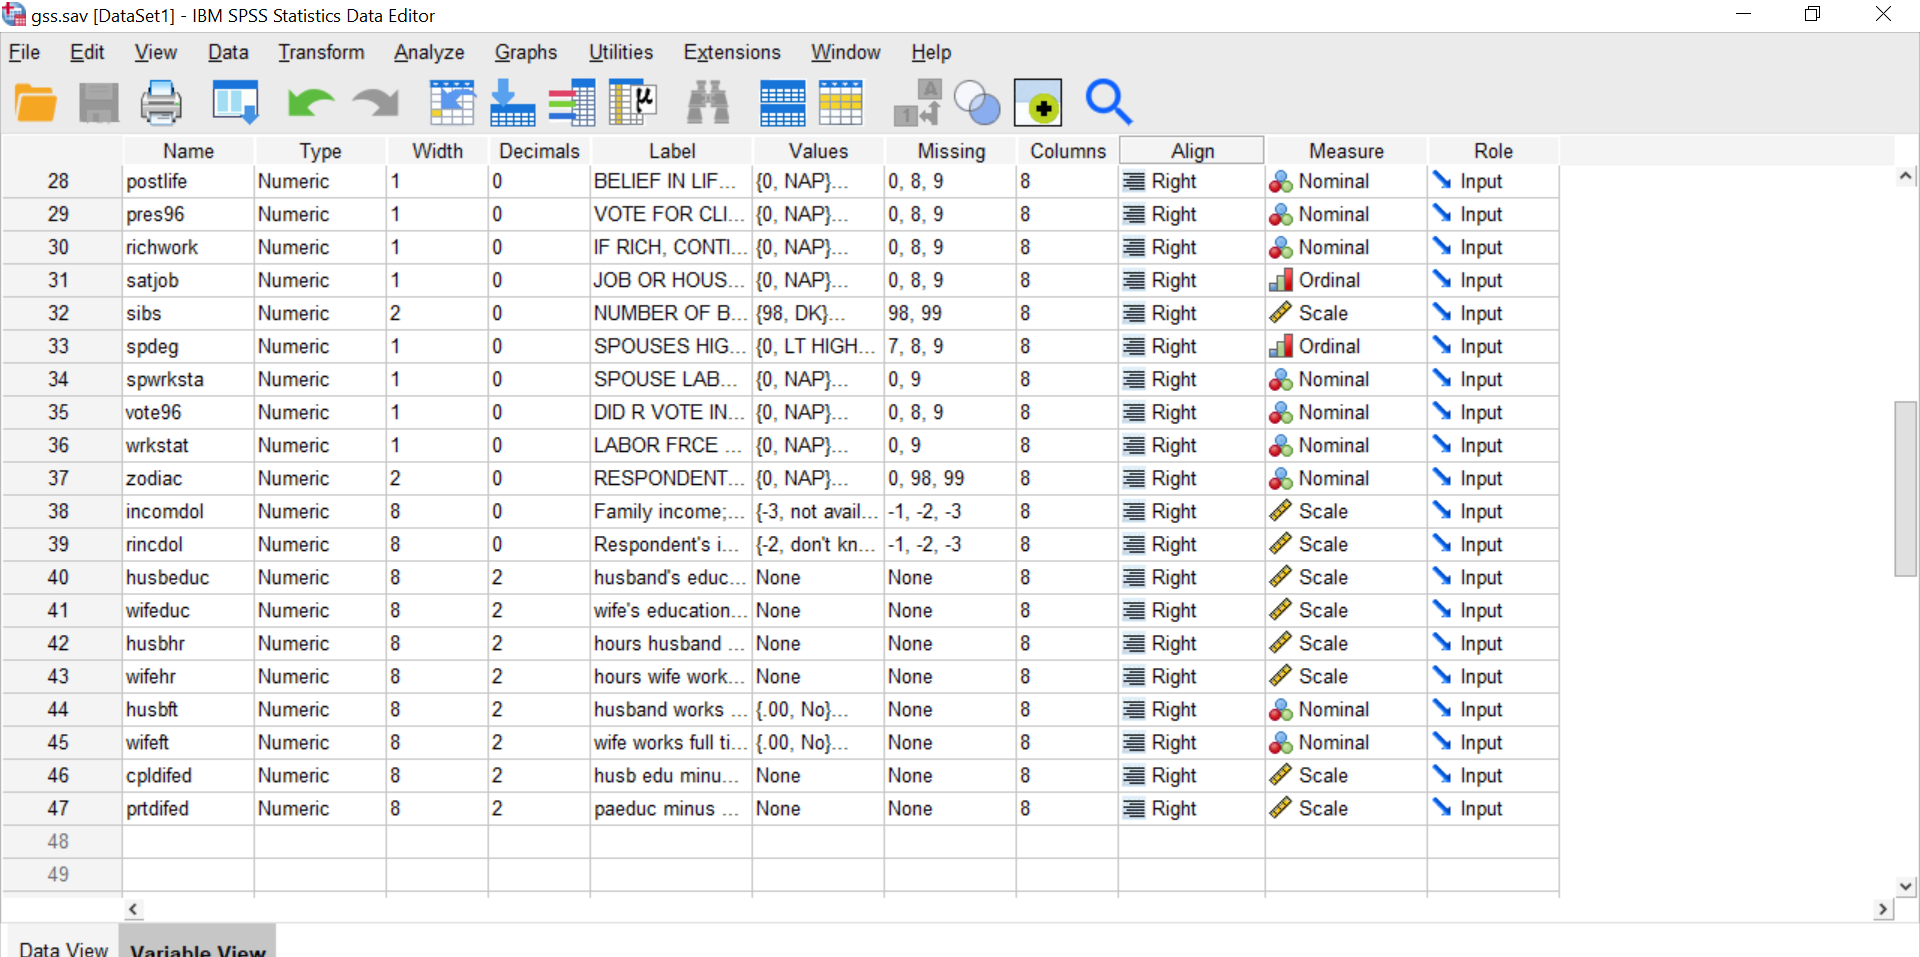
Consider the variable income in gss.sav file (the variable is total family income in the year before
Fantastic news! We've Found the answer you've been seeking!
Question:
Consider the variable income in gss.sav file (the variable is total family income in the year before the survey).
- Make a frequency table for the variable. Does the frequency table make sense? Does it make sense to make a histogram of the variable? A bar chart?
- What is the scale of measurement for the variable?
- What descriptive statistics are appropriate for describing this variable and why? Does it make sense to compute a mean?
- Discuss the advantages and disadvantages of recording income in this manner. Describe other ways of recording income and the problem associated with each of them.
 ?
?
Transcribed Image Text:
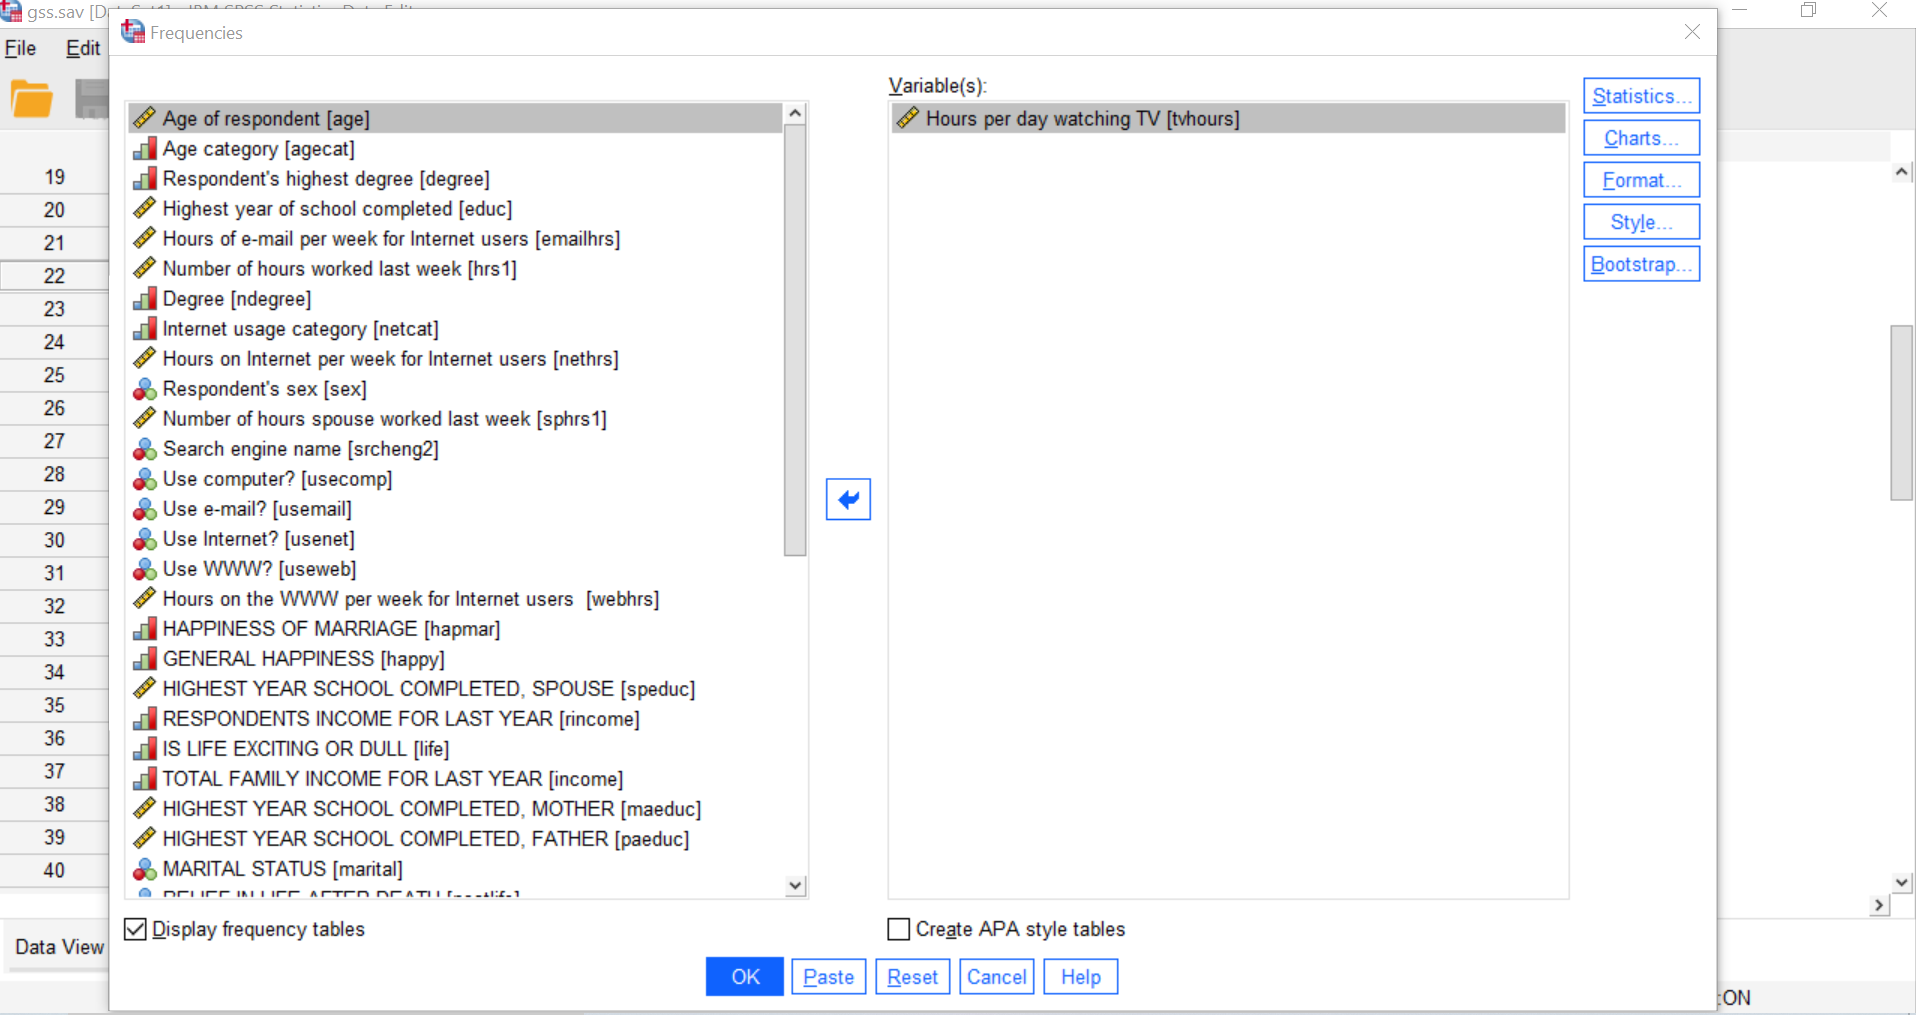
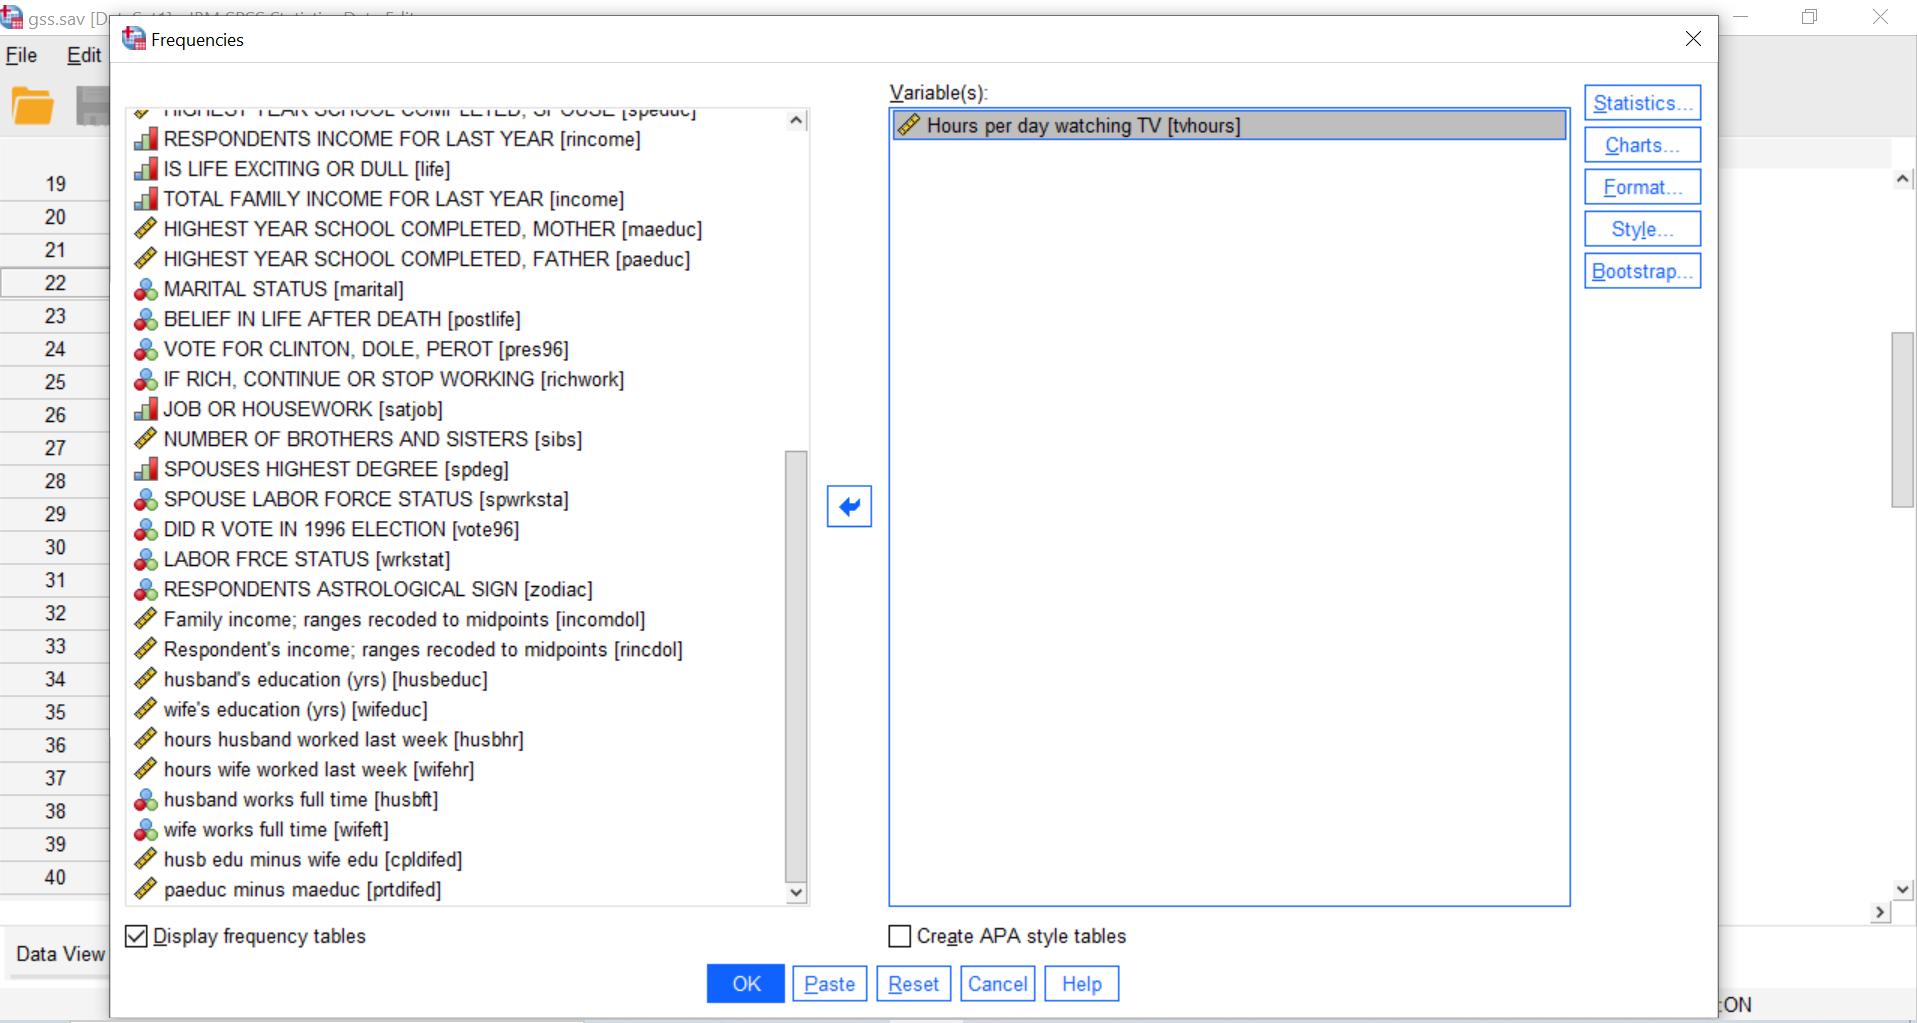
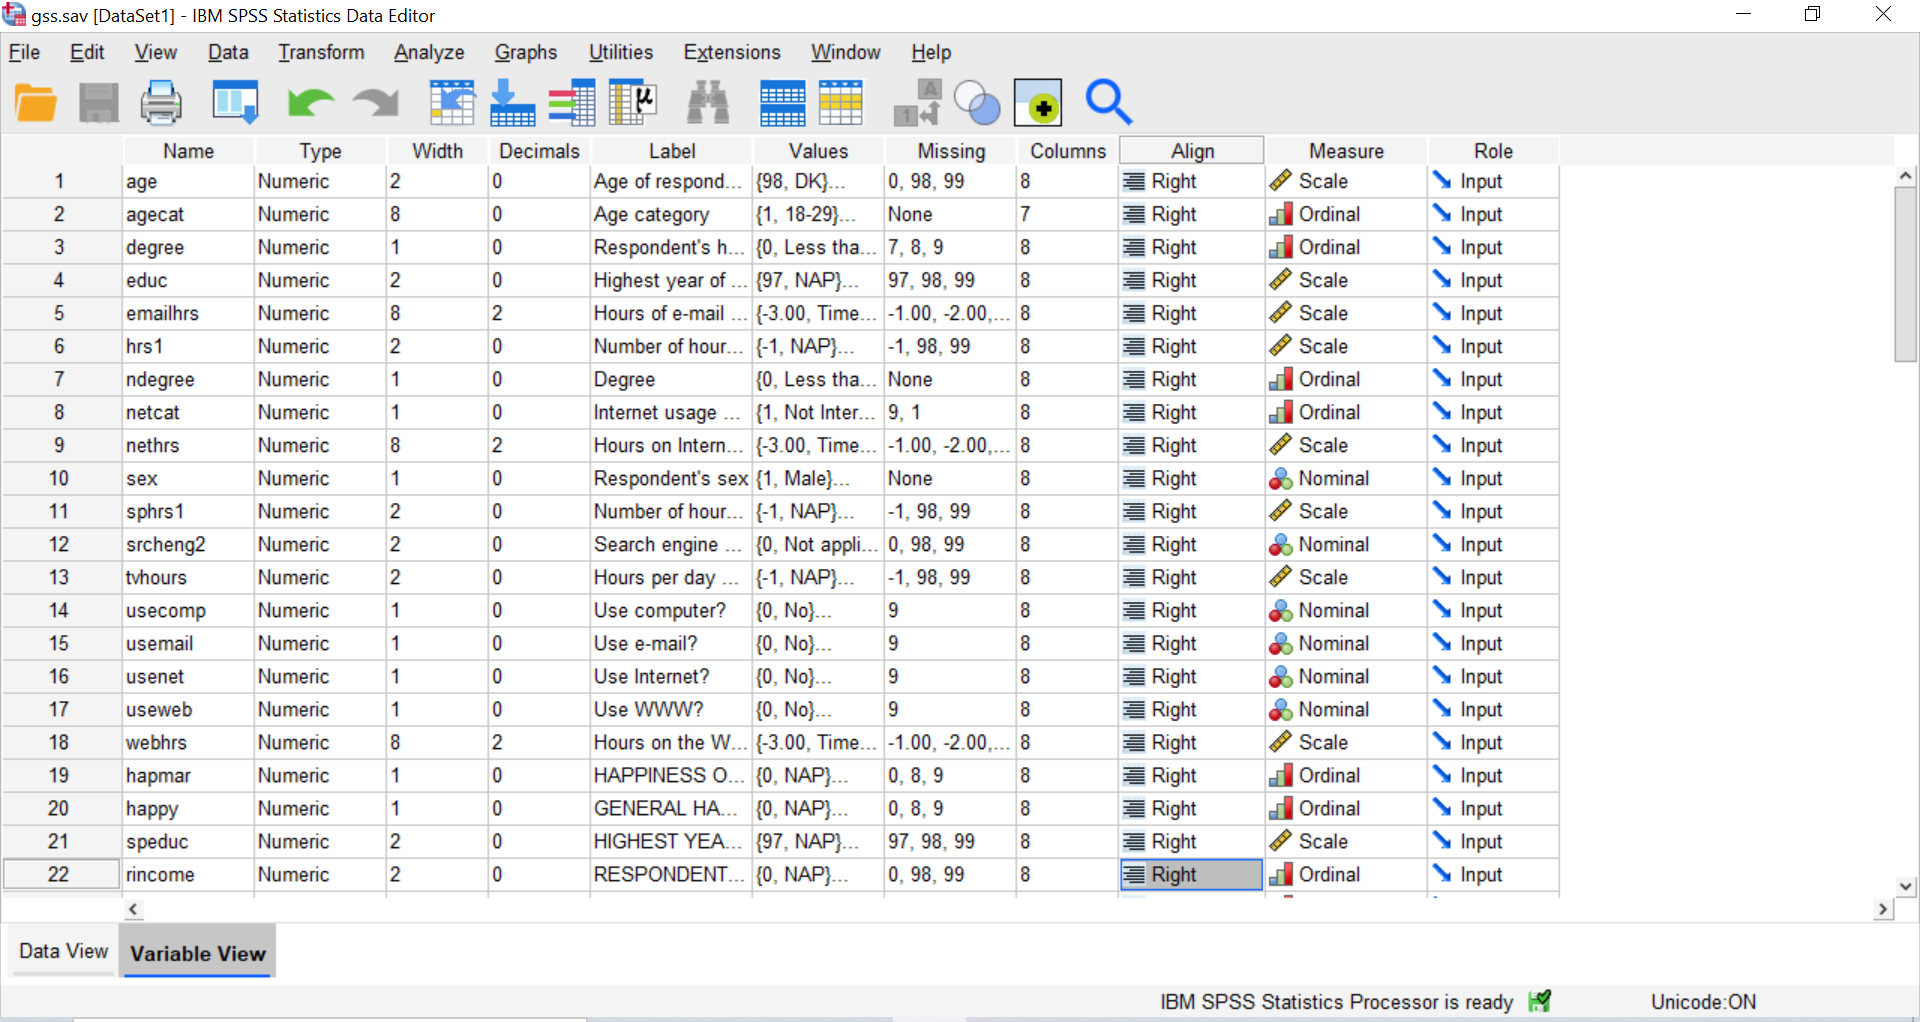
gss.sav [D Edit File 19 20 21 22 23 24 25 26 27 28 29 30 31 32 33 34 35 36 37 38 39 40 Data View IDM CRCC CL Frequencies Age of respondent [age] Age category [agecat] Respondent's highest degree [degree] Highest year of school completed [educ] Hours of e-mail per week for Internet users [emailhrs] Number of hours worked last week [hrs 1] Degree [ndegree] Internet usage category [netcat] Hours on Internet per week for Internet users [nethrs] Respondent's sex [sex] Number of hours spouse worked last week [sphrs 1] Search engine name [srcheng2] Use computer? [usecomp] Use e-mail? [usemail] Use Internet? [usenet] Use WWW? [useweb] Hours on the WWW per week for Internet users [webhrs] HAPPINESS OF MARRIAGE [hapmar] GENERAL HAPPINESS [happy] HIGHEST YEAR SCHOOL COMPLETED, SPOUSE [speduc] RESPONDENTS INCOME FOR LAST YEAR [rincome] IS LIFE EXCITING OR DULL [life] TOTAL FAMILY INCOME FOR LAST YEAR [income] HIGHEST YEAR SCHOOL COMPLETED, MOTHER [maeduc] HIGHEST YEAR SCHOOL COMPLETED, FATHER [paeduc] MARITAL STATUS [marital] DEUCE INUICE ACTED DEATHL:1 Display frequency tables OK Paste Variable(s): Hours per day watching TV [tvhours] Create APA style tables Reset Cancel Help x Statistics... Charts... Format... Style... Bootstrap.. ON X gss.sav [D Edit File 19 20 21 22 23 24 25 26 27 28 29 30 31 32 33 34 35 36 37 38 39 40 Data View Frequencies 4 HIGHILUI ILAN SVI TUUL VOIVII LLILU, UI JOUL [Sport] RESPONDENTS INCOME FOR LAST YEAR [rincome] IS LIFE EXCITING OR DULL [life] TOTAL FAMILY INCOME FOR LAST YEAR [income] HIGHEST YEAR SCHOOL COMPLETED, MOTHER [maeduc] HIGHEST YEAR SCHOOL COMPLETED, FATHER [paeduc] MARITAL STATUS [marital] BELIEF IN LIFE AFTER DEATH [postlife] VOTE FOR CLINTON, DOLE, PEROT [pres96] IF RICH, CONTINUE OR STOP WORKING [richwork] JOB OR HOUSEWORK [satjob] NUMBER OF BROTHERS AND SISTERS [sibs] SPOUSES HIGHEST DEGREE [spdeg] SPOUSE LABOR FORCE STATUS [spwrksta] DID R VOTE IN 1996 ELECTION [vote96] LABOR FRCE STATUS [wrkstat] RESPONDENTS ASTROLOGICAL SIGN [zodiac] Family income; ranges recoded to midpoints [incomdol] Respondent's income; ranges recoded to midpoints [rincdol] husband's education (yrs) [husbeduc] wife's education (yrs) [wifeduc] hours husband worked last week [husbhr] hours wife worked last week [wifehr] husband works full time [husbft] wife works full time [wifeft] husb edu minus wife edu [cpldifed] paeduc minus maeduc [prtdifed] Display frequency tables OK Paste Variable(s): Hours per day watching TV [tvhours] Create APA style tables Cancel Help Reset X Statistics... Charts... Format... Style... Bootstrap... ON X gss.sav [DataSet 1] - IBM SPSS Statistics Data Editor File Edit View Data 1 2 3 4 5 6 7 8 9 10 11 12 13 14 15 16 17 18 19 20 21 22 Name age agecat degree educ emailhrs hrs 1 ndegree netcat nethrs sex sphrs 1 srcheng2 tvhours usecomp usemail usenet useweb webhrs hapmar happy speduc rincome Iransform Analyze Graphs Type Numeric Numeric Numeric Numeric Numeric Numeric Numeric Numeric Numeric Numeric Numeric Numeric Numeric Numeric Numeric Numeric Numeric Numeric Numeric Numeric Numeric Numeric Data View Variable View 2 8 1 2 8 2 1 1 8 1 2 2 2 1 1 1 1 8 1 1 2 2 Width Decimals 0 0 0 0 2 0 0 0 2 0 0 0 0 0 0 0 0 2 0 0 0 OO 0 Utilities Extensions Window Help Label Values Age of respond... {98, DK)... Missing 0, 98, 99 Age category {1, 18-29)... None Respondent's h... {0, Less tha... 7, 8, 9 Highest year of ... {97, NAP)... 97, 98, 99 Hours of e-mail ... {-3.00, Time... -1.00, -2.00,...8 Number of hour... {-1, NAP)... -1, 98, 99 Degree {0, Less tha... None Internet usage... {1, Not Inter... 9, 1 Hours on Intern... {-3.00, Time... -1.00, -2.00, 8 Respondent's sex {1, Male}... None Number of hour... {-1, NAP)... -1, 98, 99 Search engine ... {0, Not appli... 0, 98, 99 Hours per day... {-1, NAP)... -1, 98, 99 {0, No}... 8 8 8 8 8 Use computer? 9 8 Use e-mail? {0, No}... 9 8 Use Internet? 9 8 9 {0, No}... Use WWW? {0, No}... Hours on the W... {-3.00, Time... HAPPINESS O... {0, NAP)... GENERAL HA... {0, NAP)... HIGHEST YEA... {97, NAP)... RESPONDENT... NAP}... Columns 8 7 8 8 8 8 -1.00, -2.00,...8 0, 8, 9 0, 8, 9 97, 98, 99 0, 98, 99 8 8 8 8 Align Right Right Right Right Right Right Right Right Right Right Right Right Right Right Right Right Right Right Right Right Right Right Measure Scale Ordinal Ordinal Scale Scale Scale Ordinal Ordinal Scale Nominal Scale Nominal Scale Nominal Nominal Nominal Nominal Scale Ordinal Ordinal Scale Ordinal Role Input Input Input Input Input Input Input Input Input Input Input Input Input Input Input Input Input Input Input Input Input Input IBM SPSS Statistics Processor is ready T Unicode:ON n X gss.sav [DataSet1] - IBM SPSS Statistics Data Editor File Edit View Data 22 23 24 25 26 27 28 29 30 31 32 33 34 35 36 37 38 39 40 41 42 43 Name rincome life income maeduc paeduc marital postlife pres96 richwork satjob sibs spdeg spwrksta vote96 wrkstat zodiac incomdol rincdol husbeduc wifeduc husbhr wifehr Transform Analyze Graphs Utilities Extensions Window Type Numeric Numeric Numeric Numeric Numeric Numeric Numeric Numeric Numeric Numeric Numeric Numeric Numeric Numeric Numeric Numeric Numeric Numeric Numeric Numeric Numeric Numeric 2 1 2 2 2 1 1 1 1 1 2 1 1 1 1 2 8 8 8 8 8 8 Width Decimals 0 0 0 0 0 0 0 0 0 0 0 0 0 0 0 0 0 0 2 2 2 2 Help Label Values RESPONDENT... {0, NAP)... Missing 0, 98, 99 IS LIFE EXCITI... {0, NAP)... 0, 8, 9 TOTAL FAMILY... {0, NAP)... 0, 98, 99 HIGHEST YEA... {97, NAP)... 97, 98, 99 HIGHEST YEA... {97, NAP)... 97, 98, 99 MARITAL STAT... {1, MARRIE... 9 BELIEF IN LIF... {0, NAP)... 0, 8, 9 VOTE FOR CLI... {0, NAP)... 0, 8, 9 IF RICH, CONTI... {0, NAP)... 0, 8, 9 JOB OR HOUS... {0, NAP)... 0, 8, 9 NUMBER OF B... {98, DK)... 98, 99 SPOUSES HIG... {0, LT HIGH... 7, 8, 9 SPOUSE LAB... {0, NAP)... 0,9 DID R VOTE IN... {0, NAP)... 0, 8, 9 LABOR FRCE {0, NAP)... 0,9 RESPONDENT... {0, NAP)... 0, 98, 99 Family income;... {-3, not avail... -1, -2, -3 Respondent's i... {-2, don't kn... -1, -2, -3 None None husband's educ... None wife's education... None hours husband... None None hours wife work... None None Columns 8 8 8 8 8 8 8 8 8 8 8 8 8 8 8 8 8 8 8 8 8 8 U Align Right Right Right Right Right Right Right Right Right Right Right Right Right Right Right Right Right Right Right Right Right Right Measure Ordinal Ordinal Ordinal Scale Scale Nominal Nominal Nominal Nominal Ordinal Scale Ordinal Nominal Nominal Nominal Nominal Scale Scale Scale Scale Scale Scale Role Input Input Input Input Input Input Input Input Input Input Input Input Input Input Input Input Input Input Input Input Input Input T 0 X gss.sav [DataSet 1] - IBM SPSS Statistics Data Editor File Edit View Data 28 29 30 31 32 33 34 35 36 37 38 39 40 41 42 43 44 45 46 47 48 49 Data View Name postlife pres96 richwork satjob sibs spdeg spwrksta vote96 wrkstat zodiac incomdol rincdol husbeduc wifeduc husbhr wifehr husbft wifeft cpldifed prtdifed Iransform Analyze Graphs Type Numeric Numeric Numeric Numeric Numeric Numeric Numeric Numeric Numeric Numeric Numeric Numeric Numeric Numeric Numeric Numeric Numeric Numeric Numeric Numeric Variable View 1 1 1 1 2 1 1 1 1 2 8 8 8 8 8 8 8 8 8 8 Width Decimals 0 0 0 0 0 0 0 0 0 0 0 0 2 2 2 2 2 2 ~~ 2 2 Utilities Extensions Window Help Missing 0, 8, 9 Label Values BELIEF IN LIF... {0, NAP)... VOTE FOR CLI... {0, NAP)... 0, 8, 9 IF RICH, CONTI... {0, NAP)... 0, 8, 9 JOB OR HOUS... {0, NAP)... 0, 8, 9 NUMBER OF B... {98, DK)... 98, 99 SPOUSES HIG... {0, LT HIGH... 7, 8, 9 SPOUSE LAB... {0, NAP)... 0,9 DID R VOTE IN... {0, NAP)... 0, 8, 9 LABOR FRCE ... {0, NAP}... 0,9 RESPONDENT... {0, NAP)... 0, 98, 99 Family income;... {-3, not avail... -1, -2, -3 Respondent's i... {-2, don't kn... -1, -2, -3 husband's educ... None None None None wife's education... None hours husband None hours wife work... None husband works... {.00, No)... None None None wife works full ti... {.00, No)... husb edu minu... None None paeduc minus ... None None Columns 8 8 8 8 8 8 8 8 8 8 8 8 8 8 8 8 8 8 8 8 Align Right Right Right Right Right Right Right Right Right Right Right Right Right Right Right Right Right Right Right Right Measure Nominal Nominal Nominal Ordinal Scale Ordinal Nominal Nominal Nominal Nominal Scale Scale Scale Scale Scale Scale Nominal Nominal Scale Scale Role Input Input Input Input Input Input Input Input Input Input Input Input Input Input Input Input Input Input Input Input T n X gss.sav [D Edit File 19 20 21 22 23 24 25 26 27 28 29 30 31 32 33 34 35 36 37 38 39 40 Data View IDM CRCC CL Frequencies Age of respondent [age] Age category [agecat] Respondent's highest degree [degree] Highest year of school completed [educ] Hours of e-mail per week for Internet users [emailhrs] Number of hours worked last week [hrs 1] Degree [ndegree] Internet usage category [netcat] Hours on Internet per week for Internet users [nethrs] Respondent's sex [sex] Number of hours spouse worked last week [sphrs 1] Search engine name [srcheng2] Use computer? [usecomp] Use e-mail? [usemail] Use Internet? [usenet] Use WWW? [useweb] Hours on the WWW per week for Internet users [webhrs] HAPPINESS OF MARRIAGE [hapmar] GENERAL HAPPINESS [happy] HIGHEST YEAR SCHOOL COMPLETED, SPOUSE [speduc] RESPONDENTS INCOME FOR LAST YEAR [rincome] IS LIFE EXCITING OR DULL [life] TOTAL FAMILY INCOME FOR LAST YEAR [income] HIGHEST YEAR SCHOOL COMPLETED, MOTHER [maeduc] HIGHEST YEAR SCHOOL COMPLETED, FATHER [paeduc] MARITAL STATUS [marital] DEUCE INUICE ACTED DEATHL:1 Display frequency tables OK Paste Variable(s): Hours per day watching TV [tvhours] Create APA style tables Reset Cancel Help x Statistics... Charts... Format... Style... Bootstrap.. ON X gss.sav [D Edit File 19 20 21 22 23 24 25 26 27 28 29 30 31 32 33 34 35 36 37 38 39 40 Data View Frequencies 4 HIGHILUI ILAN SVI TUUL VOIVII LLILU, UI JOUL [Sport] RESPONDENTS INCOME FOR LAST YEAR [rincome] IS LIFE EXCITING OR DULL [life] TOTAL FAMILY INCOME FOR LAST YEAR [income] HIGHEST YEAR SCHOOL COMPLETED, MOTHER [maeduc] HIGHEST YEAR SCHOOL COMPLETED, FATHER [paeduc] MARITAL STATUS [marital] BELIEF IN LIFE AFTER DEATH [postlife] VOTE FOR CLINTON, DOLE, PEROT [pres96] IF RICH, CONTINUE OR STOP WORKING [richwork] JOB OR HOUSEWORK [satjob] NUMBER OF BROTHERS AND SISTERS [sibs] SPOUSES HIGHEST DEGREE [spdeg] SPOUSE LABOR FORCE STATUS [spwrksta] DID R VOTE IN 1996 ELECTION [vote96] LABOR FRCE STATUS [wrkstat] RESPONDENTS ASTROLOGICAL SIGN [zodiac] Family income; ranges recoded to midpoints [incomdol] Respondent's income; ranges recoded to midpoints [rincdol] husband's education (yrs) [husbeduc] wife's education (yrs) [wifeduc] hours husband worked last week [husbhr] hours wife worked last week [wifehr] husband works full time [husbft] wife works full time [wifeft] husb edu minus wife edu [cpldifed] paeduc minus maeduc [prtdifed] Display frequency tables OK Paste Variable(s): Hours per day watching TV [tvhours] Create APA style tables Cancel Help Reset X Statistics... Charts... Format... Style... Bootstrap... ON X gss.sav [DataSet 1] - IBM SPSS Statistics Data Editor File Edit View Data 1 2 3 4 5 6 7 8 9 10 11 12 13 14 15 16 17 18 19 20 21 22 Name age agecat degree educ emailhrs hrs 1 ndegree netcat nethrs sex sphrs 1 srcheng2 tvhours usecomp usemail usenet useweb webhrs hapmar happy speduc rincome Iransform Analyze Graphs Type Numeric Numeric Numeric Numeric Numeric Numeric Numeric Numeric Numeric Numeric Numeric Numeric Numeric Numeric Numeric Numeric Numeric Numeric Numeric Numeric Numeric Numeric Data View Variable View 2 8 1 2 8 2 1 1 8 1 2 2 2 1 1 1 1 8 1 1 2 2 Width Decimals 0 0 0 0 2 0 0 0 2 0 0 0 0 0 0 0 0 2 0 0 0 OO 0 Utilities Extensions Window Help Label Values Age of respond... {98, DK)... Missing 0, 98, 99 Age category {1, 18-29)... None Respondent's h... {0, Less tha... 7, 8, 9 Highest year of ... {97, NAP)... 97, 98, 99 Hours of e-mail ... {-3.00, Time... -1.00, -2.00,...8 Number of hour... {-1, NAP)... -1, 98, 99 Degree {0, Less tha... None Internet usage... {1, Not Inter... 9, 1 Hours on Intern... {-3.00, Time... -1.00, -2.00, 8 Respondent's sex {1, Male}... None Number of hour... {-1, NAP)... -1, 98, 99 Search engine ... {0, Not appli... 0, 98, 99 Hours per day... {-1, NAP)... -1, 98, 99 {0, No}... 8 8 8 8 8 Use computer? 9 8 Use e-mail? {0, No}... 9 8 Use Internet? 9 8 9 {0, No}... Use WWW? {0, No}... Hours on the W... {-3.00, Time... HAPPINESS O... {0, NAP)... GENERAL HA... {0, NAP)... HIGHEST YEA... {97, NAP)... RESPONDENT... NAP}... Columns 8 7 8 8 8 8 -1.00, -2.00,...8 0, 8, 9 0, 8, 9 97, 98, 99 0, 98, 99 8 8 8 8 Align Right Right Right Right Right Right Right Right Right Right Right Right Right Right Right Right Right Right Right Right Right Right Measure Scale Ordinal Ordinal Scale Scale Scale Ordinal Ordinal Scale Nominal Scale Nominal Scale Nominal Nominal Nominal Nominal Scale Ordinal Ordinal Scale Ordinal Role Input Input Input Input Input Input Input Input Input Input Input Input Input Input Input Input Input Input Input Input Input Input IBM SPSS Statistics Processor is ready T Unicode:ON n X gss.sav [DataSet1] - IBM SPSS Statistics Data Editor File Edit View Data 22 23 24 25 26 27 28 29 30 31 32 33 34 35 36 37 38 39 40 41 42 43 Name rincome life income maeduc paeduc marital postlife pres96 richwork satjob sibs spdeg spwrksta vote96 wrkstat zodiac incomdol rincdol husbeduc wifeduc husbhr wifehr Transform Analyze Graphs Utilities Extensions Window Type Numeric Numeric Numeric Numeric Numeric Numeric Numeric Numeric Numeric Numeric Numeric Numeric Numeric Numeric Numeric Numeric Numeric Numeric Numeric Numeric Numeric Numeric 2 1 2 2 2 1 1 1 1 1 2 1 1 1 1 2 8 8 8 8 8 8 Width Decimals 0 0 0 0 0 0 0 0 0 0 0 0 0 0 0 0 0 0 2 2 2 2 Help Label Values RESPONDENT... {0, NAP)... Missing 0, 98, 99 IS LIFE EXCITI... {0, NAP)... 0, 8, 9 TOTAL FAMILY... {0, NAP)... 0, 98, 99 HIGHEST YEA... {97, NAP)... 97, 98, 99 HIGHEST YEA... {97, NAP)... 97, 98, 99 MARITAL STAT... {1, MARRIE... 9 BELIEF IN LIF... {0, NAP)... 0, 8, 9 VOTE FOR CLI... {0, NAP)... 0, 8, 9 IF RICH, CONTI... {0, NAP)... 0, 8, 9 JOB OR HOUS... {0, NAP)... 0, 8, 9 NUMBER OF B... {98, DK)... 98, 99 SPOUSES HIG... {0, LT HIGH... 7, 8, 9 SPOUSE LAB... {0, NAP)... 0,9 DID R VOTE IN... {0, NAP)... 0, 8, 9 LABOR FRCE {0, NAP)... 0,9 RESPONDENT... {0, NAP)... 0, 98, 99 Family income;... {-3, not avail... -1, -2, -3 Respondent's i... {-2, don't kn... -1, -2, -3 None None husband's educ... None wife's education... None hours husband... None None hours wife work... None None Columns 8 8 8 8 8 8 8 8 8 8 8 8 8 8 8 8 8 8 8 8 8 8 U Align Right Right Right Right Right Right Right Right Right Right Right Right Right Right Right Right Right Right Right Right Right Right Measure Ordinal Ordinal Ordinal Scale Scale Nominal Nominal Nominal Nominal Ordinal Scale Ordinal Nominal Nominal Nominal Nominal Scale Scale Scale Scale Scale Scale Role Input Input Input Input Input Input Input Input Input Input Input Input Input Input Input Input Input Input Input Input Input Input T 0 X gss.sav [DataSet 1] - IBM SPSS Statistics Data Editor File Edit View Data 28 29 30 31 32 33 34 35 36 37 38 39 40 41 42 43 44 45 46 47 48 49 Data View Name postlife pres96 richwork satjob sibs spdeg spwrksta vote96 wrkstat zodiac incomdol rincdol husbeduc wifeduc husbhr wifehr husbft wifeft cpldifed prtdifed Iransform Analyze Graphs Type Numeric Numeric Numeric Numeric Numeric Numeric Numeric Numeric Numeric Numeric Numeric Numeric Numeric Numeric Numeric Numeric Numeric Numeric Numeric Numeric Variable View 1 1 1 1 2 1 1 1 1 2 8 8 8 8 8 8 8 8 8 8 Width Decimals 0 0 0 0 0 0 0 0 0 0 0 0 2 2 2 2 2 2 ~~ 2 2 Utilities Extensions Window Help Missing 0, 8, 9 Label Values BELIEF IN LIF... {0, NAP)... VOTE FOR CLI... {0, NAP)... 0, 8, 9 IF RICH, CONTI... {0, NAP)... 0, 8, 9 JOB OR HOUS... {0, NAP)... 0, 8, 9 NUMBER OF B... {98, DK)... 98, 99 SPOUSES HIG... {0, LT HIGH... 7, 8, 9 SPOUSE LAB... {0, NAP)... 0,9 DID R VOTE IN... {0, NAP)... 0, 8, 9 LABOR FRCE ... {0, NAP}... 0,9 RESPONDENT... {0, NAP)... 0, 98, 99 Family income;... {-3, not avail... -1, -2, -3 Respondent's i... {-2, don't kn... -1, -2, -3 husband's educ... None None None None wife's education... None hours husband None hours wife work... None husband works... {.00, No)... None None None wife works full ti... {.00, No)... husb edu minu... None None paeduc minus ... None None Columns 8 8 8 8 8 8 8 8 8 8 8 8 8 8 8 8 8 8 8 8 Align Right Right Right Right Right Right Right Right Right Right Right Right Right Right Right Right Right Right Right Right Measure Nominal Nominal Nominal Ordinal Scale Ordinal Nominal Nominal Nominal Nominal Scale Scale Scale Scale Scale Scale Nominal Nominal Scale Scale Role Input Input Input Input Input Input Input Input Input Input Input Input Input Input Input Input Input Input Input Input T n X
Expert Answer:

Related Book For 

Statistical Reasoning for Everyday Life
ISBN: 978-0321817624
4th edition
Authors: Jeff Bennett, Bill Briggs, Mario F. Triola
Posted Date:
Students also viewed these mathematics questions
-
Consider the inner product on C[0,1] Consiker the funcdions g(x) = x tor j=0,1,2,. and an unknewn h in C[O,1] Suppose you know Kh.go) =0 (n.g2) =3 Mark all of the following that are true tor the...
-
a. Construct a frequency table for the weights of regular Pepsi. Use bins of 0.8130-0.8179 0.8180-0.8229 0.8230-0.8279 0.8280-0.8329 0.8330-0.8379 0.8380-0.8429 b. Construct a frequency table for the...
-
Construct a frequency table for the weights (in pounds) given below of 36 cans of regular Coke. Start the first bin at 0.7900 pound and use a bin width of 0.0050 pound. Discuss your findings. 0.8192...
-
Suppose Nordic Boots was making production decisions for the following six boots: ot Price E(Demand) Std. Dev (Demand) Co Cu Exp. Profit Max. Profit A 220 1000 400 35.2 52.8 1101 39201 52800 230 2000...
-
Regal Farms Ltd has sales of 2.5 million, a gross profit of 1.7 million and expenses of 800,000. Regal has paid interest of 72,000 and has to provide for Corporations Tax of 310,000 and dividends of...
-
What are some common System Deployment issues that require consideration?
-
The income statement format that shows important subtotals is referred to as a. a classified income statement. b. a single-step income statement. C. a multi-step income statement, d. a subtotaled...
-
Suppose that you are the owner/manager of a house-cleaning business. You have 30 employees who work in teams of three. Teams are dispatched to the homes of customers where they are directed by the...
-
Q.1(a) Write down the definitions of broad monetary aggregates (R, M1, M2 and M3) for Pakistan? What does each component of these monetary aggregates represent? (b) Collect annual data on each of the...
-
(a) A homogeneous solid body of arbitrary shape is initially at temperature T, throughout. At t = 0 it is immersed in a fluid medium of temperature T. Let L be a characteristic length in the solid....
-
As with everything else, Budgeting has its fair share of shortcomings, yet it continues to be used as a major management/planning tool. required: Identify FIVE (5) disadvantages of Budgeting and...
-
How can you use the Fama-French-Carhart factor specification to estimate the cost of capital?
-
True or False: When a firm issues equity, it increases the supply of its shares in the market, which should cause its share price to fall.
-
With perfect capital markets, as a firm increases its leverage, how does its debt cost of capital change? Its equity cost of capital? Its weighted average cost of capital?
-
How do we compute the weighted average cost of capital of a firm?
-
In a perfect capital market, how will a firms market capitalization change if it borrows in order to repurchase shares? How will its share price change?
-
12. A chicken nugget manufacturer is balancing the fines of making consumers sick against the costs of increasing the quality of their ingredients. They're trying to minimize that cost and have...
-
Draw and label the E and Z isomers for each of the following compounds: 1. CH3CH2CH==CHCH3 2. 3. 4. CH,CH2C CHCH2CH Cl CH3CH2CH2CH2 CH CH2CCCH2CI CHCH3 CH3 HOCH CH CCC CH O-CH C(CH
-
The cold medicine Dozenol lists 600 milligrams of acetominophen per fluid ounce as an active ingredient. The Food and Drug Administration tests 65 one-ounce samples of the medicine and finds that the...
-
A study was conducted to determine whether flipping a penny or spinning a penny has an effect on the proportion of heads. Among 49,437 trials, 29,015 involved flipping pennies, and 14,709 of those...
-
An investigator has data consisting of heights of daughters and the heights of the corresponding mothers and fathers. She wants to analyze the data to see the effect that the height of the mother and...
-
What is a CPA's reporting responsibility when associated with unaudited financial statements of a public company?
-
What levels of service may a CPA provide on pro forma financial information?
-
Statements on Standards for Accounting and Review Services (SSARS) require an accountant to report when the accountant has a. Typed client-prepared financial statements, without modification, as an...

Study smarter with the SolutionInn App