

Star Motor Company has been successfully making autos and trucks for more than 100 years in...
Fantastic news! We've Found the answer you've been seeking!
Question:
Transcribed Image Text:
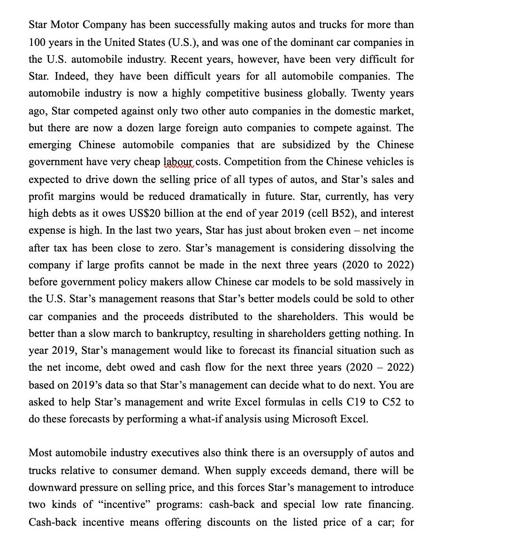
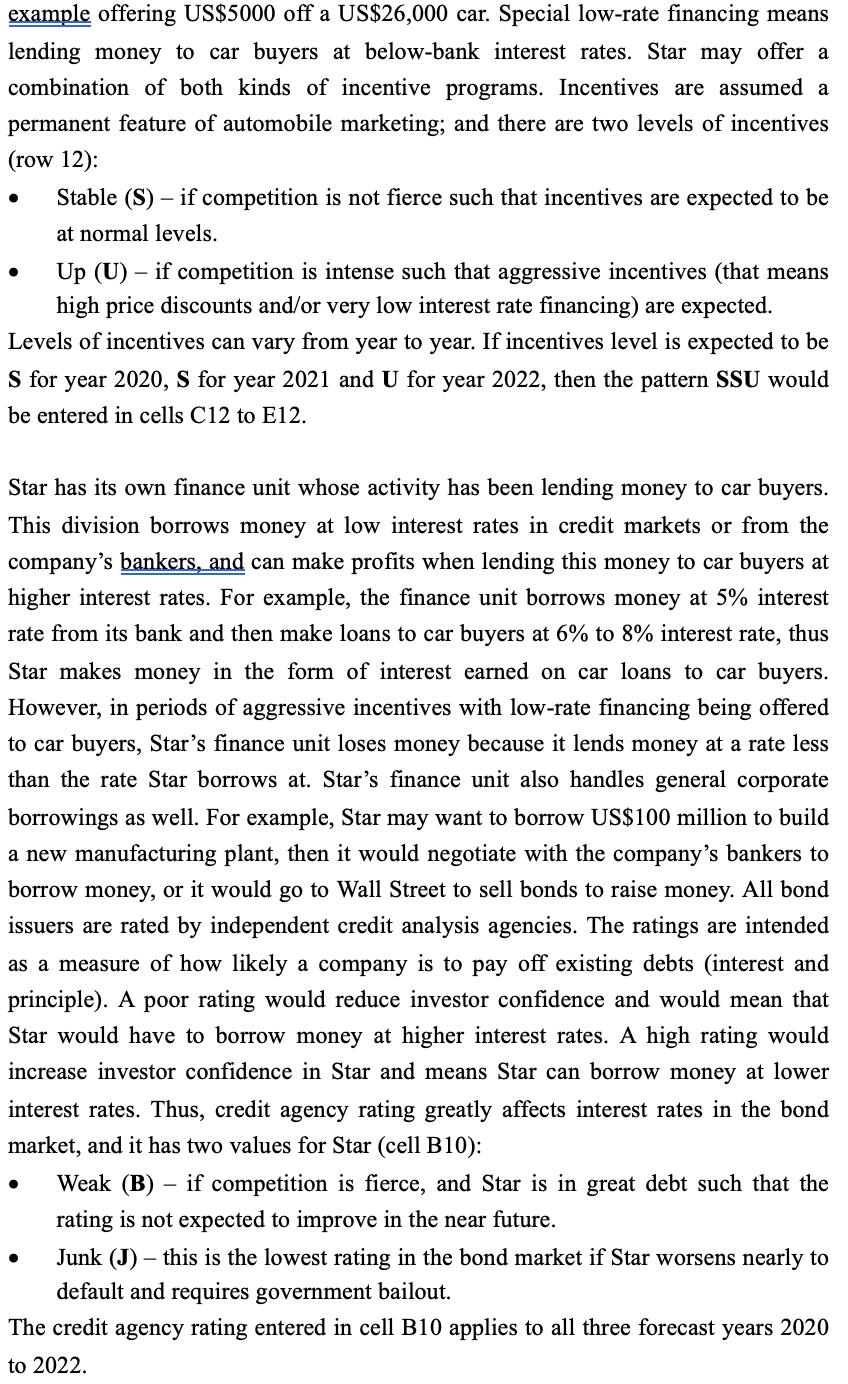
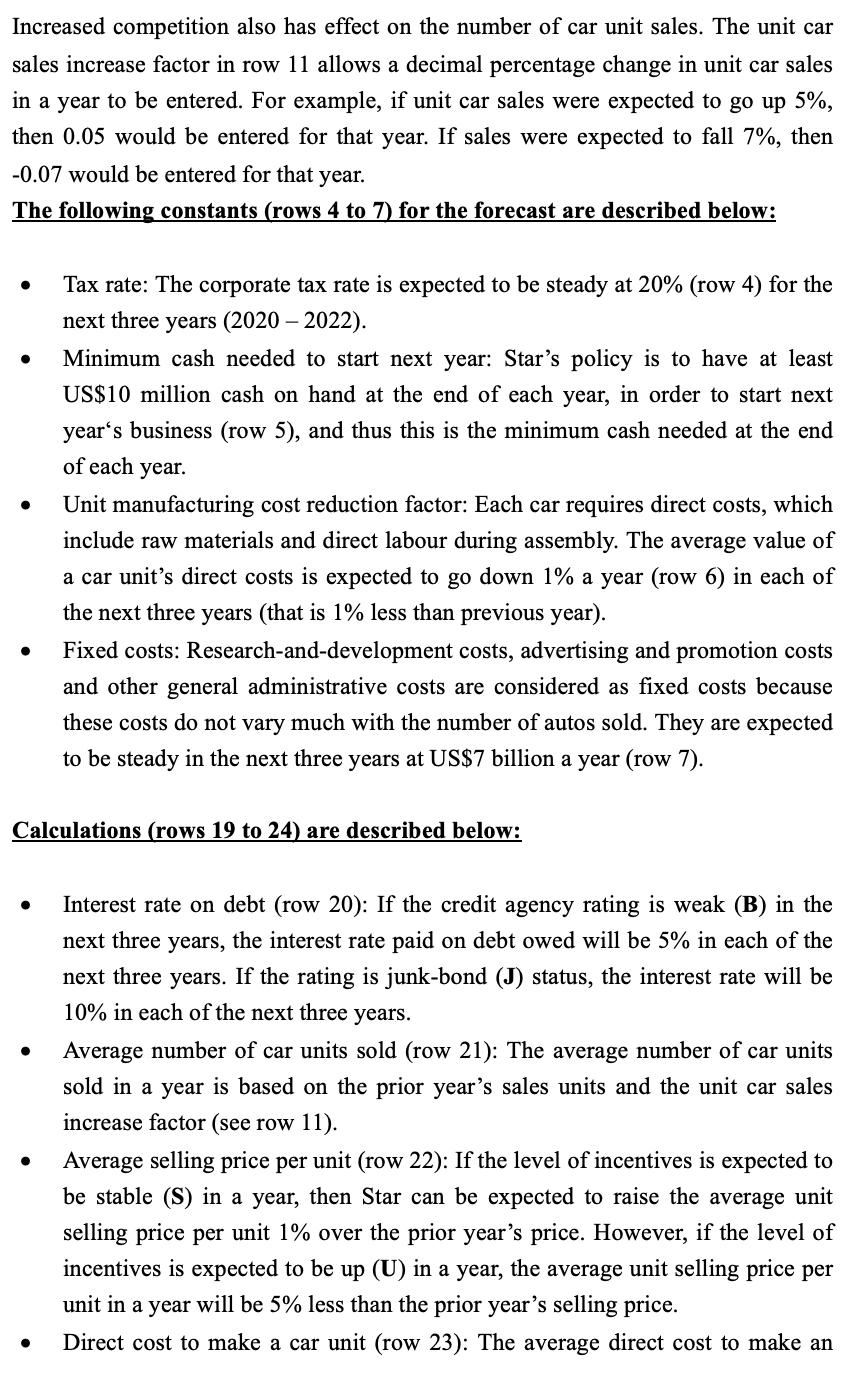
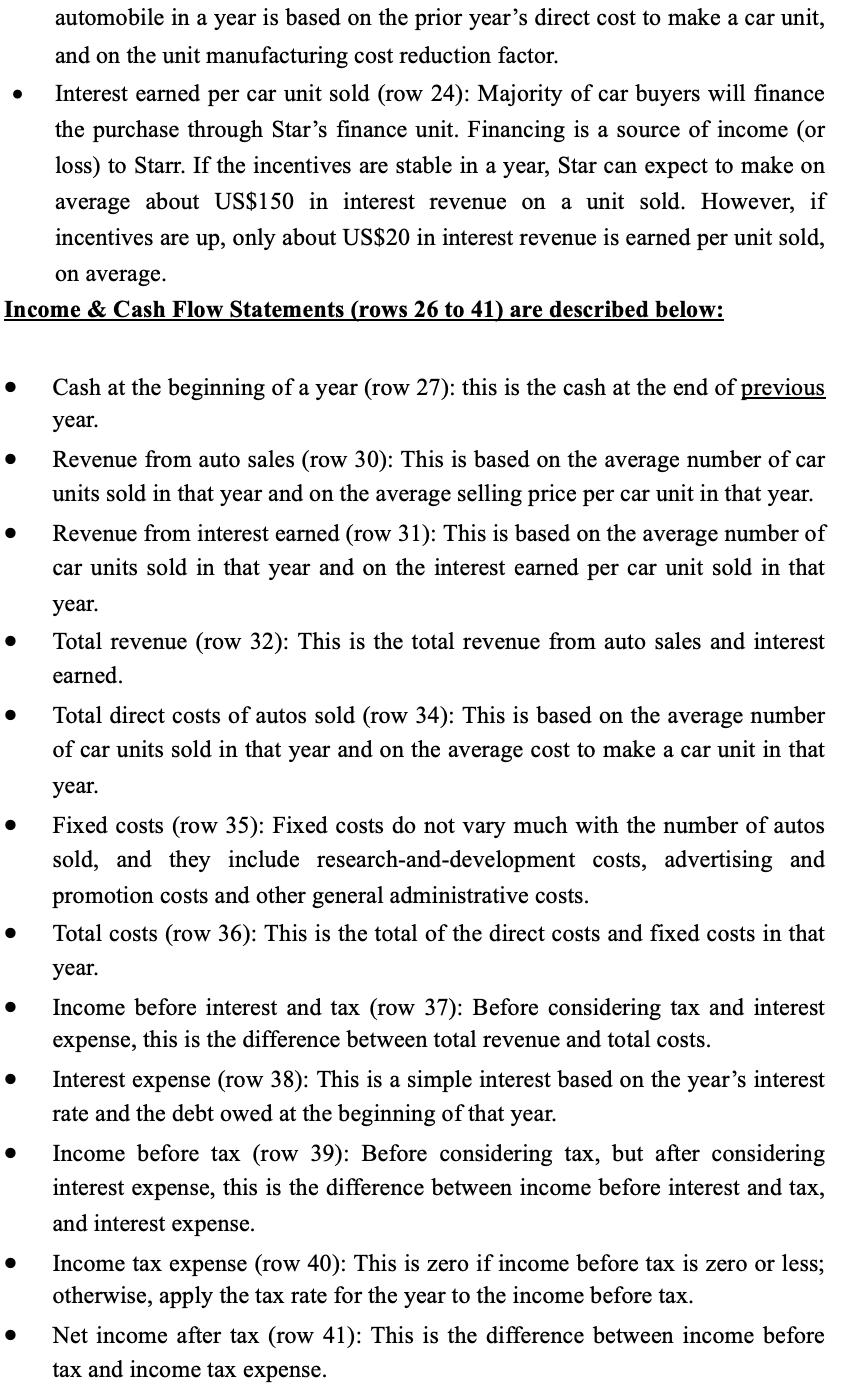
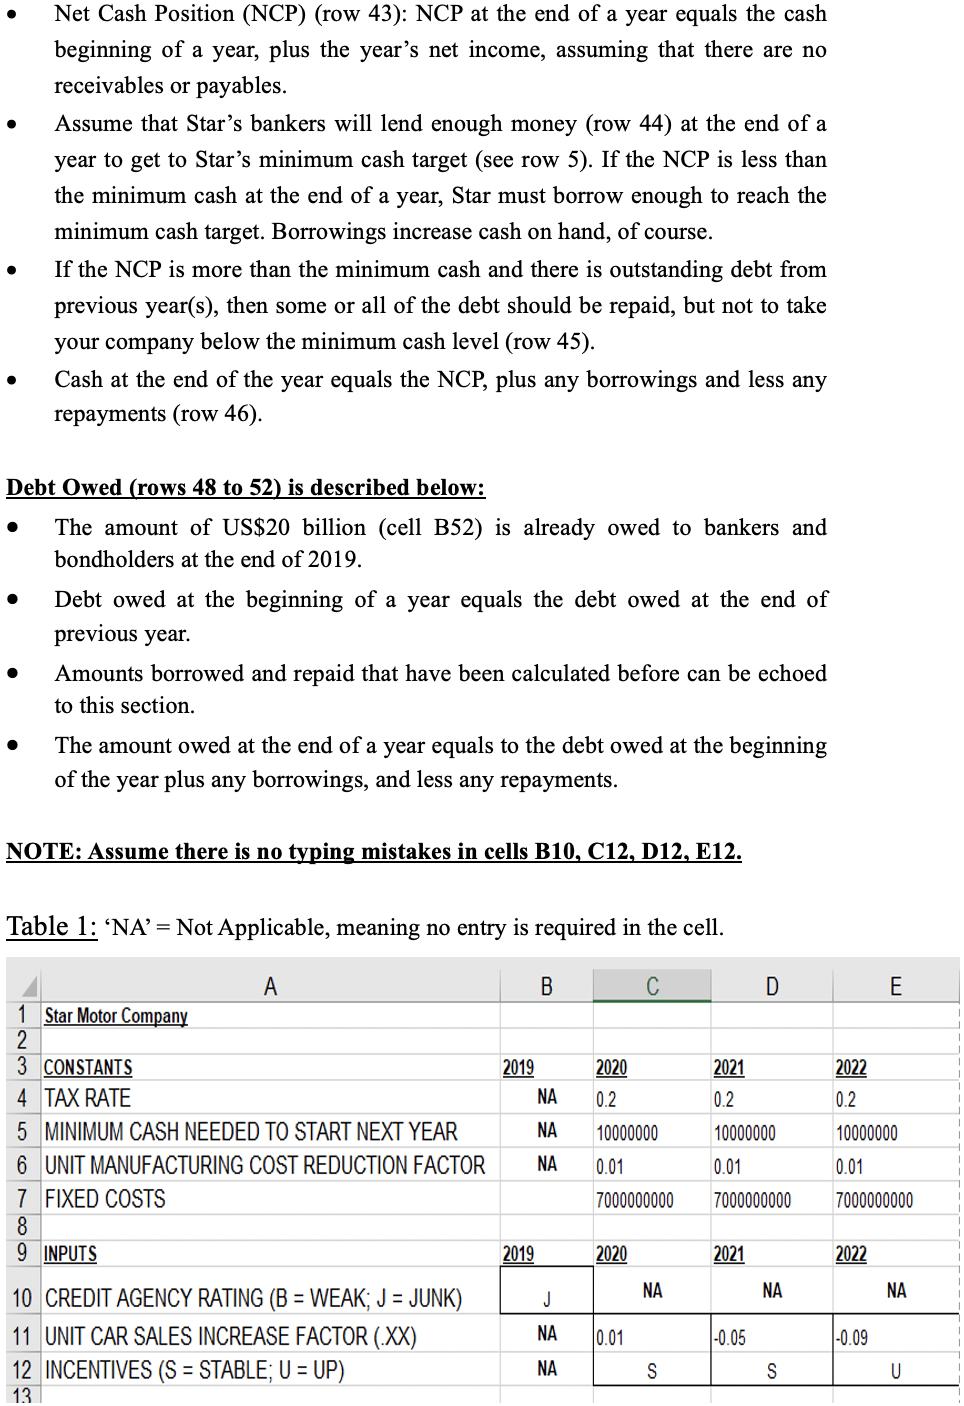
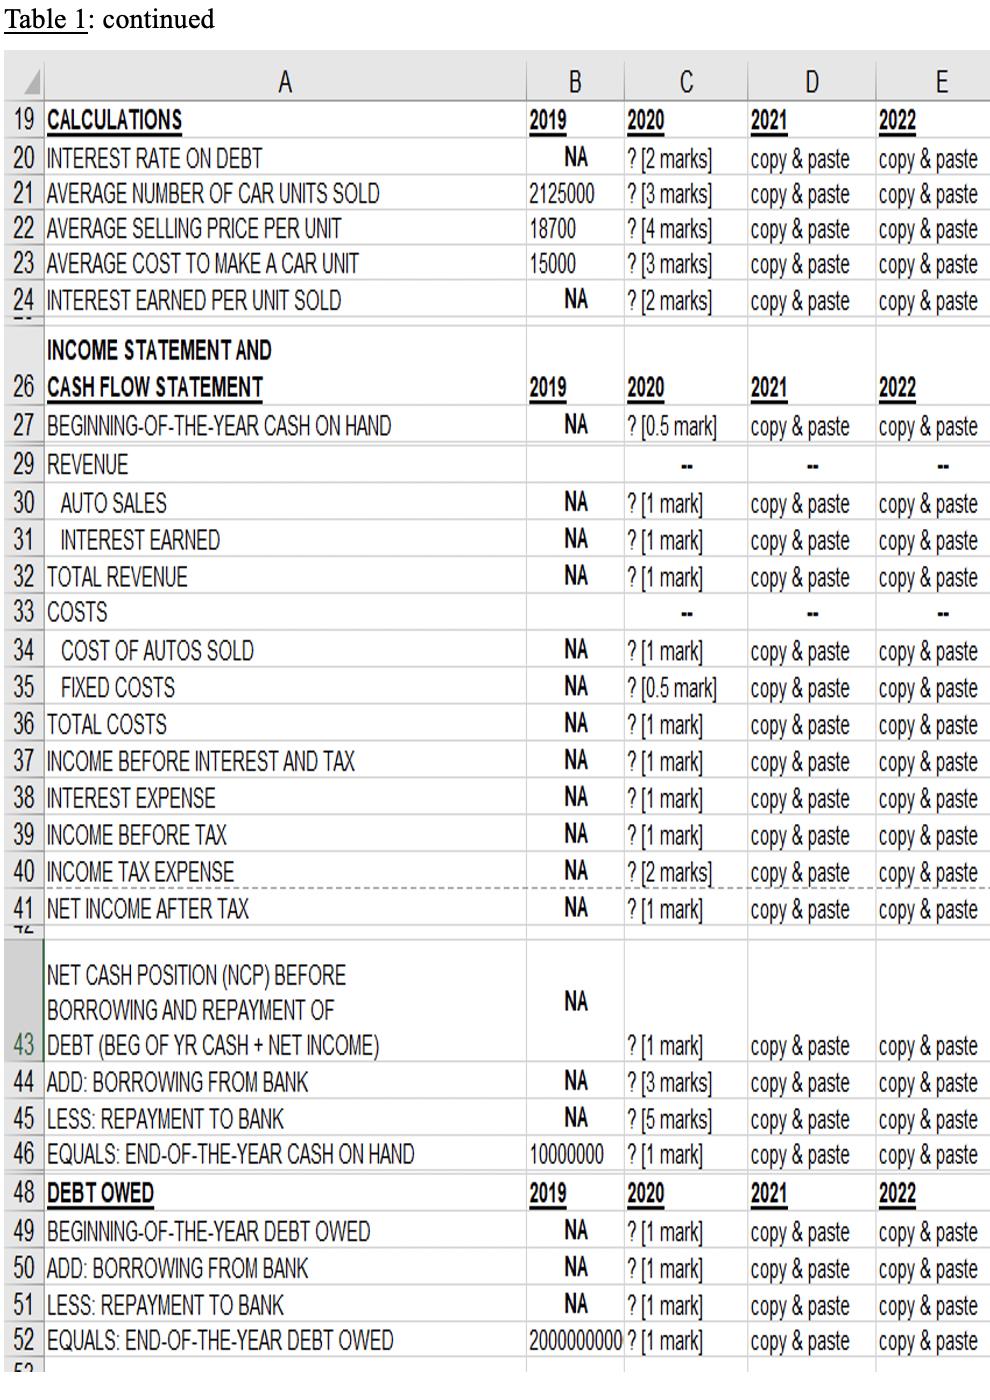
Star Motor Company has been successfully making autos and trucks for more than 100 years in the United States (U.S.), and was one of the dominant car companies in the U.S. automobile industry. Recent years, however, have been very difficult for Star. Indeed, they have been difficult years for all automobile companies. The automobile industry is now a highly competitive business globally. Twenty years ago, Star competed against only two other auto companies in the domestic market, but there are now a dozen large foreign auto companies to compete against. The emerging Chinese automobile companies that are subsidized by the Chinese government have very cheap labour costs. Competition from the Chinese vehicles is expected to drive down the selling price of all types of autos, and Star's sales and profit margins would be reduced dramatically in future. Star, currently, has very high debts as it owes US$20 billion at the end of year 2019 (cell B52), and interest expense is high. In the last two years, Star has just about broken even - net income after tax has been close to zero. Star's management is considering dissolving the company if large profits cannot be made in the next three years (2020 to 2022) before government policy makers allow Chinese car models to be sold massively in the U.S. Star's management reasons that Star's better models could be sold to other car companies and the proceeds distributed to the shareholders. This would be better than a slow march to bankruptcy, resulting in shareholders getting nothing. In year 2019, Star's management would like to forecast its financial situation such as the net income, debt owed and cash flow for the next three years (2020-2022) based on 2019's data so that Star's management can decide what to do next. You are asked to help Star's management and write Excel formulas in cells C19 to C52 to do these forecasts by performing a what-if analysis using Microsoft Excel. Most automobile industry executives also think there is an oversupply of autos and trucks relative to consumer demand. When supply exceeds demand, there will be downward pressure on selling price, and this forces Star's management to introduce two kinds of "incentive" programs: cash-back and special low rate financing. Cash-back incentive means offering discounts on the listed price of a car, for example offering US$5000 off a US$26,000 car. Special low-rate financing means lending money to car buyers at below-bank interest rates. Star may offer a combination of both kinds of incentive programs. Incentives are assumed a permanent feature of automobile marketing; and there are two levels of incentives (row 12): ● ● Up (U) - if competition is intense such that aggressive incentives (that means high price discounts and/or very low interest rate financing) are expected. Levels of incentives can vary from year to year. If incentives level is expected to be S for year 2020, S for year 2021 and U for year 2022, then the pattern SSU would be entered in cells C12 to E12. Stable (S) - if competition is not fierce such that incentives are expected to be at normal levels. Star has its own finance unit whose activity has been lending money to car buyers. This division borrows money at low interest rates in credit markets or from the company's bankers, and can make profits when lending this money to car buyers at higher interest rates. For example, the finance unit borrows money at 5% interest rate from its bank and then make loans to car buyers at 6% to 8% interest rate, thus Star makes money in the form of interest earned on car loans to car buyers. However, in periods of aggressive incentives with low-rate financing being offered to car buyers, Star's finance unit loses money because it lends money at a rate less than the rate Star borrows at. Star's finance unit also handles general corporate borrowings as well. For example, Star may want to borrow US$100 million to build a new manufacturing plant, then it would negotiate with the company's bankers to borrow money, or it would go to Wall Street sell bonds to raise money. All bond issuers are rated by independent credit analysis agencies. The ratings are intended as a measure of how likely a company is to pay off existing debts (interest and principle). A poor rating would reduce investor confidence and would mean that Star would have to borrow money at higher interest rates. A high rating would increase investor confidence in Star and means Star can borrow money at lower interest rates. Thus, credit agency rating greatly affects interest rates in the bond market, and it has two values for Star (cell B10): Weak (B) if competition is fierce, and Star is in great debt such that the rating is not expected to improve in the near future. Junk (J) - this is the lowest rating in the bond market if Star worsens nearly to default and requires government bailout. The credit agency rating entered in cell B10 applies to all three forecast years 2020 to 2022. ● ● - Increased competition also has effect on the number of car unit sales. The unit car sales increase factor in row 11 allows a decimal percentage change in unit car sales in a year to be entered. For example, if unit car sales were expected to go up 5%, then 0.05 would be entered for that year. If sales were expected to fall 7%, then -0.07 would be entered for that year. The following constants (rows 4 to 7) for the forecast are described below: ● ● ● ● Tax rate: The corporate tax rate is expected to be steady at 20% (row 4) for the next three years (2020-2022). ● Minimum cash needed to start next year: Star's policy is to have at least US$10 million cash on hand at the end of each year, in order to start next year's business (row 5), and thus this is the minimum cash needed at the end of each year. Calculations (rows 19 to 24) are described below: Unit manufacturing cost reduction factor: Each car requires direct costs, which include raw materials and direct labour during assembly. The average value of a car unit's direct costs is expected to go down 1% a year (row 6) in each of the next three years (that is 1% less than previous year). Fixed costs: Research-and-development costs, advertising and promotion costs and other general administrative costs are considered as fixed costs because these costs do not vary much with the number of autos sold. They are expected to be steady in the next three years at US$7 billion a year (row 7). Interest rate on debt (row 20): If the credit agency rating is weak (B) in the next three years, the interest rate paid on debt owed will be 5% in each of the next three years. If the rating is junk-bond (J) status, the interest rate will be 10% in each of the next three years. Average number of car units sold (row 21): The average number of car units sold in a year is based on the prior year's sales units and the unit car sales increase factor (see row 11). Average selling price per unit (row 22): If the level of incentives is expected to be stable (S) in a year, then Star can be expected to raise the average unit selling price per unit 1% over the prior year's price. However, if the level of incentives is expected to be up (U) in a year, the average unit selling price per unit in a year will be 5% less than the prior year's selling price. Direct cost to make a car unit (row 23): The average direct cost to make an automobile in a year is based on the prior year's direct cost to make a car unit, and on the unit manufacturing cost reduction factor. Interest earned per car unit sold (row 24): Majority of car buyers will finance the purchase through Star's finance unit. Financing is a source of income (or loss) to Starr. If the incentives are stable in a year, Star can expect to make on average about US$150 in interest revenue on a unit sold. However, if incentives are up, only about US$20 in interest revenue is earned per unit sold, on average. Income & Cash Flow Statements (rows 26 to 41) are described below: ● ● ● ● ● ● ● ● Cash at the beginning of a year (row 27): this is the cash at the end of previous year. Revenue from auto sales (row 30): This is based on the average number of car units sold in that year and on the average selling price per car unit in that year. Revenue from interest earned (row 31): This is based on the average number of car units sold in that year and on the interest earned per car unit sold in that year. Total revenue (row 32): This is the total revenue from auto sales and interest earned. Total direct costs of autos sold (row 34): This is based on the average number of car units sold in that year and on the average cost to make a car unit in that year. Fixed costs (row 35): Fixed costs do not vary much with the number of autos sold, and they include research-and-development costs, advertising and promotion costs and other general administrative costs. Total costs (row 36): This is the total of the direct costs and fixed costs in that year. Income before interest and tax (row 37): Before considering tax and interest expense, this is the difference between total revenue and total costs. Interest expense (row 38): This is a simple interest based on the year's interest rate and the debt owed at the beginning of that year. Income before tax (row 39): Before considering tax, but after considering interest expense, this is the difference between income before interest and tax, and interest expense. Income tax expense (row 40): This is zero if income before tax is zero or less; otherwise, apply the tax rate for the year to the income before tax. Net income after tax (row 41): This is the difference between income before tax and income tax expense. ● ● ● ● ● Debt Owed (rows 48 to 52) is described below: The amount of US$20 billion (cell B52) is already owed to bankers and bondholders at the end of 2019. ● Net Cash Position (NCP) (row 43): NCP at the end of a year equals the cash beginning of a year, plus the year's net income, assuming that there are no receivables or payables. ● Assume that Star's bankers will lend enough money (row 44) at the end of a year to get to Star's minimum cash target (see row 5). If the NCP is less than the minimum cash at the end of a year, Star must borrow enough to reach the minimum cash target. Borrowings increase cash on hand, of course. If the NCP is more than the minimum cash and there is outstanding debt from previous year(s), then some or all of the debt should be repaid, but not to take your company below the minimum cash level (row 45). Cash at the end of the year equals the NCP, plus any borrowings and less any repayments (row 46). Debt owed at the beginning of a year equals the debt owed at the end of previous year. Amounts borrowed and repaid that have been calculated before can be echoed to this section. The amount owed at the end of a year equals to the debt owed at the beginning of the year plus any borrowings, and less any repayments. NOTE: Assume there is no typing mistakes in cells B10, C12, D12, E12. Table 1: 'NA' = Not Applicable, meaning no entry is required in the cell. A C 1 Star Motor Company 2 3 CONSTANTS 4 TAX RATE 5 MINIMUM CASH NEEDED TO START NEXT YEAR 6 UNIT MANUFACTURING COST REDUCTION FACTOR 7 FIXED COSTS 8 9 INPUTS 10 CREDIT AGENCY RATING (B = WEAK; J = JUNK) 11 UNIT CAR SALES INCREASE FACTOR (.XX) 12 INCENTIVES (S = STABLE; U = UP) 13 2019 2019 B ΝΑ ΝΑ ΝΑ J ΝΑ ΝΑ 2020 0.2 10000000 0.01 7000000000 2020 0.01 ΝΑ S 2021 0.2 10000000 0.01 D 7000000000 2021 -0.05 ΝΑ S 2022 0.2 10000000 0.01 7000000000 2022 E -0.09 ΝΑ U Table 1: continued A 19 CALCULATIONS 20 INTEREST RATE ON DEBT 21 AVERAGE NUMBER OF CAR UNITS SOLD 22 AVERAGE SELLING PRICE PER UNIT 23 AVERAGE COST TO MAKE A CAR UNIT 24 INTEREST EARNED PER UNIT SOLD INCOME STATEMENT AND 26 CASH FLOW STATEMENT 27 BEGINNING-OF-THE-YEAR CASH ON HAND 29 REVENUE 30 AUTO SALES 31 INTEREST EARNED 32 TOTAL REVENUE 33 COSTS 34 COST OF AUTOS SOLD 35 FIXED COSTS 36 TOTAL COSTS 37 INCOME BEFORE INTEREST AND TAX 38 INTEREST EXPENSE 39 INCOME BEFORE TAX 40 INCOME TAX EXPENSE 41 NET INCOME AFTER TAX TL NET CASH POSITION (NCP) BEFORE BORROWING AND REPAYMENT OF 43 DEBT (BEG OF YR CASH + NET INCOME) 44 ADD: BORROWING FROM BANK 45 LESS: REPAYMENT TO BANK 46 EQUALS: END-OF-THE-YEAR CASH ON HAND 48 DEBT OWED 49 BEGINNING-OF-THE-YEAR DEBT OWED 50 ADD: BORROWING FROM BANK 51 LESS: REPAYMENT TO BANK 52 EQUALS: END-OF-THE-YEAR DEBT OWED 50 2019 B ΝΑ 2125000 18700 15000 ΝΑ 2019 ΝΑ ΝΑ ΝΑ ΝΑ ΝΑ ΝΑ ΝΑ ΝΑ ΝΑ ΝΑ ΝΑ ΝΑ ΝΑ ΝΑ ΝΑ 10000000 2019 2020 ? [2 marks] ? [3 marks] ? [4 marks] ? [3 marks] ? [2 marks] 2020 ? [0.5 mark] ?[1 mark] ? [1 mark] ? [1 mark] ? [1 mark] ? [0.5 mark] ? [1 mark] ? [1 mark] ? [1 mark] ? [1 mark] ? [2 marks] ? [1 mark] ? [1 mark] ? [3 marks] ? [5 marks] ? [1 mark] 2020 ΝΑ ? [1 mark] ΝΑ ?[1 mark] ΝΑ ? [1 mark] 2000000000? [1 mark] D 2021 copy & paste copy & paste copy & paste copy & paste copy & paste copy & paste copy & paste copy & paste 2021 2022 copy & paste copy & paste copy & paste copy&paste copy & paste copy & paste copy&paste copy & paste copy & paste copy & paste copy & paste copy&paste copy & paste copy & paste 2021 E copy & paste copy & paste copy & paste copy & paste 2022 copy & paste copy & paste copy & paste copy & paste copy & paste copy & paste copy & paste copy & paste copy & paste copy & paste copy & paste copy & paste copy & paste copy & paste copy & paste copy & paste copy & paste copy & paste copy & paste copy & paste 2022 copy & paste copy & paste copy & paste copy & paste Star Motor Company has been successfully making autos and trucks for more than 100 years in the United States (U.S.), and was one of the dominant car companies in the U.S. automobile industry. Recent years, however, have been very difficult for Star. Indeed, they have been difficult years for all automobile companies. The automobile industry is now a highly competitive business globally. Twenty years ago, Star competed against only two other auto companies in the domestic market, but there are now a dozen large foreign auto companies to compete against. The emerging Chinese automobile companies that are subsidized by the Chinese government have very cheap labour costs. Competition from the Chinese vehicles is expected to drive down the selling price of all types of autos, and Star's sales and profit margins would be reduced dramatically in future. Star, currently, has very high debts as it owes US$20 billion at the end of year 2019 (cell B52), and interest expense is high. In the last two years, Star has just about broken even - net income after tax has been close to zero. Star's management is considering dissolving the company if large profits cannot be made in the next three years (2020 to 2022) before government policy makers allow Chinese car models to be sold massively in the U.S. Star's management reasons that Star's better models could be sold to other car companies and the proceeds distributed to the shareholders. This would be better than a slow march to bankruptcy, resulting in shareholders getting nothing. In year 2019, Star's management would like to forecast its financial situation such as the net income, debt owed and cash flow for the next three years (2020-2022) based on 2019's data so that Star's management can decide what to do next. You are asked to help Star's management and write Excel formulas in cells C19 to C52 to do these forecasts by performing a what-if analysis using Microsoft Excel. Most automobile industry executives also think there is an oversupply of autos and trucks relative to consumer demand. When supply exceeds demand, there will be downward pressure on selling price, and this forces Star's management to introduce two kinds of "incentive" programs: cash-back and special low rate financing. Cash-back incentive means offering discounts on the listed price of a car, for example offering US$5000 off a US$26,000 car. Special low-rate financing means lending money to car buyers at below-bank interest rates. Star may offer a combination of both kinds of incentive programs. Incentives are assumed a permanent feature of automobile marketing; and there are two levels of incentives (row 12): ● ● Up (U) - if competition is intense such that aggressive incentives (that means high price discounts and/or very low interest rate financing) are expected. Levels of incentives can vary from year to year. If incentives level is expected to be S for year 2020, S for year 2021 and U for year 2022, then the pattern SSU would be entered in cells C12 to E12. Stable (S) - if competition is not fierce such that incentives are expected to be at normal levels. Star has its own finance unit whose activity has been lending money to car buyers. This division borrows money at low interest rates in credit markets or from the company's bankers, and can make profits when lending this money to car buyers at higher interest rates. For example, the finance unit borrows money at 5% interest rate from its bank and then make loans to car buyers at 6% to 8% interest rate, thus Star makes money in the form of interest earned on car loans to car buyers. However, in periods of aggressive incentives with low-rate financing being offered to car buyers, Star's finance unit loses money because it lends money at a rate less than the rate Star borrows at. Star's finance unit also handles general corporate borrowings as well. For example, Star may want to borrow US$100 million to build a new manufacturing plant, then it would negotiate with the company's bankers to borrow money, or it would go to Wall Street sell bonds to raise money. All bond issuers are rated by independent credit analysis agencies. The ratings are intended as a measure of how likely a company is to pay off existing debts (interest and principle). A poor rating would reduce investor confidence and would mean that Star would have to borrow money at higher interest rates. A high rating would increase investor confidence in Star and means Star can borrow money at lower interest rates. Thus, credit agency rating greatly affects interest rates in the bond market, and it has two values for Star (cell B10): Weak (B) if competition is fierce, and Star is in great debt such that the rating is not expected to improve in the near future. Junk (J) - this is the lowest rating in the bond market if Star worsens nearly to default and requires government bailout. The credit agency rating entered in cell B10 applies to all three forecast years 2020 to 2022. ● ● - Increased competition also has effect on the number of car unit sales. The unit car sales increase factor in row 11 allows a decimal percentage change in unit car sales in a year to be entered. For example, if unit car sales were expected to go up 5%, then 0.05 would be entered for that year. If sales were expected to fall 7%, then -0.07 would be entered for that year. The following constants (rows 4 to 7) for the forecast are described below: ● ● ● ● Tax rate: The corporate tax rate is expected to be steady at 20% (row 4) for the next three years (2020-2022). ● Minimum cash needed to start next year: Star's policy is to have at least US$10 million cash on hand at the end of each year, in order to start next year's business (row 5), and thus this is the minimum cash needed at the end of each year. Calculations (rows 19 to 24) are described below: Unit manufacturing cost reduction factor: Each car requires direct costs, which include raw materials and direct labour during assembly. The average value of a car unit's direct costs is expected to go down 1% a year (row 6) in each of the next three years (that is 1% less than previous year). Fixed costs: Research-and-development costs, advertising and promotion costs and other general administrative costs are considered as fixed costs because these costs do not vary much with the number of autos sold. They are expected to be steady in the next three years at US$7 billion a year (row 7). Interest rate on debt (row 20): If the credit agency rating is weak (B) in the next three years, the interest rate paid on debt owed will be 5% in each of the next three years. If the rating is junk-bond (J) status, the interest rate will be 10% in each of the next three years. Average number of car units sold (row 21): The average number of car units sold in a year is based on the prior year's sales units and the unit car sales increase factor (see row 11). Average selling price per unit (row 22): If the level of incentives is expected to be stable (S) in a year, then Star can be expected to raise the average unit selling price per unit 1% over the prior year's price. However, if the level of incentives is expected to be up (U) in a year, the average unit selling price per unit in a year will be 5% less than the prior year's selling price. Direct cost to make a car unit (row 23): The average direct cost to make an automobile in a year is based on the prior year's direct cost to make a car unit, and on the unit manufacturing cost reduction factor. Interest earned per car unit sold (row 24): Majority of car buyers will finance the purchase through Star's finance unit. Financing is a source of income (or loss) to Starr. If the incentives are stable in a year, Star can expect to make on average about US$150 in interest revenue on a unit sold. However, if incentives are up, only about US$20 in interest revenue is earned per unit sold, on average. Income & Cash Flow Statements (rows 26 to 41) are described below: ● ● ● ● ● ● ● ● Cash at the beginning of a year (row 27): this is the cash at the end of previous year. Revenue from auto sales (row 30): This is based on the average number of car units sold in that year and on the average selling price per car unit in that year. Revenue from interest earned (row 31): This is based on the average number of car units sold in that year and on the interest earned per car unit sold in that year. Total revenue (row 32): This is the total revenue from auto sales and interest earned. Total direct costs of autos sold (row 34): This is based on the average number of car units sold in that year and on the average cost to make a car unit in that year. Fixed costs (row 35): Fixed costs do not vary much with the number of autos sold, and they include research-and-development costs, advertising and promotion costs and other general administrative costs. Total costs (row 36): This is the total of the direct costs and fixed costs in that year. Income before interest and tax (row 37): Before considering tax and interest expense, this is the difference between total revenue and total costs. Interest expense (row 38): This is a simple interest based on the year's interest rate and the debt owed at the beginning of that year. Income before tax (row 39): Before considering tax, but after considering interest expense, this is the difference between income before interest and tax, and interest expense. Income tax expense (row 40): This is zero if income before tax is zero or less; otherwise, apply the tax rate for the year to the income before tax. Net income after tax (row 41): This is the difference between income before tax and income tax expense. ● ● ● ● ● Debt Owed (rows 48 to 52) is described below: The amount of US$20 billion (cell B52) is already owed to bankers and bondholders at the end of 2019. ● Net Cash Position (NCP) (row 43): NCP at the end of a year equals the cash beginning of a year, plus the year's net income, assuming that there are no receivables or payables. ● Assume that Star's bankers will lend enough money (row 44) at the end of a year to get to Star's minimum cash target (see row 5). If the NCP is less than the minimum cash at the end of a year, Star must borrow enough to reach the minimum cash target. Borrowings increase cash on hand, of course. If the NCP is more than the minimum cash and there is outstanding debt from previous year(s), then some or all of the debt should be repaid, but not to take your company below the minimum cash level (row 45). Cash at the end of the year equals the NCP, plus any borrowings and less any repayments (row 46). Debt owed at the beginning of a year equals the debt owed at the end of previous year. Amounts borrowed and repaid that have been calculated before can be echoed to this section. The amount owed at the end of a year equals to the debt owed at the beginning of the year plus any borrowings, and less any repayments. NOTE: Assume there is no typing mistakes in cells B10, C12, D12, E12. Table 1: 'NA' = Not Applicable, meaning no entry is required in the cell. A C 1 Star Motor Company 2 3 CONSTANTS 4 TAX RATE 5 MINIMUM CASH NEEDED TO START NEXT YEAR 6 UNIT MANUFACTURING COST REDUCTION FACTOR 7 FIXED COSTS 8 9 INPUTS 10 CREDIT AGENCY RATING (B = WEAK; J = JUNK) 11 UNIT CAR SALES INCREASE FACTOR (.XX) 12 INCENTIVES (S = STABLE; U = UP) 13 2019 2019 B ΝΑ ΝΑ ΝΑ J ΝΑ ΝΑ 2020 0.2 10000000 0.01 7000000000 2020 0.01 ΝΑ S 2021 0.2 10000000 0.01 D 7000000000 2021 -0.05 ΝΑ S 2022 0.2 10000000 0.01 7000000000 2022 E -0.09 ΝΑ U Table 1: continued A 19 CALCULATIONS 20 INTEREST RATE ON DEBT 21 AVERAGE NUMBER OF CAR UNITS SOLD 22 AVERAGE SELLING PRICE PER UNIT 23 AVERAGE COST TO MAKE A CAR UNIT 24 INTEREST EARNED PER UNIT SOLD INCOME STATEMENT AND 26 CASH FLOW STATEMENT 27 BEGINNING-OF-THE-YEAR CASH ON HAND 29 REVENUE 30 AUTO SALES 31 INTEREST EARNED 32 TOTAL REVENUE 33 COSTS 34 COST OF AUTOS SOLD 35 FIXED COSTS 36 TOTAL COSTS 37 INCOME BEFORE INTEREST AND TAX 38 INTEREST EXPENSE 39 INCOME BEFORE TAX 40 INCOME TAX EXPENSE 41 NET INCOME AFTER TAX TL NET CASH POSITION (NCP) BEFORE BORROWING AND REPAYMENT OF 43 DEBT (BEG OF YR CASH + NET INCOME) 44 ADD: BORROWING FROM BANK 45 LESS: REPAYMENT TO BANK 46 EQUALS: END-OF-THE-YEAR CASH ON HAND 48 DEBT OWED 49 BEGINNING-OF-THE-YEAR DEBT OWED 50 ADD: BORROWING FROM BANK 51 LESS: REPAYMENT TO BANK 52 EQUALS: END-OF-THE-YEAR DEBT OWED 50 2019 B ΝΑ 2125000 18700 15000 ΝΑ 2019 ΝΑ ΝΑ ΝΑ ΝΑ ΝΑ ΝΑ ΝΑ ΝΑ ΝΑ ΝΑ ΝΑ ΝΑ ΝΑ ΝΑ ΝΑ 10000000 2019 2020 ? [2 marks] ? [3 marks] ? [4 marks] ? [3 marks] ? [2 marks] 2020 ? [0.5 mark] ?[1 mark] ? [1 mark] ? [1 mark] ? [1 mark] ? [0.5 mark] ? [1 mark] ? [1 mark] ? [1 mark] ? [1 mark] ? [2 marks] ? [1 mark] ? [1 mark] ? [3 marks] ? [5 marks] ? [1 mark] 2020 ΝΑ ? [1 mark] ΝΑ ?[1 mark] ΝΑ ? [1 mark] 2000000000? [1 mark] D 2021 copy & paste copy & paste copy & paste copy & paste copy & paste copy & paste copy & paste copy & paste 2021 2022 copy & paste copy & paste copy & paste copy&paste copy & paste copy & paste copy&paste copy & paste copy & paste copy & paste copy & paste copy&paste copy & paste copy & paste 2021 E copy & paste copy & paste copy & paste copy & paste 2022 copy & paste copy & paste copy & paste copy & paste copy & paste copy & paste copy & paste copy & paste copy & paste copy & paste copy & paste copy & paste copy & paste copy & paste copy & paste copy & paste copy & paste copy & paste copy & paste copy & paste 2022 copy & paste copy & paste copy & paste copy & paste
Expert Answer:
Answer rating: 100% (QA)
To help Stars management forecast its financial situation we need to calculate the following values Net Income This can be calculated using the formula RevenueCostsInterest We will assume that revenue ... View the full answer

Related Book For 
Accounting for Governmental and Nonprofit Entities
ISBN: ?978-0073379609
15th Edition
Authors: Earl R. Wilson, Jacqueline L Reck, Susan C Kattelus
Posted Date:
Students also viewed these accounting questions
-
The compact car market in the United States is extremely competitive. Sales for six of the top models for six months in 2011 follow (Motor Trend, November 2, 2011)? At the .05 level of significance,...
-
Sales from weight-reducing agents marketed in the United States represent sizable amounts of income for many of the companies that manufacture these products. Psychological as well as physical...
-
There is no point in the United States complaining about trade policies in Japan and Europe. Each country has a right to do whatever is in its own best interest. Instead of complaining about foreign...
-
Build Right Supply, Co., shows the following financial statement data for 2014, 2015, and 2016. Prior to issuing the 2016 statements, auditors found the ending inventory for 2014 was understated by...
-
Records for the past several years show that the amount of money collected daily by a prominent televangelist is normally distributed with a mean () of $20,000 and a standard deviation () of $5000....
-
Recording and Reporting an Equity Method Security Felicia Company acquired some of the 60,000 outstanding common shares of Nueces Corporation during 2014, as a non- current investment. The fiscal...
-
Discuss the various aspects of top-down and bottom-up budgeting and the advantages and disadvantages of each of these approaches to developing a project budget.
-
Paul Swanson has an opportunity to acquire a franchise from The Yogurt Place, Inc., to dispense frozen yogurt products under The Yogurt Place name. Mr. Swanson has assembled the following information...
-
Find current news article (within the last year) which discusses lean logistics in the global economy. Provide a brief (word summary of that article). Highlight how the concepts covered within that...
-
A $1000, 9.5% bond with semi-annual coupons redeemable at par on March 1, 2026, was purchased on September 19, 2017, to yield 7% compounded semi-annually. What was the purchase price?
-
1.8: 4.5 mix has a water/cement ratio of 0.6 and a cement content of 300 kg/m 3. The temperature of the ingredients are as follows: cement 18 C, aggregate: 300C, water: 20 C. a) Assuming that the...
-
Zymosis Manufacturing produces a pesticide chemical and uses process costing. There are three processing departments-Mixing, Refining, and Packaging. On January 1, the Refining Department had 3,000...
-
In what ways does symbolic interactionism offer a framework for understanding the construction of identity in virtual spaces, and how might this impact traditional notions of community and...
-
Payton Corporation provided the following information for the year: Beginning Balance-Work-in-Process Inventory Ending Balance-Work-in-Process Inventory Beginning Balance- Direct Materials Ending...
-
How does Foucault's concept of "bio power" explain the relationship between state institutions and societal control, and in what ways does this relate to modern forms of surveillance and regulation...
-
How do structural-functional theories contribute to our understanding of social stability and change, and to what extent do they overlook issues of power and conflict in shaping social order ?
-
Assume you are investigating buying one of two different robots. The annual benefits are unknown (but equal between the alternatives), and the costs and salvage value are listed below. Which should...
-
Determine the volume of the parallelepiped of Fig. 3.25 when (a) P = 4i 3j + 2k, Q = 2i 5j + k, and S = 7i + j k, (b) P = 5i j + 6k, Q = 2i + 3j + k, and S = 3i 2j + 4k. P
-
Explain the criteria for determining if a governmental or enterprise find must be reported as a major fund. What other funds should or may be reported as major funds?
-
If you were trying to assess the financial health of a government administered pension plan, which financial statements or schedules would you review and why?
-
Central Garage Internal Service Fund. The City of Ashville operates an internal service fund to provide garage space and repairs for all city-owned-and-operated vehicles. The Central Garage Fund was...
-
The tube is subjected to a torque of 750 N. m. Determine the amount of this torque that is resisted by the gray shaded section. Solve the problem two ways: (a) by using the torsion formula, (b) by...
-
The solid shaft has a diameter of 0.75 in. If it is subjected to the torques shown, determine the maximum shear stress developed in regions BC and DE of the shaft. The bearings at A and F allow free...
-
The solid shaft has a diameter of 0.75 in. If it is subjected to the torques shown, determine the maximum shear stress developed in regions CD and EF of the shaft. The bearings at A and F allow free...

Study smarter with the SolutionInn App