

Start with the partial model in the file Ch12 P11 Build a Model.xlsx on the textbook's...
Fantastic news! We've Found the answer you've been seeking!
Question:
Transcribed Image Text:
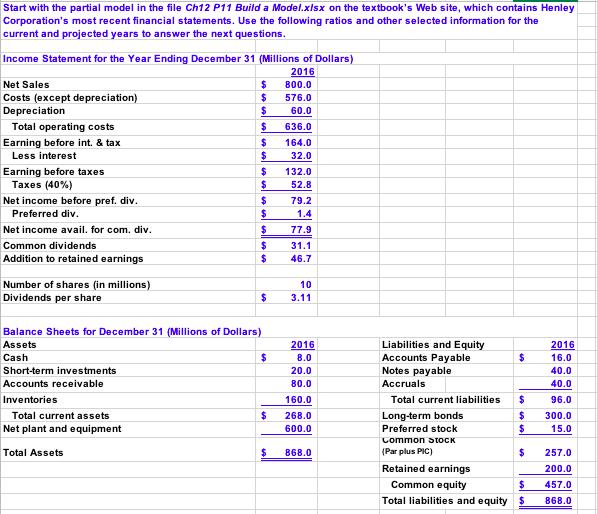
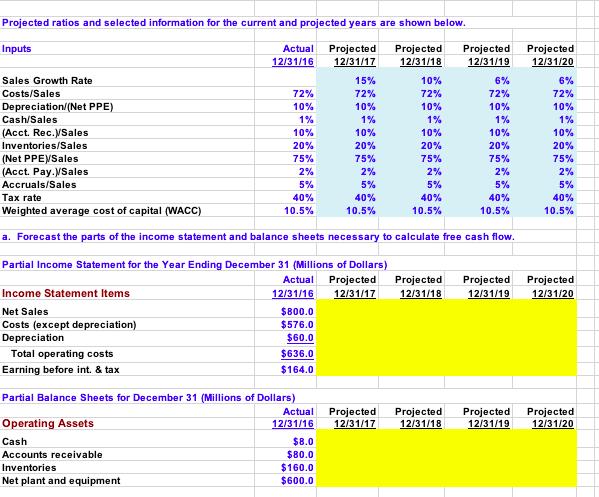
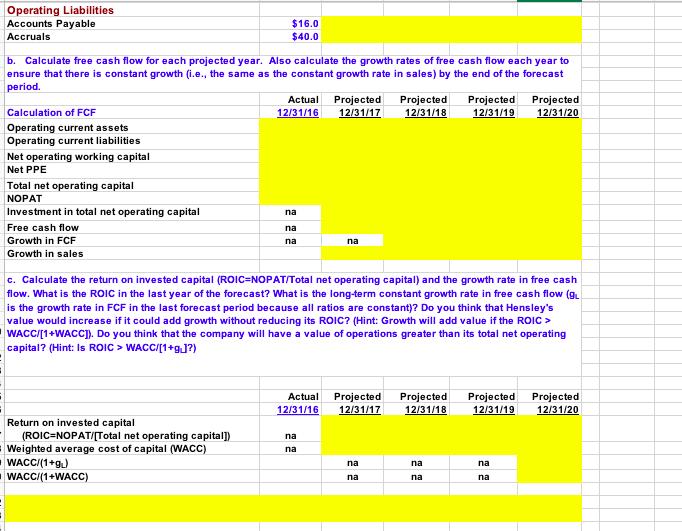
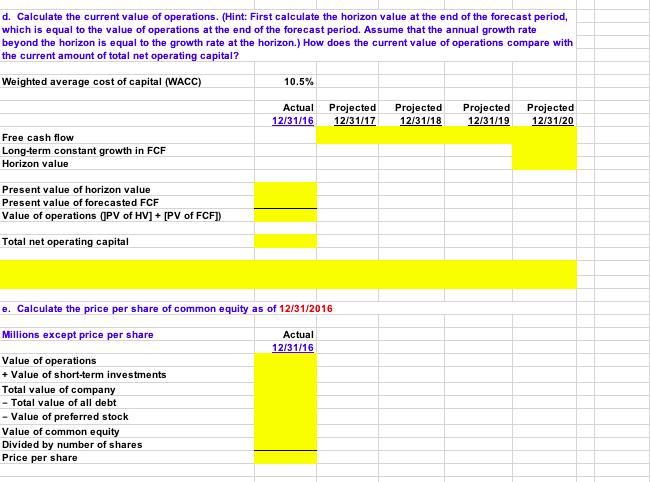
Start with the partial model in the file Ch12 P11 Build a Model.xlsx on the textbook's Web site, which contains Henley Corporation's most recent financial statements. Use the following ratios and other selected information for the current and projected years to answer the next questions. Income Statement for the Year Ending December 31 (Millions of Dollars) 2016 Net Sales Costs (except depreciation) Depreciation Total operating costs Earning before int. & tax Less interest Earning before taxes Taxes (40%) Net income before pref. div. Preferred div. Net income avail. for com. div. Common dividends Addition to retained earnings Number of shares (in millions) Dividends per share $ $ $ Short-term investments Accounts receivable Inventories Total current assets Net plant and equipment Total Assets $ $ $ $ $ $ $ $ $ $ $ Balance Sheets for December 31 (Millions of Dollars) Assets Cash $ $ $ 800.0 576.0 60.0 636.0 164.0 32.0 132.0 52.8 79.2 1.4 77.9 31.1 46.7 10 3.11 2016 8.0 20.0 80.0 160.0 268.0 600.0 868.0 Liabilities and Equity Accounts Payable Notes payable Accruals Total current liabilities $ $ Long-term bonds Preferred stock Common STOCK (Par plus PIC) $ Retained earnings Common equity $ $ $ Total liabilities and equity $ 2016 16.0 40.0 40.0 96.0 300.0 15.0 257.0 200.0 457.0 868.0 Projected ratios and selected information for the current and projected years are shown below. Inputs Actual Projected Projected Projected 12/31/16 12/31/17 12/31/18 12/31/19 Sales Growth Rate Costs/Sales Depreciation/(Net PPE) Cash/Sales (Acct. Rec.)/Sales Inventories/Sales (Net PPE /Sales (Acct. Pay.\/Sales Accruals/Sales Tax rate Weighted average cost of capital (WACC) a. Forecast the parts of the income statement and balance sheets necessary to calculate free cash flow. 72% 10% 1% Income Statement Items Net Sales Costs (except depreciation) Depreciation Total operating costs Earning before int. & tax 10% 20% 75% 2% 5% 40% 10.5% Partial Income Statement for the Year Ending December 31 (Millions of Dollars) 15% 72% 10% 1% 10% 20% 75% 2% 5% $800.0 $576.0 $60.0 $636.0 $164.0 Partial Balance Sheets for December 31 (Millions of Dollars) Actual Operating Assets 12/31/16 Cash Accounts receivable Inventories Net plant and equipment 40% 10.5% $8.0 $80.0 $160.0 $600.0 10% 72% 10% 1% 10% 20% 75% 2% 5% 40% 10.5% 6% 72% 10% Projected Projected 12/31/17 12/31/18 1% 10% 20% 75% 2% 5% 40% 10.5% Projected 12/31/20 6% 72% 10% 1% Actual Projected Projected Projected Projected 12/31/16 12/31/17 12/31/18 12/31/19 12/31/20 10% 20% 75% 2% 5% 40% 10.5% XX Projected Projected 12/31/19 12/31/20 Operating Liabilities Accounts Payable Accruals b. Calculate free cash flow for each projected year. Also calculate the growth rates of free cash flow each year to ensure that there is constant growth (i.e., the same as the constant growth rate in sales) by the end of the forecast period. Calculation of FCF Operating current assets Operating current liabilities Net operating working capital Net PPE Total net operating capital NOPAT Investment in total net operating capital Free cash flow Growth in FCF Growth in sales $16.0 $40.0 Return on invested capital (ROIC=NOPAT/[Total net operating capital]) Weighted average cost of capital (WACC) WACC/(1+gL) WACC/(1+WACC) Actual Projected 12/31/16 12/31/17 na na na na c. Calculate the return on invested capital (ROIC-NOPAT/Total net operating capital) and the growth rate in free cash flow. What is the ROIC in the last year of the forecast? What is the long-term constant growth rate in free cash flow (9L is the growth rate in FCF in the last forecast period because all ratios are constant)? Do you think that Hensley's value would increase if it could add growth without reducing its ROIC? (Hint: Growth will add value if the ROIC > WACC/[1+WACC]). Do you think that the company will have a value of operations greater than its total net operating capital? (Hint: Is ROIC > WACC/[1+g]?) na na Projected 12/31/18 Actual Projected Projected Projected 12/31/16 12/31/17 12/31/18 12/31/19 na па Projected Projected 12/31/19 12/31/20 na na na na Projected 12/31/20 d. Calculate the current value of operations. (Hint: First calculate the horizon value at the end of the forecast period, which is equal to the value of operations at the end of the forecast period. Assume that the annual growth rate beyond the horizon is equal to the growth rate at the horizon.) How does the current value of operations compare with the current amount of total net operating capital? Weighted average cost of capital (WACC) Free cash flow Long-term constant growth in FCF Horizon value Present value of horizon value Present value of forecasted FCF Value of operations (JPV of HV] + [PV of FCF]) Total net operating capital 10.5% Value of operations + Value of short-term investments Total value of company - Total value of all debt - Value of preferred stock Value of common equity Divided by number of shares Price per share Actual 12/31/16 e. Calculate the price per share of common equity as of 12/31/2016 Millions except price per share Projected Projected Projected Projected 12/31/17 12/31/18 12/31/19 12/31/20 Actual 12/31/16 Start with the partial model in the file Ch12 P11 Build a Model.xlsx on the textbook's Web site, which contains Henley Corporation's most recent financial statements. Use the following ratios and other selected information for the current and projected years to answer the next questions. Income Statement for the Year Ending December 31 (Millions of Dollars) 2016 Net Sales Costs (except depreciation) Depreciation Total operating costs Earning before int. & tax Less interest Earning before taxes Taxes (40%) Net income before pref. div. Preferred div. Net income avail. for com. div. Common dividends Addition to retained earnings Number of shares (in millions) Dividends per share $ $ $ Short-term investments Accounts receivable Inventories Total current assets Net plant and equipment Total Assets $ $ $ $ $ $ $ $ $ $ $ Balance Sheets for December 31 (Millions of Dollars) Assets Cash $ $ $ 800.0 576.0 60.0 636.0 164.0 32.0 132.0 52.8 79.2 1.4 77.9 31.1 46.7 10 3.11 2016 8.0 20.0 80.0 160.0 268.0 600.0 868.0 Liabilities and Equity Accounts Payable Notes payable Accruals Total current liabilities $ $ Long-term bonds Preferred stock Common STOCK (Par plus PIC) $ Retained earnings Common equity $ $ $ Total liabilities and equity $ 2016 16.0 40.0 40.0 96.0 300.0 15.0 257.0 200.0 457.0 868.0 Projected ratios and selected information for the current and projected years are shown below. Inputs Actual Projected Projected Projected 12/31/16 12/31/17 12/31/18 12/31/19 Sales Growth Rate Costs/Sales Depreciation/(Net PPE) Cash/Sales (Acct. Rec.)/Sales Inventories/Sales (Net PPE /Sales (Acct. Pay.\/Sales Accruals/Sales Tax rate Weighted average cost of capital (WACC) a. Forecast the parts of the income statement and balance sheets necessary to calculate free cash flow. 72% 10% 1% Income Statement Items Net Sales Costs (except depreciation) Depreciation Total operating costs Earning before int. & tax 10% 20% 75% 2% 5% 40% 10.5% Partial Income Statement for the Year Ending December 31 (Millions of Dollars) 15% 72% 10% 1% 10% 20% 75% 2% 5% $800.0 $576.0 $60.0 $636.0 $164.0 Partial Balance Sheets for December 31 (Millions of Dollars) Actual Operating Assets 12/31/16 Cash Accounts receivable Inventories Net plant and equipment 40% 10.5% $8.0 $80.0 $160.0 $600.0 10% 72% 10% 1% 10% 20% 75% 2% 5% 40% 10.5% 6% 72% 10% Projected Projected 12/31/17 12/31/18 1% 10% 20% 75% 2% 5% 40% 10.5% Projected 12/31/20 6% 72% 10% 1% Actual Projected Projected Projected Projected 12/31/16 12/31/17 12/31/18 12/31/19 12/31/20 10% 20% 75% 2% 5% 40% 10.5% XX Projected Projected 12/31/19 12/31/20 Operating Liabilities Accounts Payable Accruals b. Calculate free cash flow for each projected year. Also calculate the growth rates of free cash flow each year to ensure that there is constant growth (i.e., the same as the constant growth rate in sales) by the end of the forecast period. Calculation of FCF Operating current assets Operating current liabilities Net operating working capital Net PPE Total net operating capital NOPAT Investment in total net operating capital Free cash flow Growth in FCF Growth in sales $16.0 $40.0 Return on invested capital (ROIC=NOPAT/[Total net operating capital]) Weighted average cost of capital (WACC) WACC/(1+gL) WACC/(1+WACC) Actual Projected 12/31/16 12/31/17 na na na na c. Calculate the return on invested capital (ROIC-NOPAT/Total net operating capital) and the growth rate in free cash flow. What is the ROIC in the last year of the forecast? What is the long-term constant growth rate in free cash flow (9L is the growth rate in FCF in the last forecast period because all ratios are constant)? Do you think that Hensley's value would increase if it could add growth without reducing its ROIC? (Hint: Growth will add value if the ROIC > WACC/[1+WACC]). Do you think that the company will have a value of operations greater than its total net operating capital? (Hint: Is ROIC > WACC/[1+g]?) na na Projected 12/31/18 Actual Projected Projected Projected 12/31/16 12/31/17 12/31/18 12/31/19 na па Projected Projected 12/31/19 12/31/20 na na na na Projected 12/31/20 d. Calculate the current value of operations. (Hint: First calculate the horizon value at the end of the forecast period, which is equal to the value of operations at the end of the forecast period. Assume that the annual growth rate beyond the horizon is equal to the growth rate at the horizon.) How does the current value of operations compare with the current amount of total net operating capital? Weighted average cost of capital (WACC) Free cash flow Long-term constant growth in FCF Horizon value Present value of horizon value Present value of forecasted FCF Value of operations (JPV of HV] + [PV of FCF]) Total net operating capital 10.5% Value of operations + Value of short-term investments Total value of company - Total value of all debt - Value of preferred stock Value of common equity Divided by number of shares Price per share Actual 12/31/16 e. Calculate the price per share of common equity as of 12/31/2016 Millions except price per share Projected Projected Projected Projected 12/31/17 12/31/18 12/31/19 12/31/20 Actual 12/31/16
Expert Answer:

Related Book For 
Financial Management Theory and Practice
ISBN: 978-1305632295
15th edition
Authors: Eugene F. Brigham, Michael C. Ehrhardt
Posted Date:
Students also viewed these general management questions
-
Start with the partial model in the file Ch12 P11 Build a Model.xlsx on the textbook's Web site, which contains Henley Corporation's most recent financial statements. Use the following ratios and...
-
Start with the partial model in the file Ch12 P11 Build a Model.xlsx on the textbook's Web site, which contains Henley Corporation's most recent financial statements. Use the following ratios and...
-
Start with the partial model in the file Ch12 P10 Build a Model.xlsx on the text book's Web site, which contains the 2016 financial statements of Zieber Corporation. Forecast Zieber's 2017 income...
-
DFI of real sequences with odd harmonics only Let x(n) be an N -point real sequence with N-point DFT X(k) (N even). In addition, x(n) satisfied the following symmetry property: x(n + N/2) = -x(n) n =...
-
Not long ago investigators were surprised to learn that more than 95% of a mammalian genome is transcribed even though less than 2% encodes proteins. What kind of evidence could be used to determine...
-
On January 1, 2013, Perry Company purchased 80% of Selby Company for $960,000. At that time Selby had capital stock outstanding of $400,000 and retained earnings of $400,000. The fair value of Selby...
-
Derive the mean-variance hedge formula given by (12.12). h FT-Fo 2r var(FT) cov(x, FT) var(FT) (12.12)
-
Manufacturing cost flow for one-year period Burnside Manufacturing started 2011 with the following account balances. Transactions during 2011 1. Purchased $750 of raw materials with cash. 2....
-
Mose Ga Twife This Individual assignment asks you to do a practical business situation review for a business research topic. As discussed in e-class, you are assigned a specific topic; see list...
-
Roedel Electronics produces tablet computer accessories, including integrated keyboard tablet stands that connect a keyboard to a tablet device and holds the device at a preferred angle for easy...
-
0.488 g of solid Mg(OH) are dissolved in 25.0 mL of a 20 M HNO solution. After the reaction is comp the solution remains acidic. a) Write a balanced equation for the reaction that has occurred. b) If...
-
What are some ways that educators can simultaneously have high expectations of their students and acknowledge their individual needs?
-
At a relationship level, there are implied causal models but we are not able to know the direction of a relationship from correlation alone. For example, we may know a family where parents appear to...
-
Shore Co. sold merchandise to Blue Star Co. on account, $112,000, terms FOB shipping point, n/30. The cost of the goods sold is $67,200. Shore paid freight of $1,800. Shore Co. issued a credit memo...
-
The price elasticity of demand is -1.4 and the price fell from $100 to $95. What happened to the total revenue? (Hint: for small changes, the percentage change in revenue is approximately equal to...
-
Discuss and elaborate on financial management in the field of working capital management. Provide a minimum of six paragraphs or more. It must include an introduction, development and conclusion. In...
-
If a set of vectors laid tail to head forms a closed polygon, the resultant is zero. Is this statement true? Discuss. A rock is dropped at the same instant as a ball, at the same initial elevation,...
-
True & False The basis of an asset must be reduced by the depreciation allowable, 2. Adjusted gross income (AGI) is the basis for a number of phase-outs of deductions. 3. A change to adjusted gross...
-
Stevens Textile Corporation's 2016 financial statements are shown below: Balance Sheet as of December 31, 2016 (Thousands of Dollars) Cash ............................... $ 1,080 .......... Accounts...
-
a. (1) What is meant by the term "distribution policy"? How has the mix of dividend payouts and stock repurchases changed over time? (2) The terms "irrelevance," "dividend preference" (or...
-
Maggie's Muffins Bakery generated $5,000,000 in sales during 2016, and its year-end total assets were $2,500,000. Also, at year-end 2016, current liabilities were $1,000,000, consisting of $300,000...
-
Draw a demand and supply graph for the federal funds market to show the demand and supply of reserves in the current ample-reserves regime. How can the Fed increase the federal funds rate? Show the...
-
What is the zero lower bound in monetary policy? What tools can the Fed use if it wants to implement an expansionary monetary policy at the zero lower bound?
-
How did the Fed hit its target for the federal funds rate in the pre-2008 scarce-reserves regime?

Study smarter with the SolutionInn App