

The possum dataset contains the body measurements for n = 43 female possums captured in eastern Australia.
Question:
The possum dataset contains the body measurements for n = 43 female possums captured in eastern Australia. For each possum, the following measurements (among others) were recorded:
- totlngth — Total length, in centimeters
- taill — Tail length, in centimeters
Part of the data is shown below. You may assume that the data represents a random sample from all female possums in eastern Australia.
| Possum # | Location captured | Total Length (cm) | Tail Length (cm) |
|---|---|---|---|
| 1 | Victoria | 91.5 | 36.5 |
| 2 | Victoria | 95.5 | 39.0 |
| 3 | Victoria | 92.0 | 38.0 |
| ⋮ | ⋮ | ⋮ | ⋮ |
| 42 | New South Wales/Queensland | 89.0 | 38.0 |
| 43 | New South Wales/Queensland | 89.0 | 40.0 |
| Sample mean | x̄ = 87.91 | ȳ = 37.10 | |
| Sample standard deviation | sx = 4.18 | sy = 1.83 | |
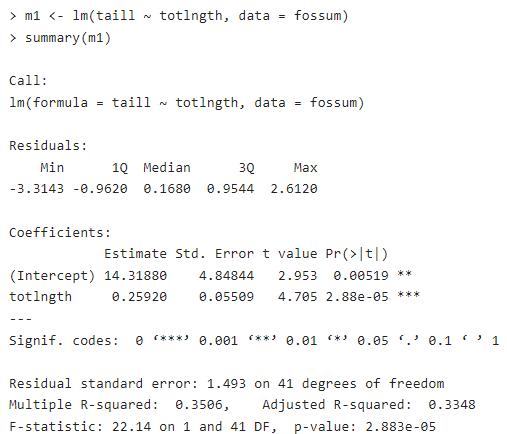
In this problem, we consider using a linear regression model to predict the tail length from the total length. The summary of the linear regression model for taill on totlngth is given in the following:
- Write down the estimated population regression line.
- Please answer the following questions regarding the coefficients.
- Interpret the value of the slope b of the sample regression line in the context of the problem.
Is it meaningful to interpret the value of the intercept a of the sample regression line in the context of the problem? If so, give an interpretation for a. If not, explain why it is not meaningful to interpret a.
- The total length of possum #26 was 85 cm, and its actual tail length was 36 cm. Find the predicted tail length for this possum using the estimated population regression line in question 1, and calculate the residual.
- State the value of r2, and interpret it in the context of the problem.
- Find the correlation r between the total length and the tail length, and state the strength and direction of the linear association between these variables.
- Besides the random sample assumption, the linear regression model requires three additional assumptions. Use plots A—C at the bottom of the problem description to determine if these assumptions are satisfied. You only need to assess ONE assumption for complete credit. Please specify which assumption your check and which plot (A, B, or C) you use.
- Regardless of your answer in the previous question, assume that all the assumptions for the linear regression model have been satisfied. Use the R output to test whether β = 0 at the 0.05 level, where β is the slope of the population regression line between the total length and the tail length for female possums. Show all five steps, and remember to interpret your conclusion.
Expert Answer:
1 Write down the estimated population regression line Tail 1431880 025920total length 2 Interpretati... View the full answer


Governmental and Nonprofit Accounting
ISBN: 978-0132751261
10th edition
Authors: Robert Freeman, Craig Shoulders, Gregory Allison, Robert Smi
