

You are a team of consulting engineers studying the flow of water from a certain river into
Question:
You are a team of consulting engineers studying the flow of water from a certain river into a large lake. You have data in the form of a graph detailing the amount of water that has flowed into the lake from the river over a fourteen-day period. The graph is given in Figure 1. 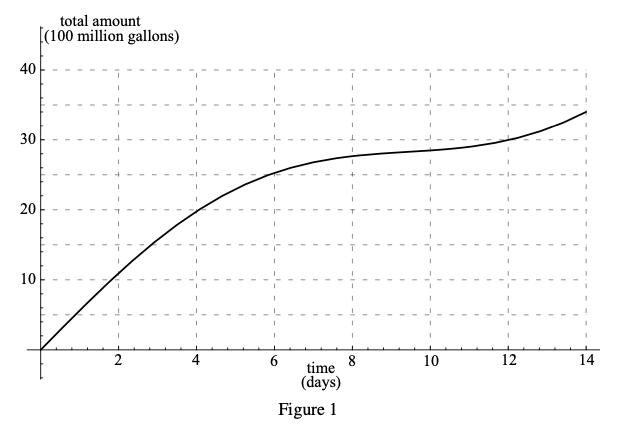
- Construct a graph of the rate of flow of the river for the fourteen-day period.
- Your group’s client is considering building as mall hydroelectric plant near the mouth of the river. For the project to be feasible, the plant needs to be able to operate at full capacity at least 70% of the time and at reduced capacity at least another 15% of the time.
To operate at full capacity, a flow rate of at least 200 million gallons per day is required. However, if the flow rate rises above 400 million gallons per day, the equipment is stressed, and the plant must close down.
If the flow rate is too small for full capacity operation, the plant can still operate at reduced capacity as long as the flow rate remains above 125 million gallons per day.
Although a statistical analysis is what is needed for a final decision on the plant, what can you tell your client about the two-week observation period that would be relevant to the hydroelectric project?
- Suppose that the total flow for a two-week period is 35 hundred million gallons.
(a) Give examples of different flow curves that are “good” for the power plant. Explain what you mean by “good.” Explain what the curves mean in terms of the river and the lake.
(b) Suppose your client is concerned with having more power available during peak load periods (6 A.M.–8 A.M. and 9 P.M.–midnight). Draw some flow curves that are beneficial for your client. How do these flow curves differ from the ones you drew above?
Expert Answer:


Fundamentals of Thermal-Fluid Sciences
ISBN: 978-0078027680
5th edition
Authors: Yunus A. Cengel, Robert H. Turner, John M. Cimbala
