

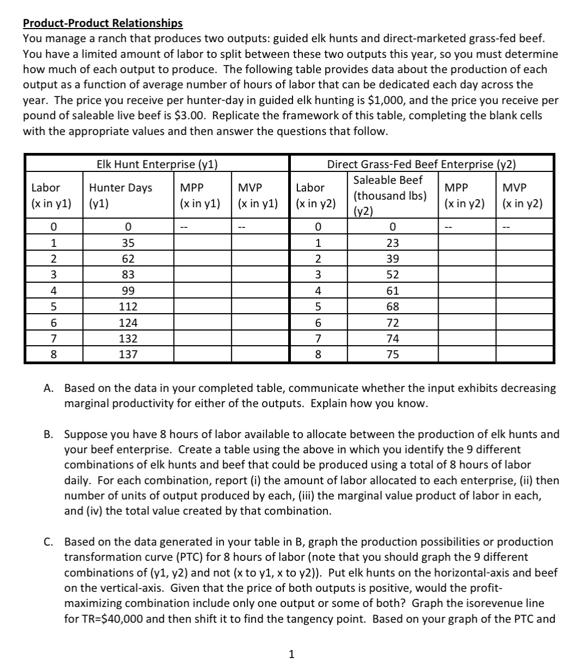
Product-Product Relationships You manage a ranch that produces two outputs: guided elk hunts and direct-marketed grass-fed...
Fantastic news! We've Found the answer you've been seeking!
Question:
Expert Answer:

Related Book For 

Managerial economics
ISBN: 978-1118041581
7th edition
Authors: william f. samuelson stephen g. marks
Posted Date:
