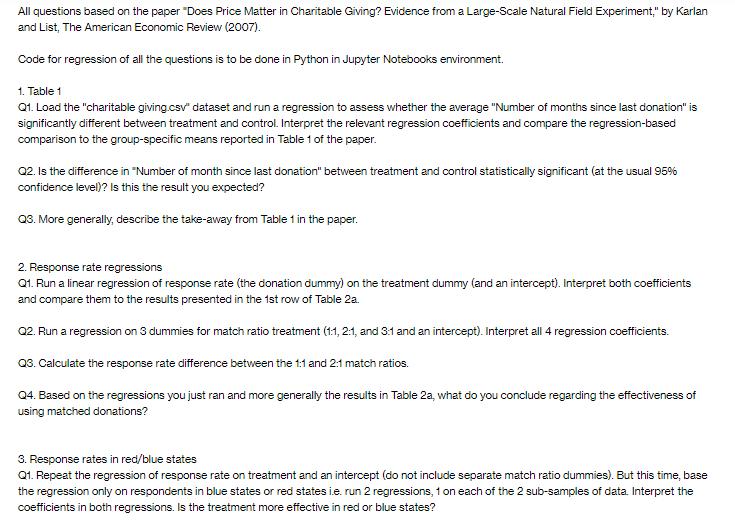
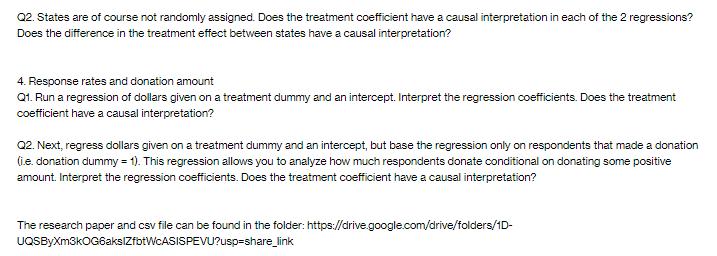
All questions based on the paper Does Price Matter in Charitable Giving? Evidence from a Large-Scale...
Fantastic news! We've Found the answer you've been seeking!
Question:
![](https://dsd5zvtm8ll6.cloudfront.net/si.experts.images/questions/2023/09/64f6c2d1b4cf1_1693893330052.jpg)
![](https://dsd5zvtm8ll6.cloudfront.net/si.experts.images/questions/2023/09/64f6c2e028551_1693893344821.jpg)
Transcribed Image Text:
All questions based on the paper "Does Price Matter in Charitable Giving? Evidence from a Large-Scale Natural Field Experiment," by Karlan and List, The American Economic Review (2007). Code for regression of all the questions is to be done in Python in Jupyter Notebooks environment. 1. Table 1 Q1. Load the "charitable giving.csv" dataset and run a regression to assess whether the average "Number of months since last donation" is significantly different between treatment and control. Interpret the relevant regression coefficients and compare the regression-based comparison to the group-specific means reported in Table 1 of the paper. Q2. Is the difference in "Number of month since last donation" between treatment and control statistically significant (at the usual 95% confidence level)? Is this the result you expected? Q3. More generally, describe the take-away from Table 1 in the paper. 2. Response rate regressions Q1. Run a linear regression of response rate (the donation dummy) on the treatment dummy (and an intercept). Interpret both coefficients and compare them to the results presented in the 1st row of Table 2a. Q2. Run a regression on 3 dummies for match ratio treatment (1:1, 2:1, and 3:1 and an intercept). Interpret all 4 regression coefficients. Q3. Calculate the response rate difference between the 1:1 and 2:1 match ratios. Q4. Based on the regressions you just ran and more generally the results in Table 2a, what do you conclude regarding the effectiveness of using matched donations? 3. Response rates in red/blue states Q1. Repeat the regression of response rate on treatment and an intercept (do not include separate match ratio dummies). But this time, base the regression only on respondents in blue states or red states i.e. run 2 regressions, 1 on each of the 2 sub-samples of data. Interpret the coefficients in both regressions. Is the treatment more effective in red or blue states? All questions based on the paper "Does Price Matter in Charitable Giving? Evidence from a Large-Scale Natural Field Experiment," by Karlan and List, The American Economic Review (2007). Code for regression of all the questions is to be done in Python in Jupyter Notebooks environment. 1. Table 1 Q1. Load the "charitable giving.csv" dataset and run a regression to assess whether the average "Number of months since last donation" is significantly different between treatment and control. Interpret the relevant regression coefficients and compare the regression-based comparison to the group-specific means reported in Table 1 of the paper. Q2. Is the difference in "Number of month since last donation" between treatment and control statistically significant (at the usual 95% confidence level)? Is this the result you expected? Q3. More generally, describe the take-away from Table 1 in the paper. 2. Response rate regressions Q1. Run a linear regression of response rate (the donation dummy) on the treatment dummy (and an intercept). Interpret both coefficients and compare them to the results presented in the 1st row of Table 2a. Q2. Run a regression on 3 dummies for match ratio treatment (1:1, 2:1, and 3:1 and an intercept). Interpret all 4 regression coefficients. Q3. Calculate the response rate difference between the 1:1 and 2:1 match ratios. Q4. Based on the regressions you just ran and more generally the results in Table 2a, what do you conclude regarding the effectiveness of using matched donations? 3. Response rates in red/blue states Q1. Repeat the regression of response rate on treatment and an intercept (do not include separate match ratio dummies). But this time, base the regression only on respondents in blue states or red states i.e. run 2 regressions, 1 on each of the 2 sub-samples of data. Interpret the coefficients in both regressions. Is the treatment more effective in red or blue states?
Expert Answer:
Answer rating: 100% (QA)
Python code for running regressions on the charitable giving dataset Import necessary libraries import pandas as pd import numpy as np import statsmodelsformulaapi as sm Load the charitable giving dat... View the full answer
Related Book For
Posted Date:
Students also viewed these programming questions
-
As a network administrator, you will write a system monitoring Python script to achieve below requirements: The script will run at 3am every Sat. In the top of your report, we need to see the...
-
Planning is one of the most important management functions in any business. A front office managers first step in planning should involve determine the departments goals. Planning also includes...
-
Read the case study "Southwest Airlines," found in Part 2 of your textbook. Review the "Guide to Case Analysis" found on pp. CA1 - CA11 of your textbook. (This guide follows the last case in the...
-
A small, 2-ha, mostly impervious urban catchment has an average slope of 1.5% and the following average. Horton infiltration parameters: f0 = 4 mm/hr, fc = 1 mm/hr, k = 2.2 hr-1. (Infiltration occurs...
-
Caitlin Maguire and Fiona Whelan, two college friends, decided to set up a house-cleaning business called Maguire & Whelan Cleaning Services. On January 1, 2014, they put their resources together,...
-
Refer to the information for Vestibule in PB5-4. Additional information for Vestibules most recent year of operations follows: Number of units produced ..................... 3,000 Number of units...
-
Use the data provided in P 7, but assume that the company uses the perpetual inventory system. (Hint: In preparing the solutions required below, it is helpful to determine the balance of inventory...
-
Bond rating agencies have invested significant sums of money in an effort to determine which quantitative and nonquantitative factors best predict bond defaults. Furthermore, some of the raters...
-
Cost out a proposed merit increase for two different companies for the year 2 0 2 5 . Each of these companies are considering two different merit increase amounts and two different start dates. The...
-
The following equations were estimated using the data in ECONMATH. The first equation is for men and the second is for women. The third and fourth equations combine men and women. (i) Compute the...
-
Case 3: ABRAMS COMPANY Abrams Company manufactures miniature speakers that are built into the headrests of high- end lounge chairs. Based on experience, Abrams has found that its total annual...
-
1.Payne Company developed the following data for the current year: Beginning work in process inventory $68,000 Direct materials used 104,000 Actual overhead 88,000 Overhead applied 92,000 Cost of...
-
Philco Chemicals makes a patented glue for gluing electronic components together. They have a CPU fan glue and a Moltherboard component glue. The glues use two patented chemical bonding agents called...
-
A friend has confided in you that they have recently inherited a moderately sized investment portfolio from a relative. They don't know what to do with the assets. The friend comes to you for advice....
-
Airtel and MTN are engaged in a battle to win customers from a saturated market of mobile users. Historically, they both know that intensive advertising can help them win customers from other...
-
Complete a mini-interview and describe an agency's mission, goals, and program objectives. For this discussion, you will need to have completed that interview and use information gathered to complete...
-
(b) [8 points] Find the sum of the following series if it exists. M8 3 n(n+3) en + 3n-1
-
Choose two matrices A and B with dimension 2 x 2. Calculate det A, det B, and det (AB). Repeat this process until you are able to discover how these three determinants are related. Summarize your...
-
Distinguish between industrial relations and human resource management.
-
What is interest arbitration and when might it be used?
-
Identify some of the individual and situational factors that might determine whether a strike or lockout happens.
-
Calculate profitability and asset management ratios using sales and receivables data.} - Because sales revenue is such a key component of a company's success, analysts are interested in a large...
-
When is revenue generally considered earned?LO6
-
Explain the criteria for revenue recognition.LO3
![Mobile App Logo](https://dsd5zvtm8ll6.cloudfront.net/includes/images/mobile/finalLogo.png)
Study smarter with the SolutionInn App