

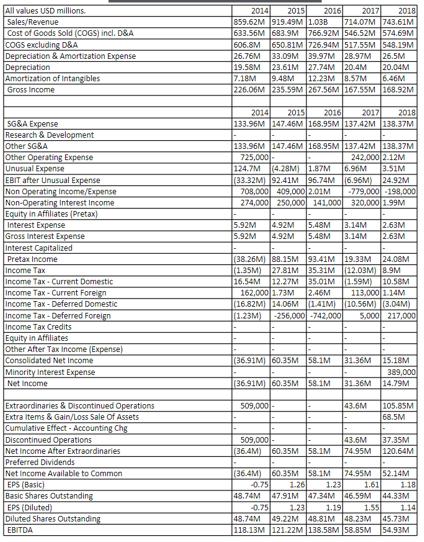
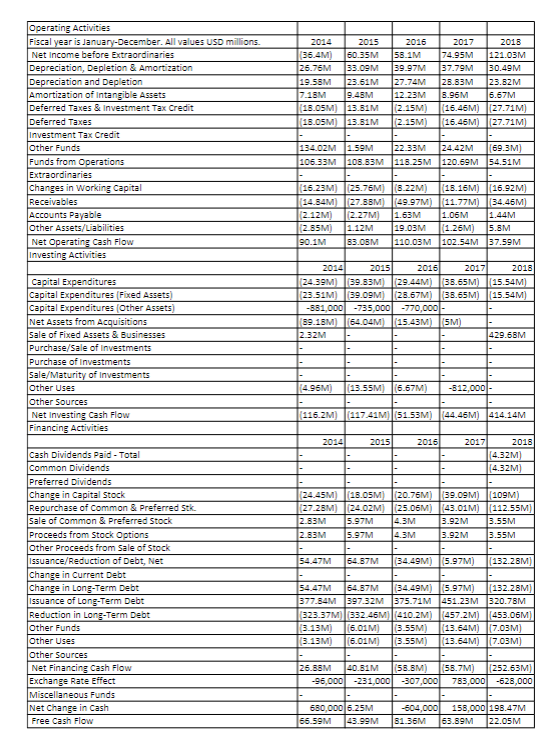
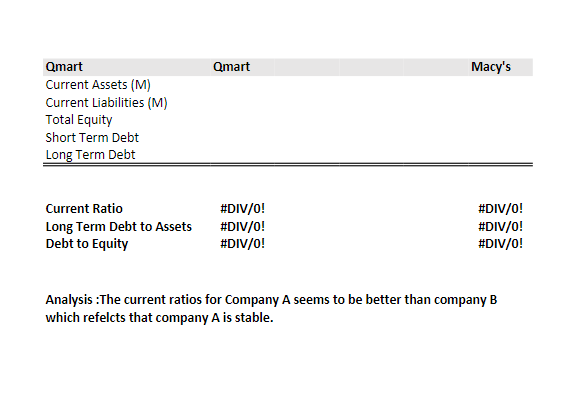
All values USD millions. Sales/Revenue Cost of Goods Sold (COGS) incl. D&A COGS excluding D&A Depreciation...
Fantastic news! We've Found the answer you've been seeking!
Question:

Transcribed Image Text:
All values USD millions. Sales/Revenue Cost of Goods Sold (COGS) incl. D&A COGS excluding D&A Depreciation & Amortization Expense Depreciation Amortization of Intangibles Gross Income SG&A Expense Research & Development Other SG&A Other Operating Expense Unusual Expense EBIT after Unusual Expense Non Operating Income/Expense Non-Operating Interest Income Equity in Affiliates (Pretax) Interest Expense Gross Interest Expense Interest Capitalized Pretax Income Income Tax Income Tax Current Domestic Income Tax Current Foreign Income Tax-Deferred Domestic Income Tax-Deferred Foreign Income Tax Credits Equity in Affiliates Other After Tax Income (Expense) Consolidated Net Income Minority Interest Expense Net Income Extraordinaries & Discontinued Operations Extra Items & Gain/Loss Sale Of Assets Cumulative Effect - Accounting Chg Discontinued Operations Net Income After Extraordinaries Preferred Dividends Net Income Available to Common EPS (Basic) Basic Shares Outstanding EPS (Diluted) Diluted Shares Outstanding EBITDA 2014 2015 2016 2017 2018 859.62M 919.49M 1.03B 714.07M 743.61M 633.56M 683.9M 766.92M 546.52M 574.69M 606.8M 650.81M 726.94M 517.55M 548.19M 26.76M 33.09M 39.97M 28.97M 26.5M 19.58M 23.61M 27.74M 20.4M 20.04M 7.18M 9.48M 12.23M 8.57M 6.46M 226.06M 235.59M 267.56M 167.55M 168.92M 2017 2018 2014 2015 2016 133.96M 147.46M 168.95M 137.42M 138.37M 133.96M 147.46M 168.95M 137.42M 138.37M 725,000- 124.7M (4.28M) 1.87M (33.32M) 92.41M 96.74M 708,000 409,000 2.01M 274,000 250,000 141,000 242,000 2.12M 6.96M 3.51M (6.96M) 24.92M -779,000-198,000 320,000 1.99M 5.92M 4.92M 5.48M 3.14M 2.63M 4.92M 5.48M 3.14M 2.63M 5.92M (1.35M) 27.81M 35.31M 16.54M 12.27M 35.01M (1.59M) 10.58M (38.26M) 88.15M 93.41M 19.33м 24.08M (12.03M) 8.9M 113,000 1.14M (10.56M) (3.04M) -256,000-742,000 5,000 217,000 162,000 1.73M 2.46M (16.82M) 14.06M (141M) [1.23M) (36.91M) 60.35M 58.1M 31.36M 15.18M 389,000 (36.91M) 60.35M 58.1M 31.36M 14.79M 509,000- F 43.6M 105.85M 68.5M 509,000- 43.6M 37.35M (36.4M) 60.35M 58.1M 74.95M 120.64M (36.4M) 60.35M 58.1M 74.95M 52.14M -0.75 1.26 1.23 1.61 48.74M 47.91M 47.34M 46.59M 44.33M -0.75 1.23 1.19 1.55 1.18 1.14 48.74M 49.22M 48.81M 48.23M 45.73M 54.93M 118.13M 121.22M 138.58M 58.85M Operating Activities Fiscal year is January-December. All values USD millions. Net Income before Extraordinaries Depreciation, Depletion & Amortization Depreciation and Depletion Amortization of Intangible Assets Deferred Taxes & Investment Tax Credit Deferred Taxes Investment Tax Credit Other Funds Funds from Operations Extraordinaries Changes in Working Capital Receivables Accounts Payable Other Assets/Liabilities Net Operating Cash Flow Investing Activities Capital Expenditures Capital Expenditures (Fixed Assets) Capital Expenditures (Other Assets) Net Assets from Acquisitions Sale of Fixed Assets & Businesses Purchase/Sale of Investments Purchase of Investments Sale/Maturity of Investments Other Uses Other Sources Net Investing Cash Flow Financing Activities 2014 (36.4M) 2015 60.35M 2016 58.1M 2018 2017 74.95M 121.03M 26.76M 33.09M 39.97M 37.79M 30.49M 19.58M 23.61M 27.74M 28.83M 23.82M 7.18M 9.48M 12.23M 8.96M (18.05M) 13.81M (2.15M) 6.67M (16.46M) (27.71M) (18.05M) 13.81M (2.15M) (16.45M) (27.71M) 24.42M (69.3M) 134.02M 1.59M 22.33M 106.33M 108.83M 118.25M 120.69M 54.51M (16.23M) (25.76M) (8.22M) (18.16M) (16.92M) (14.84M) (27.88M) (49.97M) (11.77M) (34.46M) (2.12M) (2.27M) 1.63M 1.06M 1.44M (2.85M) 1.12M 19.03M (1.26M) 5.8M 83.08M 110.03M 102.54M 37.59M 90.1M 2014 2015 2016 2017 2018 (24.39M) (39.83M) (29.44M) (38.65M) (15.54M) (23.51M) (39.09M) (28.67M) (38.65M) (15.54M) -881,000-735,000 -770,000- (89.18M) (64.04M) (15.43M) (5M) 2.32M 429.68M (4.96M) (13.55M) (6.67M) -812,000- (116.2M) (117.41M)|(51.53M) (44.46M) 414.14M Cash Dividends Paid - Total Common Dividends Preferred Dividends Change in Capital Stock Repurchase of Common & Preferred Stk. Sale of Common & Preferred Stock Proceeds from Stock Options Other Proceeds from Sale of Stock Issuance/Reduction of Debt, Net Change in Current Debt Change in Long-Term Debt Issuance of Long-Term Debt Reduction in Long-Term Debt Other Funds Other Uses Other Sources Net Financing Cash Flow Exchange Rate Effect Miscellaneous Funds Net Change in Cash Free Cash Flow 2014 2015 2016 2017 2018 (4.32M) (4.32M) (24.45M) (18.05M) (20.76M) (39.09M) (109M) (27.28M) (24.02M) (25.06M) (43.01M) (112.55M) 2.83M 2.83M 5.97M 5.97M 4.3M 4.3M 3.92M 3.92M 3.55M 3.55M 54.47M 64.87M (34.49M) (5.97M) (132.28M) 54.47M 64.87M |(34.49M) |(5.97M) 5778 397.32M 375.71M 451.23M (323.37M) (332.46M)|(410.2M) (457.2M) (453.06M) (3.13M) (6.01M) (3.55M) (3.13M) (6.01M) (3.55M) (132.28M) 320.78M (13.64M) (7.03M) (13.64M) (7.03M) 26.88M 40.81M -96,000 -231,000 (58.8M) (58.7M) (252.63M) -307,000 783,000 -628,000 680,000 6.25M -604,000 158,000 198.47M 66.59M 43.99M 81.36M 63.89M 22.05M Operating Activities Fiscal year is January-December. All values USD millions. Net Income before Extraordinaries Depreciation, Depletion & Amortization Depreciation and Depletion Amortization of Intangible Assets Deferred Taxes & Investment Tax Credit Deferred Taxes Investment Tax Credit Other Funds Funds from Operations Extraordinaries Changes in Working Capital Receivables Accounts Payable Other Assets/Liabilities Net Operating Cash Flow Investing Activities Capital Expenditures Capital Expenditures (Fixed Assets) Capital Expenditures (Other Assets) Net Assets from Acquisitions Sale of Fixed Assets & Businesses Purchase/Sale of Investments Purchase of Investments Sale/Maturity of Investments Other Uses Other Sources Net Investing Cash Flow Financing Activities 2014 (36.4M) 2015 60.35M 2016 58.1M 2018 2017 74.95M 121.03M 26.76M 33.09M 39.97M 37.79M 30.49M 19.58M 23.61M 27.74M 28.83M 23.82M 7.18M 9.48M 12.23M 8.96M (18.05M) 13.81M (2.15M) 6.67M (16.46M) (27.71M) (18.05M) 13.81M (2.15M) (16.45M) (27.71M) 24.42M (69.3M) 134.02M 1.59M 22.33M 106.33M 108.83M 118.25M 120.69M 54.51M (16.23M) (25.76M) (8.22M) (18.16M) (16.92M) (14.84M) (27.88M) (49.97M) (11.77M) (34.46M) (2.12M) (2.27M) 1.63M 1.06M 1.44M (2.85M) 1.12M 19.03M (1.26M) 5.8M 83.08M 110.03M 102.54M 37.59M 90.1M 2014 2015 2016 2017 2018 (24.39M) (39.83M) (29.44M) (38.65M) (15.54M) (23.51M) (39.09M) (28.67M) (38.65M) (15.54M) -881,000-735,000 -770,000- (89.18M) (64.04M) (15.43M) (5M) 2.32M 429.68M (4.96M) (13.55M) (6.67M) -812,000- (116.2M) (117.41M)|(51.53M) (44.46M) 414.14M Cash Dividends Paid - Total Common Dividends Preferred Dividends Change in Capital Stock Repurchase of Common & Preferred Stk. Sale of Common & Preferred Stock Proceeds from Stock Options Other Proceeds from Sale of Stock Issuance/Reduction of Debt, Net Change in Current Debt Change in Long-Term Debt Issuance of Long-Term Debt Reduction in Long-Term Debt Other Funds Other Uses Other Sources Net Financing Cash Flow Exchange Rate Effect Miscellaneous Funds Net Change in Cash Free Cash Flow 2014 2015 2016 2017 2018 (4.32M) (4.32M) (24.45M) (18.05M) (20.76M) (39.09M) (109M) (27.28M) (24.02M) (25.06M) (43.01M) (112.55M) 2.83M 2.83M 5.97M 5.97M 4.3M 4.3M 3.92M 3.92M 3.55M 3.55M 54.47M 64.87M (34.49M) (5.97M) (132.28M) 54.47M 64.87M |(34.49M) |(5.97M) 5778 397.32M 375.71M 451.23M (323.37M) (332.46M)|(410.2M) (457.2M) (453.06M) (3.13M) (6.01M) (3.55M) (3.13M) (6.01M) (3.55M) (132.28M) 320.78M (13.64M) (7.03M) (13.64M) (7.03M) 26.88M 40.81M -96,000 -231,000 (58.8M) (58.7M) (252.63M) -307,000 783,000 -628,000 680,000 6.25M -604,000 158,000 198.47M 66.59M 43.99M 81.36M 63.89M 22.05M Qmart Current Assets (M) Current Liabilities (M) Total Equity Short Term Debt Long Term Debt Qmart Macy's Current Ratio #DIV/0! Long Term Debt to Assets #DIV/0! Debt to Equity #DIV/0! #DIV/0! #DIV/0! #DIV/0! Analysis:The current ratios for Company A seems to be better than company B which refelcts that company A is stable. All values USD millions. Sales/Revenue Cost of Goods Sold (COGS) incl. D&A COGS excluding D&A Depreciation & Amortization Expense Depreciation Amortization of Intangibles Gross Income SG&A Expense Research & Development Other SG&A Other Operating Expense Unusual Expense EBIT after Unusual Expense Non Operating Income/Expense Non-Operating Interest Income Equity in Affiliates (Pretax) Interest Expense Gross Interest Expense Interest Capitalized Pretax Income Income Tax Income Tax Current Domestic Income Tax Current Foreign Income Tax-Deferred Domestic Income Tax-Deferred Foreign Income Tax Credits Equity in Affiliates Other After Tax Income (Expense) Consolidated Net Income Minority Interest Expense Net Income Extraordinaries & Discontinued Operations Extra Items & Gain/Loss Sale Of Assets Cumulative Effect - Accounting Chg Discontinued Operations Net Income After Extraordinaries Preferred Dividends Net Income Available to Common EPS (Basic) Basic Shares Outstanding EPS (Diluted) Diluted Shares Outstanding EBITDA 2014 2015 2016 2017 2018 859.62M 919.49M 1.03B 714.07M 743.61M 633.56M 683.9M 766.92M 546.52M 574.69M 606.8M 650.81M 726.94M 517.55M 548.19M 26.76M 33.09M 39.97M 28.97M 26.5M 19.58M 23.61M 27.74M 20.4M 20.04M 7.18M 9.48M 12.23M 8.57M 6.46M 226.06M 235.59M 267.56M 167.55M 168.92M 2017 2018 2014 2015 2016 133.96M 147.46M 168.95M 137.42M 138.37M 133.96M 147.46M 168.95M 137.42M 138.37M 725,000- 124.7M (4.28M) 1.87M (33.32M) 92.41M 96.74M 708,000 409,000 2.01M 274,000 250,000 141,000 242,000 2.12M 6.96M 3.51M (6.96M) 24.92M -779,000-198,000 320,000 1.99M 5.92M 4.92M 5.48M 3.14M 2.63M 4.92M 5.48M 3.14M 2.63M 5.92M (1.35M) 27.81M 35.31M 16.54M 12.27M 35.01M (1.59M) 10.58M (38.26M) 88.15M 93.41M 19.33м 24.08M (12.03M) 8.9M 113,000 1.14M (10.56M) (3.04M) -256,000-742,000 5,000 217,000 162,000 1.73M 2.46M (16.82M) 14.06M (141M) [1.23M) (36.91M) 60.35M 58.1M 31.36M 15.18M 389,000 (36.91M) 60.35M 58.1M 31.36M 14.79M 509,000- F 43.6M 105.85M 68.5M 509,000- 43.6M 37.35M (36.4M) 60.35M 58.1M 74.95M 120.64M (36.4M) 60.35M 58.1M 74.95M 52.14M -0.75 1.26 1.23 1.61 48.74M 47.91M 47.34M 46.59M 44.33M -0.75 1.23 1.19 1.55 1.18 1.14 48.74M 49.22M 48.81M 48.23M 45.73M 54.93M 118.13M 121.22M 138.58M 58.85M Operating Activities Fiscal year is January-December. All values USD millions. Net Income before Extraordinaries Depreciation, Depletion & Amortization Depreciation and Depletion Amortization of Intangible Assets Deferred Taxes & Investment Tax Credit Deferred Taxes Investment Tax Credit Other Funds Funds from Operations Extraordinaries Changes in Working Capital Receivables Accounts Payable Other Assets/Liabilities Net Operating Cash Flow Investing Activities Capital Expenditures Capital Expenditures (Fixed Assets) Capital Expenditures (Other Assets) Net Assets from Acquisitions Sale of Fixed Assets & Businesses Purchase/Sale of Investments Purchase of Investments Sale/Maturity of Investments Other Uses Other Sources Net Investing Cash Flow Financing Activities 2014 (36.4M) 2015 60.35M 2016 58.1M 2018 2017 74.95M 121.03M 26.76M 33.09M 39.97M 37.79M 30.49M 19.58M 23.61M 27.74M 28.83M 23.82M 7.18M 9.48M 12.23M 8.96M (18.05M) 13.81M (2.15M) 6.67M (16.46M) (27.71M) (18.05M) 13.81M (2.15M) (16.45M) (27.71M) 24.42M (69.3M) 134.02M 1.59M 22.33M 106.33M 108.83M 118.25M 120.69M 54.51M (16.23M) (25.76M) (8.22M) (18.16M) (16.92M) (14.84M) (27.88M) (49.97M) (11.77M) (34.46M) (2.12M) (2.27M) 1.63M 1.06M 1.44M (2.85M) 1.12M 19.03M (1.26M) 5.8M 83.08M 110.03M 102.54M 37.59M 90.1M 2014 2015 2016 2017 2018 (24.39M) (39.83M) (29.44M) (38.65M) (15.54M) (23.51M) (39.09M) (28.67M) (38.65M) (15.54M) -881,000-735,000 -770,000- (89.18M) (64.04M) (15.43M) (5M) 2.32M 429.68M (4.96M) (13.55M) (6.67M) -812,000- (116.2M) (117.41M)|(51.53M) (44.46M) 414.14M Cash Dividends Paid - Total Common Dividends Preferred Dividends Change in Capital Stock Repurchase of Common & Preferred Stk. Sale of Common & Preferred Stock Proceeds from Stock Options Other Proceeds from Sale of Stock Issuance/Reduction of Debt, Net Change in Current Debt Change in Long-Term Debt Issuance of Long-Term Debt Reduction in Long-Term Debt Other Funds Other Uses Other Sources Net Financing Cash Flow Exchange Rate Effect Miscellaneous Funds Net Change in Cash Free Cash Flow 2014 2015 2016 2017 2018 (4.32M) (4.32M) (24.45M) (18.05M) (20.76M) (39.09M) (109M) (27.28M) (24.02M) (25.06M) (43.01M) (112.55M) 2.83M 2.83M 5.97M 5.97M 4.3M 4.3M 3.92M 3.92M 3.55M 3.55M 54.47M 64.87M (34.49M) (5.97M) (132.28M) 54.47M 64.87M |(34.49M) |(5.97M) 5778 397.32M 375.71M 451.23M (323.37M) (332.46M)|(410.2M) (457.2M) (453.06M) (3.13M) (6.01M) (3.55M) (3.13M) (6.01M) (3.55M) (132.28M) 320.78M (13.64M) (7.03M) (13.64M) (7.03M) 26.88M 40.81M -96,000 -231,000 (58.8M) (58.7M) (252.63M) -307,000 783,000 -628,000 680,000 6.25M -604,000 158,000 198.47M 66.59M 43.99M 81.36M 63.89M 22.05M Operating Activities Fiscal year is January-December. All values USD millions. Net Income before Extraordinaries Depreciation, Depletion & Amortization Depreciation and Depletion Amortization of Intangible Assets Deferred Taxes & Investment Tax Credit Deferred Taxes Investment Tax Credit Other Funds Funds from Operations Extraordinaries Changes in Working Capital Receivables Accounts Payable Other Assets/Liabilities Net Operating Cash Flow Investing Activities Capital Expenditures Capital Expenditures (Fixed Assets) Capital Expenditures (Other Assets) Net Assets from Acquisitions Sale of Fixed Assets & Businesses Purchase/Sale of Investments Purchase of Investments Sale/Maturity of Investments Other Uses Other Sources Net Investing Cash Flow Financing Activities 2014 (36.4M) 2015 60.35M 2016 58.1M 2018 2017 74.95M 121.03M 26.76M 33.09M 39.97M 37.79M 30.49M 19.58M 23.61M 27.74M 28.83M 23.82M 7.18M 9.48M 12.23M 8.96M (18.05M) 13.81M (2.15M) 6.67M (16.46M) (27.71M) (18.05M) 13.81M (2.15M) (16.45M) (27.71M) 24.42M (69.3M) 134.02M 1.59M 22.33M 106.33M 108.83M 118.25M 120.69M 54.51M (16.23M) (25.76M) (8.22M) (18.16M) (16.92M) (14.84M) (27.88M) (49.97M) (11.77M) (34.46M) (2.12M) (2.27M) 1.63M 1.06M 1.44M (2.85M) 1.12M 19.03M (1.26M) 5.8M 83.08M 110.03M 102.54M 37.59M 90.1M 2014 2015 2016 2017 2018 (24.39M) (39.83M) (29.44M) (38.65M) (15.54M) (23.51M) (39.09M) (28.67M) (38.65M) (15.54M) -881,000-735,000 -770,000- (89.18M) (64.04M) (15.43M) (5M) 2.32M 429.68M (4.96M) (13.55M) (6.67M) -812,000- (116.2M) (117.41M)|(51.53M) (44.46M) 414.14M Cash Dividends Paid - Total Common Dividends Preferred Dividends Change in Capital Stock Repurchase of Common & Preferred Stk. Sale of Common & Preferred Stock Proceeds from Stock Options Other Proceeds from Sale of Stock Issuance/Reduction of Debt, Net Change in Current Debt Change in Long-Term Debt Issuance of Long-Term Debt Reduction in Long-Term Debt Other Funds Other Uses Other Sources Net Financing Cash Flow Exchange Rate Effect Miscellaneous Funds Net Change in Cash Free Cash Flow 2014 2015 2016 2017 2018 (4.32M) (4.32M) (24.45M) (18.05M) (20.76M) (39.09M) (109M) (27.28M) (24.02M) (25.06M) (43.01M) (112.55M) 2.83M 2.83M 5.97M 5.97M 4.3M 4.3M 3.92M 3.92M 3.55M 3.55M 54.47M 64.87M (34.49M) (5.97M) (132.28M) 54.47M 64.87M |(34.49M) |(5.97M) 5778 397.32M 375.71M 451.23M (323.37M) (332.46M)|(410.2M) (457.2M) (453.06M) (3.13M) (6.01M) (3.55M) (3.13M) (6.01M) (3.55M) (132.28M) 320.78M (13.64M) (7.03M) (13.64M) (7.03M) 26.88M 40.81M -96,000 -231,000 (58.8M) (58.7M) (252.63M) -307,000 783,000 -628,000 680,000 6.25M -604,000 158,000 198.47M 66.59M 43.99M 81.36M 63.89M 22.05M Qmart Current Assets (M) Current Liabilities (M) Total Equity Short Term Debt Long Term Debt Qmart Macy's Current Ratio #DIV/0! Long Term Debt to Assets #DIV/0! Debt to Equity #DIV/0! #DIV/0! #DIV/0! #DIV/0! Analysis:The current ratios for Company A seems to be better than company B which refelcts that company A is stable.
Expert Answer:
Answer rating: 100% (QA)
This data provides a detailed breakdown of the companys cash flow for five fiscal years 20142018Heres an analysis of the key aspects Operating Activities Net Income The company experienced fluctuation... View the full answer

Related Book For 

Posted Date:
Students also viewed these accounting questions
-
Consider the linear space such that the limits Consider y = (4) and a 30-0 lim 3-8 moreover the subspace to of the lim 8418 basis of the space 2/20 such that b = of double sequences xn and b2 = lim...
-
SAE 10 oil at 20C flows in a vertical pipe of diameter 2.5 cm. It is found that the pressure is constant throughout the fluid. What is the oil flow rate in m3/h? Is the flow up or down?
-
Is an extreme observation necessarily an outlier? Explain your answer.
-
The functions f and g are defined for x R by f: x 4x 1 g: x 2x + k. Find the value of k for which fg = gf.
-
Refer to the information in Exercise 16-14. Prepare journal entries dated June 30 to record: (a) raw materials purchases, (b) direct materials usage, (c) indirect materials usage, (d) direct labor...
-
Kelly Pitney began her consulting business, Kelly Consulting, P.C., on April 1, 2014. The accounting cycle for Kelly Consulting for April, including financial statements, was illustrated on pages...
-
My elevator pitch for the purchase of an MRI machine is as follows: Hi there, my name is Kayla and I am one of the administrators here at Highlands Regional. Did you know that our MRI machine was...
-
Consider an individual whose preferences are defined over bundles of non-negative amounts of each of two commodities. Suppose that this individual's preferences can be represented by a utility...
-
Our clients do not want to incur a huge tax liability from this sale. Instead, they hope to structure a tax-deferred sale to avoid a large "tax hit." With that in mind, determine the tax consequences...
-
Consider the following borrowing costs faced by the following 3 companies: Company A Fixed rate 7.0% Floating rate LIBOR + 0.1% Company B Fixed rate 6.5% Floating rate LIBOR - 0.1% Company C Fixed...
-
Which report would you run to check which invoices have not been scheduled or paid?
-
Consider a simple gambling game. Each time you bet $10. If you lose (with probability 1 - p), you lose the $10 you bet; if you win(with probability p), you get back your $10 and win extra $10...
-
Which report lists a transaction by transaction detail of all data entry referencing a specific allocation?
-
Write a program to find the largest hexadecimal number from the data stored at a memory location. The numbers are: 69,87,96,45, and 75. Attache the code and the result screen from the DOSBOX.
-
Find the area bounded by the given curves. The loop of... 2 18y? = x(6 x)?
-
The following information is for Montreal Gloves Inc. for the year 2020: Manufacturing costs Number of gloves manufactured Beginning inventory $ 3,016,700 311,000 pairs 0 pairs Sales in 2020 were...
-
Chicago Turkey is considering a new turkey farm to service its western region stores. The stores currently require 650,000 turkeys per year, and they are purchased from various local turkey farms for...
-
Bobs Rawhide Company has a dividend payout ratio of 45%. Next year it will earn $0.75 per share and have a return on equity of 12%. The shareholders required return is 8%. a. Calculate the companys...
-
TRM Consulting Services currently has the following capital structure: New debt would mature on June 30, 2051, have a coupon rate of 7%, and would be sold for their par value of $1,000. The bonds pay...
-
Which of the following is a discrete probability distribution? Approach In a discrete probability distribution, the sum of the probabilities must equal 1, and all probabilities must be between 0 and...
-
Graph the discrete probability distribution given in Table 1 from Example 2. Approach In the graph of a discrete probability distribution, the horizontal axis represents the values of the discrete...
-
Compute the mean of the discrete random variable given in Table 1 from Example 2. Approach Find the mean of a discrete random variable by multiplying each value of the random variable by its...

Study smarter with the SolutionInn App