

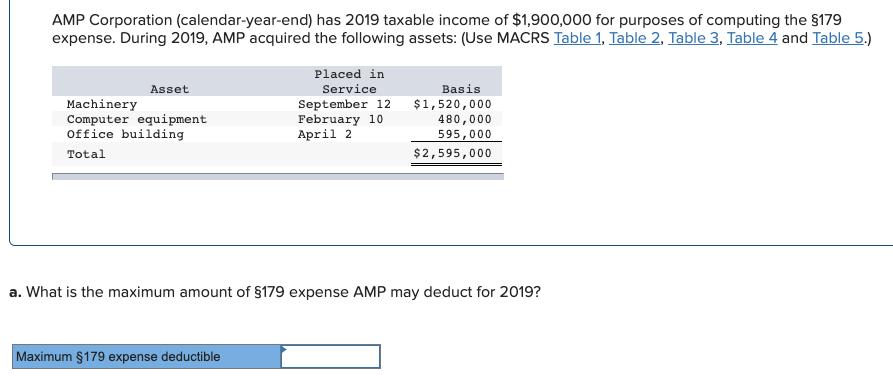
AMP Corporation (calendar-year-end) has 2019 taxable income of $1,900,000 for purposes of computing the $179 expense....
Fantastic news! We've Found the answer you've been seeking!
Question:
Transcribed Image Text:
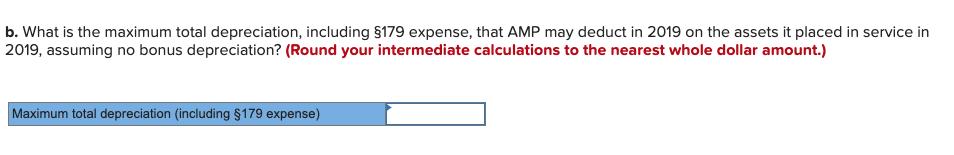
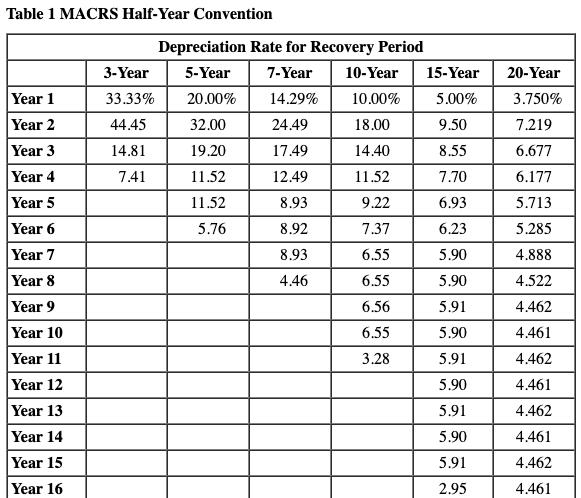
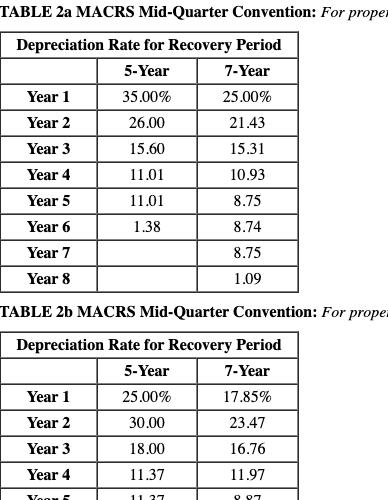
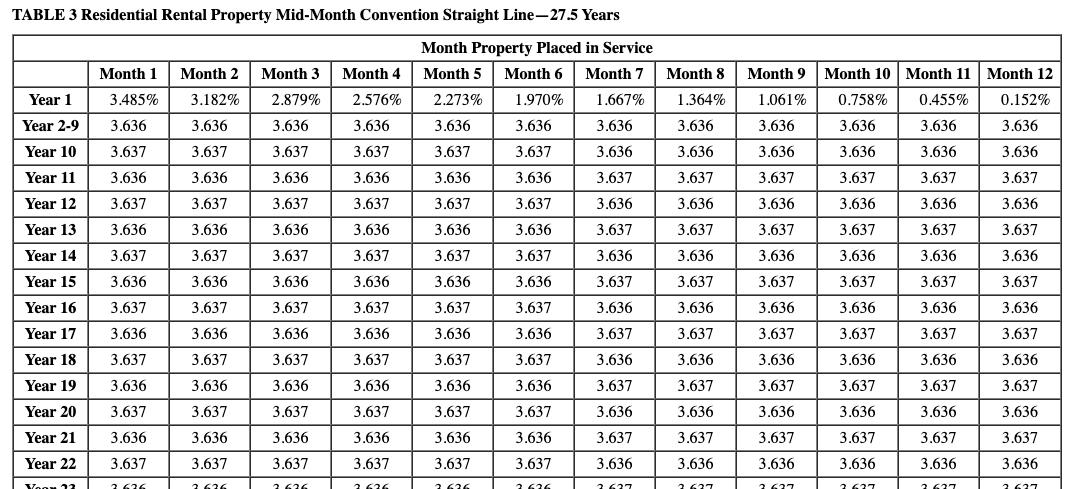
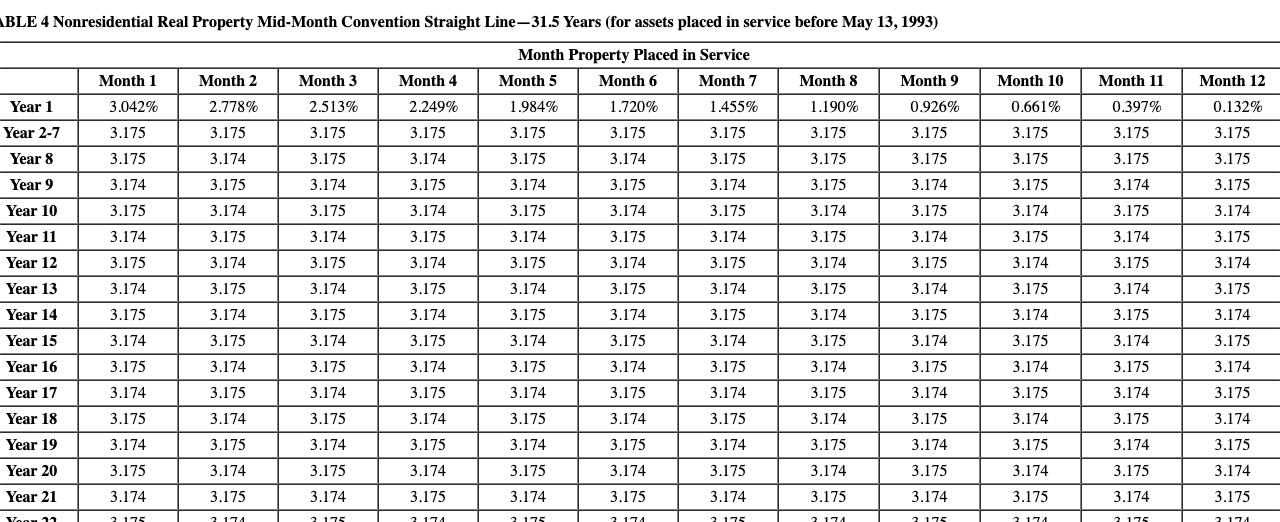
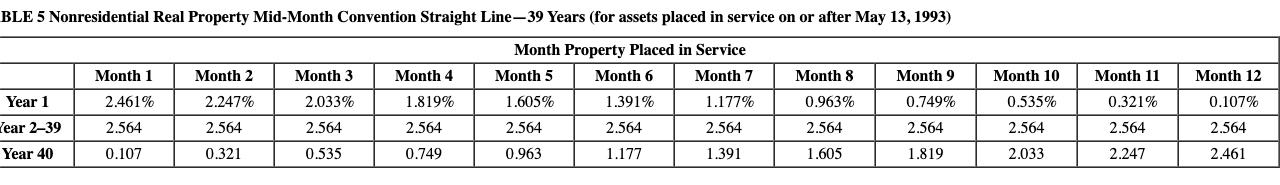
AMP Corporation (calendar-year-end) has 2019 taxable income of $1,900,000 for purposes of computing the $179 expense. During 2019, AMP acquired the following assets: (Use MACRS Table 1, Table 2, Table 3, Table 4 and Table 5.) Placed in Asset Service Basis Machinery Computer equipment Office building September 12 February 10 April 2 $1,520,000 480,000 595,000 Total $2,595,000 a. What is the maximum amount of $179 expense AMP may deduct for 2019? Maximum $179 expense deductible b. What is the maximum total depreciation, including $179 expense, that AMP may deduct in 2019 on the assets it placed in service in 2019, assuming no bonus depreciation? (Round your intermediate calculations to the nearest whole dollar amount.) Maximum total depreciation (including $179 expense) Table 1 MACRS Half-Year Convention Depreciation Rate for Recovery Period 3-Year 5-Year 7-Year 10-Year 15-Year 20-Year Year 1 Year 2 33.33% 20.00% 14.29% 10.00% 5.00% 3.750% 44.45 32.00 24.49 18.00 9.50 7.219 Year 3 14.81 19.20 17.49 14.40 8.55 6.677 Year 4 7.41 11.52 12.49 11.52 7.70 6.177 Year 5 11.52 8.93 9.22 6.93 5.713 Year 6 Year 7 Year 8 5.76 8.92 7.37 6.23 5.285 8.93 6.55 5.90 4.888 4.46 6.55 5.90 4.522 Year 9 6.56 5.91 4.462 Year 10 Year 11 Year 12 6.55 5.90 4.461 3.28 5.91 4.462 5.90 4.461 Year 13 5.91 4.462 Year 14 5.90 4.461 Year 15 5.91 4.462 Year 16 2.95 4.461 TABLE 2a MACRS Mid-Quarter Convention: For proper Depreciation Rate for Recovery Period 5-Year 7-Year Year 1 35.00% 25.00% Year 2 26.00 21.43 Year 3 15.60 15.31 Year 4 11.01 10.93 Year 5 11.01 8.75 Year 6 1.38 8.74 Year 7 8.75 Year 8 1.09 TABLE 2b MACRS Mid-Quarter Convention: For prope Depreciation Rate for Recovery Period 5-Year 7-Year Year 1 25.00% 17.85% Year 2 30.00 23.47 Year 3 18.00 16.76 Year 4 11.37 11.97 Voom 11. 27 O 07 TABLE 3 Residential Rental Property Mid-Month Convention Straight Line-27.5 Years Month Property Placed in Service Month 1 Month 2 Month 3 Month 4 Month 5 Month 6 Month 7 Month 8 Month 9 Month 10 Month 11 Month 12 Year 1 3.485% 3.182% 2.879% 2.576% 2.273% 1.970% 1.667% 1.364% 1.061% 0.758% 0.455% 0.152% Year 2-9 3.636 3.636 3.636 3.636 3.636 3.636 3.636 3.636 3.636 3.636 3.636 3.636 Year 10 3.637 3.637 3.637 3.637 3.637 3.637 3.636 3.636 3.636 3.636 3.636 3.636 Year 11 3.636 3.636 3.636 3.636 3.636 3.636 3.637 3.637 3.637 3.637 3.637 3.637 Year 12 3.637 3.637 3.637 3.637 3.637 3.637 3.636 3.636 3.636 3.636 3.636 3.636 Year 13 3.636 3.636 3.636 3.636 3.636 3.636 3.637 3.637 3.637 3.637 3.637 3.637 Year 14 3.637 3.637 3.637 3.637 3.637 3.637 3.636 3.636 3.636 3.636 3.636 3.636 Year 15 3.636 3.636 3.636 3.636 3.636 3.636 3.637 3.637 3.637 3.637 3.637 3.637 Year 16 3.637 3.637 3.637 3.637 3.637 3.637 3.636 3.636 3.636 3.636 3.636 3.636 Year 17 3.636 3.636 3.636 3.636 3.636 3.636 3.637 3.637 3.637 3.637 3.637 3.637 Year 18 3.637 3.637 3.637 3.637 3.637 3.637 3.636 3.636 3.636 3.636 3.636 3.636 Year 19 3.636 3.636 3.636 3.636 3.636 3,636 3.637 3.637 3.637 3.637 3.637 3.637 Year 20 3.637 3.637 3.637 3.637 3.637 3.637 3.636 3.636 3.636 3.636 3.636 3.636 Year 21 3.636 3.636 3.636 3.636 3.636 3.636 3.637 3.637 3.637 3.637 3.637 3.637 Year 22 3.637 3.637 3.637 3.637 3.637 3.637 3.636 3.636 3.636 3.636 3.636 3.636 Yoon 13 3 636 1 636 3 636 3 636 3 636 1 636 3 627 1 67 3 627 3 637 3 637 3637 ABLE 4 Nonresidential Real Property Mid-Month Convention Straight Line-31.5 Years (for assets placed in service before May 13, 1993) Month Property Placed in Service Month 1 Month 2 Month 3 Month 4 Month 5 Month 6 Month 7 Month 8 Month 9 Month 10 Month 11 Month 12 Year 1 3.042% 2.778% 2.513% 2.249% 1.984% 1.720% 1.455% 1.190% 0.926% 0.661% 0.397% 0.132% Year 2-7 3.175 3.175 3.175 3.175 3.175 3.175 3.175 3.175 3.175 3.175 3.175 3.175 Year 8 3.175 3.174 3.175 3.174 3.175 3.174 3.175 3.175 3.175 3.175 3.175 3.175 Year 9 3.174 3.175 3.174 3.175 3.174 3.175 3,174 3.175 3.174 3.175 3.174 3.175 Year 10 3.175 3.174 3.175 3.174 3.175 3.174 3.175 3.174 3.175 3.174 3.175 3.174 Year 11 3.174 3.175 3.174 3.175 3.174 3.175 3.174 3.175 3.174 3.175 3.174 3.175 Year 12 3.175 3.174 3.175 3.174 3.175 3.174 3.175 3.174 3.175 3.174 3.175 3.174 Year 13 3.174 3.175 3.174 3.175 3.174 3.175 3.174 3.175 3.174 3.175 3.174 3.175 Year 14 3.175 3.174 3.175 3.174 3.175 3.174 3.175 3.174 3.175 3.174 3.175 3.174 Year 15 3.174 3.175 3.174 3.175 3.174 3.175 3.174 3.175 3.174 3.175 3.174 3.175 Year 16 3.175 3.174 3.175 3.174 3.175 3.174 3.175 3.174 3.175 3.174 3.175 3.174 Year 17 3.174 3.175 3.174 3.175 3.174 3,175 3.174 3.175 3.174 3.175 3.174 3.175 Year 18 3.175 3.174 3.175 3.174 3.175 3.174 3.175 3.174 3.175 3.174 3.175 3.174 Year 19 3.174 3.175 3.174 3.175 3.174 3.175 3.174 3.175 3.174 3.175 3.174 3.175 Year 20 3.175 3.174 3.175 3.174 3.175 3.174 3.175 3.174 3.175 3.174 3.175 3.174 Year 21 3.174 3.175 3.174 3.175 3.174 3.175 3.174 3.175 3.174 3.175 3.174 3.175 Yoou 11 2 175 2 174 1 175 1 174 3 174 1 175 3 174 7 175 2 174 2 175 2 174 2175 BLE 5 Nonresidential Real Property Mid-Month Convention Straight Line-39 Years (for assets placed in service on or after May 13, 1993) Month Property Placed in Service Month 1 Month 2 Month 3 Month 4 Month 5 Month 6 Month 7 Month 8 Month 9 Month 10 Month 11 Month 12 Year 1 2.461% 2.247% 2.033% 1.819% 1.605% 1.391% 1.177% 0.963% 0.749% 0,535% 0.321% 0.107% Tear 2-39 2.564 2.564 2.564 2.564 2.564 2.564 2.564 2.564 2.564 2.564 2.564 2.564 Year 40 0.107 0.321 0.535 0.749 0.963 1.177 1.391 1.605 1.819 2.033 2.247 2.461 AMP Corporation (calendar-year-end) has 2019 taxable income of $1,900,000 for purposes of computing the $179 expense. During 2019, AMP acquired the following assets: (Use MACRS Table 1, Table 2, Table 3, Table 4 and Table 5.) Placed in Asset Service Basis Machinery Computer equipment Office building September 12 February 10 April 2 $1,520,000 480,000 595,000 Total $2,595,000 a. What is the maximum amount of $179 expense AMP may deduct for 2019? Maximum $179 expense deductible b. What is the maximum total depreciation, including $179 expense, that AMP may deduct in 2019 on the assets it placed in service in 2019, assuming no bonus depreciation? (Round your intermediate calculations to the nearest whole dollar amount.) Maximum total depreciation (including $179 expense) Table 1 MACRS Half-Year Convention Depreciation Rate for Recovery Period 3-Year 5-Year 7-Year 10-Year 15-Year 20-Year Year 1 Year 2 33.33% 20.00% 14.29% 10.00% 5.00% 3.750% 44.45 32.00 24.49 18.00 9.50 7.219 Year 3 14.81 19.20 17.49 14.40 8.55 6.677 Year 4 7.41 11.52 12.49 11.52 7.70 6.177 Year 5 11.52 8.93 9.22 6.93 5.713 Year 6 Year 7 Year 8 5.76 8.92 7.37 6.23 5.285 8.93 6.55 5.90 4.888 4.46 6.55 5.90 4.522 Year 9 6.56 5.91 4.462 Year 10 Year 11 Year 12 6.55 5.90 4.461 3.28 5.91 4.462 5.90 4.461 Year 13 5.91 4.462 Year 14 5.90 4.461 Year 15 5.91 4.462 Year 16 2.95 4.461 TABLE 2a MACRS Mid-Quarter Convention: For proper Depreciation Rate for Recovery Period 5-Year 7-Year Year 1 35.00% 25.00% Year 2 26.00 21.43 Year 3 15.60 15.31 Year 4 11.01 10.93 Year 5 11.01 8.75 Year 6 1.38 8.74 Year 7 8.75 Year 8 1.09 TABLE 2b MACRS Mid-Quarter Convention: For prope Depreciation Rate for Recovery Period 5-Year 7-Year Year 1 25.00% 17.85% Year 2 30.00 23.47 Year 3 18.00 16.76 Year 4 11.37 11.97 Voom 11. 27 O 07 TABLE 3 Residential Rental Property Mid-Month Convention Straight Line-27.5 Years Month Property Placed in Service Month 1 Month 2 Month 3 Month 4 Month 5 Month 6 Month 7 Month 8 Month 9 Month 10 Month 11 Month 12 Year 1 3.485% 3.182% 2.879% 2.576% 2.273% 1.970% 1.667% 1.364% 1.061% 0.758% 0.455% 0.152% Year 2-9 3.636 3.636 3.636 3.636 3.636 3.636 3.636 3.636 3.636 3.636 3.636 3.636 Year 10 3.637 3.637 3.637 3.637 3.637 3.637 3.636 3.636 3.636 3.636 3.636 3.636 Year 11 3.636 3.636 3.636 3.636 3.636 3.636 3.637 3.637 3.637 3.637 3.637 3.637 Year 12 3.637 3.637 3.637 3.637 3.637 3.637 3.636 3.636 3.636 3.636 3.636 3.636 Year 13 3.636 3.636 3.636 3.636 3.636 3.636 3.637 3.637 3.637 3.637 3.637 3.637 Year 14 3.637 3.637 3.637 3.637 3.637 3.637 3.636 3.636 3.636 3.636 3.636 3.636 Year 15 3.636 3.636 3.636 3.636 3.636 3.636 3.637 3.637 3.637 3.637 3.637 3.637 Year 16 3.637 3.637 3.637 3.637 3.637 3.637 3.636 3.636 3.636 3.636 3.636 3.636 Year 17 3.636 3.636 3.636 3.636 3.636 3.636 3.637 3.637 3.637 3.637 3.637 3.637 Year 18 3.637 3.637 3.637 3.637 3.637 3.637 3.636 3.636 3.636 3.636 3.636 3.636 Year 19 3.636 3.636 3.636 3.636 3.636 3,636 3.637 3.637 3.637 3.637 3.637 3.637 Year 20 3.637 3.637 3.637 3.637 3.637 3.637 3.636 3.636 3.636 3.636 3.636 3.636 Year 21 3.636 3.636 3.636 3.636 3.636 3.636 3.637 3.637 3.637 3.637 3.637 3.637 Year 22 3.637 3.637 3.637 3.637 3.637 3.637 3.636 3.636 3.636 3.636 3.636 3.636 Yoon 13 3 636 1 636 3 636 3 636 3 636 1 636 3 627 1 67 3 627 3 637 3 637 3637 ABLE 4 Nonresidential Real Property Mid-Month Convention Straight Line-31.5 Years (for assets placed in service before May 13, 1993) Month Property Placed in Service Month 1 Month 2 Month 3 Month 4 Month 5 Month 6 Month 7 Month 8 Month 9 Month 10 Month 11 Month 12 Year 1 3.042% 2.778% 2.513% 2.249% 1.984% 1.720% 1.455% 1.190% 0.926% 0.661% 0.397% 0.132% Year 2-7 3.175 3.175 3.175 3.175 3.175 3.175 3.175 3.175 3.175 3.175 3.175 3.175 Year 8 3.175 3.174 3.175 3.174 3.175 3.174 3.175 3.175 3.175 3.175 3.175 3.175 Year 9 3.174 3.175 3.174 3.175 3.174 3.175 3,174 3.175 3.174 3.175 3.174 3.175 Year 10 3.175 3.174 3.175 3.174 3.175 3.174 3.175 3.174 3.175 3.174 3.175 3.174 Year 11 3.174 3.175 3.174 3.175 3.174 3.175 3.174 3.175 3.174 3.175 3.174 3.175 Year 12 3.175 3.174 3.175 3.174 3.175 3.174 3.175 3.174 3.175 3.174 3.175 3.174 Year 13 3.174 3.175 3.174 3.175 3.174 3.175 3.174 3.175 3.174 3.175 3.174 3.175 Year 14 3.175 3.174 3.175 3.174 3.175 3.174 3.175 3.174 3.175 3.174 3.175 3.174 Year 15 3.174 3.175 3.174 3.175 3.174 3.175 3.174 3.175 3.174 3.175 3.174 3.175 Year 16 3.175 3.174 3.175 3.174 3.175 3.174 3.175 3.174 3.175 3.174 3.175 3.174 Year 17 3.174 3.175 3.174 3.175 3.174 3,175 3.174 3.175 3.174 3.175 3.174 3.175 Year 18 3.175 3.174 3.175 3.174 3.175 3.174 3.175 3.174 3.175 3.174 3.175 3.174 Year 19 3.174 3.175 3.174 3.175 3.174 3.175 3.174 3.175 3.174 3.175 3.174 3.175 Year 20 3.175 3.174 3.175 3.174 3.175 3.174 3.175 3.174 3.175 3.174 3.175 3.174 Year 21 3.174 3.175 3.174 3.175 3.174 3.175 3.174 3.175 3.174 3.175 3.174 3.175 Yoou 11 2 175 2 174 1 175 1 174 3 174 1 175 3 174 7 175 2 174 2 175 2 174 2175 BLE 5 Nonresidential Real Property Mid-Month Convention Straight Line-39 Years (for assets placed in service on or after May 13, 1993) Month Property Placed in Service Month 1 Month 2 Month 3 Month 4 Month 5 Month 6 Month 7 Month 8 Month 9 Month 10 Month 11 Month 12 Year 1 2.461% 2.247% 2.033% 1.819% 1.605% 1.391% 1.177% 0.963% 0.749% 0,535% 0.321% 0.107% Tear 2-39 2.564 2.564 2.564 2.564 2.564 2.564 2.564 2.564 2.564 2.564 2.564 2.564 Year 40 0.107 0.321 0.535 0.749 0.963 1.177 1.391 1.605 1.819 2.033 2.247 2.461 AMP Corporation (calendar-year-end) has 2019 taxable income of $1,900,000 for purposes of computing the $179 expense. During 2019, AMP acquired the following assets: (Use MACRS Table 1, Table 2, Table 3, Table 4 and Table 5.) Placed in Asset Service Basis Machinery Computer equipment Office building September 12 February 10 April 2 $1,520,000 480,000 595,000 Total $2,595,000 a. What is the maximum amount of $179 expense AMP may deduct for 2019? Maximum $179 expense deductible b. What is the maximum total depreciation, including $179 expense, that AMP may deduct in 2019 on the assets it placed in service in 2019, assuming no bonus depreciation? (Round your intermediate calculations to the nearest whole dollar amount.) Maximum total depreciation (including $179 expense) Table 1 MACRS Half-Year Convention Depreciation Rate for Recovery Period 3-Year 5-Year 7-Year 10-Year 15-Year 20-Year Year 1 Year 2 33.33% 20.00% 14.29% 10.00% 5.00% 3.750% 44.45 32.00 24.49 18.00 9.50 7.219 Year 3 14.81 19.20 17.49 14.40 8.55 6.677 Year 4 7.41 11.52 12.49 11.52 7.70 6.177 Year 5 11.52 8.93 9.22 6.93 5.713 Year 6 Year 7 Year 8 5.76 8.92 7.37 6.23 5.285 8.93 6.55 5.90 4.888 4.46 6.55 5.90 4.522 Year 9 6.56 5.91 4.462 Year 10 Year 11 Year 12 6.55 5.90 4.461 3.28 5.91 4.462 5.90 4.461 Year 13 5.91 4.462 Year 14 5.90 4.461 Year 15 5.91 4.462 Year 16 2.95 4.461 TABLE 2a MACRS Mid-Quarter Convention: For proper Depreciation Rate for Recovery Period 5-Year 7-Year Year 1 35.00% 25.00% Year 2 26.00 21.43 Year 3 15.60 15.31 Year 4 11.01 10.93 Year 5 11.01 8.75 Year 6 1.38 8.74 Year 7 8.75 Year 8 1.09 TABLE 2b MACRS Mid-Quarter Convention: For prope Depreciation Rate for Recovery Period 5-Year 7-Year Year 1 25.00% 17.85% Year 2 30.00 23.47 Year 3 18.00 16.76 Year 4 11.37 11.97 Voom 11. 27 O 07 TABLE 3 Residential Rental Property Mid-Month Convention Straight Line-27.5 Years Month Property Placed in Service Month 1 Month 2 Month 3 Month 4 Month 5 Month 6 Month 7 Month 8 Month 9 Month 10 Month 11 Month 12 Year 1 3.485% 3.182% 2.879% 2.576% 2.273% 1.970% 1.667% 1.364% 1.061% 0.758% 0.455% 0.152% Year 2-9 3.636 3.636 3.636 3.636 3.636 3.636 3.636 3.636 3.636 3.636 3.636 3.636 Year 10 3.637 3.637 3.637 3.637 3.637 3.637 3.636 3.636 3.636 3.636 3.636 3.636 Year 11 3.636 3.636 3.636 3.636 3.636 3.636 3.637 3.637 3.637 3.637 3.637 3.637 Year 12 3.637 3.637 3.637 3.637 3.637 3.637 3.636 3.636 3.636 3.636 3.636 3.636 Year 13 3.636 3.636 3.636 3.636 3.636 3.636 3.637 3.637 3.637 3.637 3.637 3.637 Year 14 3.637 3.637 3.637 3.637 3.637 3.637 3.636 3.636 3.636 3.636 3.636 3.636 Year 15 3.636 3.636 3.636 3.636 3.636 3.636 3.637 3.637 3.637 3.637 3.637 3.637 Year 16 3.637 3.637 3.637 3.637 3.637 3.637 3.636 3.636 3.636 3.636 3.636 3.636 Year 17 3.636 3.636 3.636 3.636 3.636 3.636 3.637 3.637 3.637 3.637 3.637 3.637 Year 18 3.637 3.637 3.637 3.637 3.637 3.637 3.636 3.636 3.636 3.636 3.636 3.636 Year 19 3.636 3.636 3.636 3.636 3.636 3,636 3.637 3.637 3.637 3.637 3.637 3.637 Year 20 3.637 3.637 3.637 3.637 3.637 3.637 3.636 3.636 3.636 3.636 3.636 3.636 Year 21 3.636 3.636 3.636 3.636 3.636 3.636 3.637 3.637 3.637 3.637 3.637 3.637 Year 22 3.637 3.637 3.637 3.637 3.637 3.637 3.636 3.636 3.636 3.636 3.636 3.636 Yoon 13 3 636 1 636 3 636 3 636 3 636 1 636 3 627 1 67 3 627 3 637 3 637 3637 ABLE 4 Nonresidential Real Property Mid-Month Convention Straight Line-31.5 Years (for assets placed in service before May 13, 1993) Month Property Placed in Service Month 1 Month 2 Month 3 Month 4 Month 5 Month 6 Month 7 Month 8 Month 9 Month 10 Month 11 Month 12 Year 1 3.042% 2.778% 2.513% 2.249% 1.984% 1.720% 1.455% 1.190% 0.926% 0.661% 0.397% 0.132% Year 2-7 3.175 3.175 3.175 3.175 3.175 3.175 3.175 3.175 3.175 3.175 3.175 3.175 Year 8 3.175 3.174 3.175 3.174 3.175 3.174 3.175 3.175 3.175 3.175 3.175 3.175 Year 9 3.174 3.175 3.174 3.175 3.174 3.175 3,174 3.175 3.174 3.175 3.174 3.175 Year 10 3.175 3.174 3.175 3.174 3.175 3.174 3.175 3.174 3.175 3.174 3.175 3.174 Year 11 3.174 3.175 3.174 3.175 3.174 3.175 3.174 3.175 3.174 3.175 3.174 3.175 Year 12 3.175 3.174 3.175 3.174 3.175 3.174 3.175 3.174 3.175 3.174 3.175 3.174 Year 13 3.174 3.175 3.174 3.175 3.174 3.175 3.174 3.175 3.174 3.175 3.174 3.175 Year 14 3.175 3.174 3.175 3.174 3.175 3.174 3.175 3.174 3.175 3.174 3.175 3.174 Year 15 3.174 3.175 3.174 3.175 3.174 3.175 3.174 3.175 3.174 3.175 3.174 3.175 Year 16 3.175 3.174 3.175 3.174 3.175 3.174 3.175 3.174 3.175 3.174 3.175 3.174 Year 17 3.174 3.175 3.174 3.175 3.174 3,175 3.174 3.175 3.174 3.175 3.174 3.175 Year 18 3.175 3.174 3.175 3.174 3.175 3.174 3.175 3.174 3.175 3.174 3.175 3.174 Year 19 3.174 3.175 3.174 3.175 3.174 3.175 3.174 3.175 3.174 3.175 3.174 3.175 Year 20 3.175 3.174 3.175 3.174 3.175 3.174 3.175 3.174 3.175 3.174 3.175 3.174 Year 21 3.174 3.175 3.174 3.175 3.174 3.175 3.174 3.175 3.174 3.175 3.174 3.175 Yoou 11 2 175 2 174 1 175 1 174 3 174 1 175 3 174 7 175 2 174 2 175 2 174 2175 BLE 5 Nonresidential Real Property Mid-Month Convention Straight Line-39 Years (for assets placed in service on or after May 13, 1993) Month Property Placed in Service Month 1 Month 2 Month 3 Month 4 Month 5 Month 6 Month 7 Month 8 Month 9 Month 10 Month 11 Month 12 Year 1 2.461% 2.247% 2.033% 1.819% 1.605% 1.391% 1.177% 0.963% 0.749% 0,535% 0.321% 0.107% Tear 2-39 2.564 2.564 2.564 2.564 2.564 2.564 2.564 2.564 2.564 2.564 2.564 2.564 Year 40 0.107 0.321 0.535 0.749 0.963 1.177 1.391 1.605 1.819 2.033 2.247 2.461 AMP Corporation (calendar-year-end) has 2019 taxable income of $1,900,000 for purposes of computing the $179 expense. During 2019, AMP acquired the following assets: (Use MACRS Table 1, Table 2, Table 3, Table 4 and Table 5.) Placed in Asset Service Basis Machinery Computer equipment Office building September 12 February 10 April 2 $1,520,000 480,000 595,000 Total $2,595,000 a. What is the maximum amount of $179 expense AMP may deduct for 2019? Maximum $179 expense deductible b. What is the maximum total depreciation, including $179 expense, that AMP may deduct in 2019 on the assets it placed in service in 2019, assuming no bonus depreciation? (Round your intermediate calculations to the nearest whole dollar amount.) Maximum total depreciation (including $179 expense) Table 1 MACRS Half-Year Convention Depreciation Rate for Recovery Period 3-Year 5-Year 7-Year 10-Year 15-Year 20-Year Year 1 Year 2 33.33% 20.00% 14.29% 10.00% 5.00% 3.750% 44.45 32.00 24.49 18.00 9.50 7.219 Year 3 14.81 19.20 17.49 14.40 8.55 6.677 Year 4 7.41 11.52 12.49 11.52 7.70 6.177 Year 5 11.52 8.93 9.22 6.93 5.713 Year 6 Year 7 Year 8 5.76 8.92 7.37 6.23 5.285 8.93 6.55 5.90 4.888 4.46 6.55 5.90 4.522 Year 9 6.56 5.91 4.462 Year 10 Year 11 Year 12 6.55 5.90 4.461 3.28 5.91 4.462 5.90 4.461 Year 13 5.91 4.462 Year 14 5.90 4.461 Year 15 5.91 4.462 Year 16 2.95 4.461 TABLE 2a MACRS Mid-Quarter Convention: For proper Depreciation Rate for Recovery Period 5-Year 7-Year Year 1 35.00% 25.00% Year 2 26.00 21.43 Year 3 15.60 15.31 Year 4 11.01 10.93 Year 5 11.01 8.75 Year 6 1.38 8.74 Year 7 8.75 Year 8 1.09 TABLE 2b MACRS Mid-Quarter Convention: For prope Depreciation Rate for Recovery Period 5-Year 7-Year Year 1 25.00% 17.85% Year 2 30.00 23.47 Year 3 18.00 16.76 Year 4 11.37 11.97 Voom 11. 27 O 07 TABLE 3 Residential Rental Property Mid-Month Convention Straight Line-27.5 Years Month Property Placed in Service Month 1 Month 2 Month 3 Month 4 Month 5 Month 6 Month 7 Month 8 Month 9 Month 10 Month 11 Month 12 Year 1 3.485% 3.182% 2.879% 2.576% 2.273% 1.970% 1.667% 1.364% 1.061% 0.758% 0.455% 0.152% Year 2-9 3.636 3.636 3.636 3.636 3.636 3.636 3.636 3.636 3.636 3.636 3.636 3.636 Year 10 3.637 3.637 3.637 3.637 3.637 3.637 3.636 3.636 3.636 3.636 3.636 3.636 Year 11 3.636 3.636 3.636 3.636 3.636 3.636 3.637 3.637 3.637 3.637 3.637 3.637 Year 12 3.637 3.637 3.637 3.637 3.637 3.637 3.636 3.636 3.636 3.636 3.636 3.636 Year 13 3.636 3.636 3.636 3.636 3.636 3.636 3.637 3.637 3.637 3.637 3.637 3.637 Year 14 3.637 3.637 3.637 3.637 3.637 3.637 3.636 3.636 3.636 3.636 3.636 3.636 Year 15 3.636 3.636 3.636 3.636 3.636 3.636 3.637 3.637 3.637 3.637 3.637 3.637 Year 16 3.637 3.637 3.637 3.637 3.637 3.637 3.636 3.636 3.636 3.636 3.636 3.636 Year 17 3.636 3.636 3.636 3.636 3.636 3.636 3.637 3.637 3.637 3.637 3.637 3.637 Year 18 3.637 3.637 3.637 3.637 3.637 3.637 3.636 3.636 3.636 3.636 3.636 3.636 Year 19 3.636 3.636 3.636 3.636 3.636 3,636 3.637 3.637 3.637 3.637 3.637 3.637 Year 20 3.637 3.637 3.637 3.637 3.637 3.637 3.636 3.636 3.636 3.636 3.636 3.636 Year 21 3.636 3.636 3.636 3.636 3.636 3.636 3.637 3.637 3.637 3.637 3.637 3.637 Year 22 3.637 3.637 3.637 3.637 3.637 3.637 3.636 3.636 3.636 3.636 3.636 3.636 Yoon 13 3 636 1 636 3 636 3 636 3 636 1 636 3 627 1 67 3 627 3 637 3 637 3637 ABLE 4 Nonresidential Real Property Mid-Month Convention Straight Line-31.5 Years (for assets placed in service before May 13, 1993) Month Property Placed in Service Month 1 Month 2 Month 3 Month 4 Month 5 Month 6 Month 7 Month 8 Month 9 Month 10 Month 11 Month 12 Year 1 3.042% 2.778% 2.513% 2.249% 1.984% 1.720% 1.455% 1.190% 0.926% 0.661% 0.397% 0.132% Year 2-7 3.175 3.175 3.175 3.175 3.175 3.175 3.175 3.175 3.175 3.175 3.175 3.175 Year 8 3.175 3.174 3.175 3.174 3.175 3.174 3.175 3.175 3.175 3.175 3.175 3.175 Year 9 3.174 3.175 3.174 3.175 3.174 3.175 3,174 3.175 3.174 3.175 3.174 3.175 Year 10 3.175 3.174 3.175 3.174 3.175 3.174 3.175 3.174 3.175 3.174 3.175 3.174 Year 11 3.174 3.175 3.174 3.175 3.174 3.175 3.174 3.175 3.174 3.175 3.174 3.175 Year 12 3.175 3.174 3.175 3.174 3.175 3.174 3.175 3.174 3.175 3.174 3.175 3.174 Year 13 3.174 3.175 3.174 3.175 3.174 3.175 3.174 3.175 3.174 3.175 3.174 3.175 Year 14 3.175 3.174 3.175 3.174 3.175 3.174 3.175 3.174 3.175 3.174 3.175 3.174 Year 15 3.174 3.175 3.174 3.175 3.174 3.175 3.174 3.175 3.174 3.175 3.174 3.175 Year 16 3.175 3.174 3.175 3.174 3.175 3.174 3.175 3.174 3.175 3.174 3.175 3.174 Year 17 3.174 3.175 3.174 3.175 3.174 3,175 3.174 3.175 3.174 3.175 3.174 3.175 Year 18 3.175 3.174 3.175 3.174 3.175 3.174 3.175 3.174 3.175 3.174 3.175 3.174 Year 19 3.174 3.175 3.174 3.175 3.174 3.175 3.174 3.175 3.174 3.175 3.174 3.175 Year 20 3.175 3.174 3.175 3.174 3.175 3.174 3.175 3.174 3.175 3.174 3.175 3.174 Year 21 3.174 3.175 3.174 3.175 3.174 3.175 3.174 3.175 3.174 3.175 3.174 3.175 Yoou 11 2 175 2 174 1 175 1 174 3 174 1 175 3 174 7 175 2 174 2 175 2 174 2175 BLE 5 Nonresidential Real Property Mid-Month Convention Straight Line-39 Years (for assets placed in service on or after May 13, 1993) Month Property Placed in Service Month 1 Month 2 Month 3 Month 4 Month 5 Month 6 Month 7 Month 8 Month 9 Month 10 Month 11 Month 12 Year 1 2.461% 2.247% 2.033% 1.819% 1.605% 1.391% 1.177% 0.963% 0.749% 0,535% 0.321% 0.107% Tear 2-39 2.564 2.564 2.564 2.564 2.564 2.564 2.564 2.564 2.564 2.564 2.564 2.564 Year 40 0.107 0.321 0.535 0.749 0.963 1.177 1.391 1.605 1.819 2.033 2.247 2.461
Expert Answer:

Related Book For 

Essentials of Federal Taxation 2019
ISBN: 9781260190045
10th edition
Authors: Brian Spilker, Benjamin Ayers, John Robinson, Edmund Outslay, Ronald Worsham, John Barrick, Connie Weaver
Posted Date:
Students also viewed these accounting questions
-
AMP Corporation (calendar-year-end) has 2019 taxable income of $1,900,000 for purposes of computing the 179 expense. During 2019, AMP acquired the following assets: Placed in Asset Service Basis...
-
What is the maximum amount of interest to be capitalized under IFRS?
-
What is the maximum amount of foreign tax credit that a company will be allowed to take with respect to the income earned by a foreign operation?
-
The rotating beacon of a parked police car is 12 m from a straight wall. (a) Sketch the graph of the length L of the light beam, where L = 12 sec t, for 0 t 2.0 s. (b) Which part(s) of the graph...
-
The world's population passed 6.5 billion in 2006. Estimate the amount of land area required if each person were to stand in such a way as to be unable to touch another person. Compare this area to...
-
In the fluid filling operation of Example 9.6, suppose a sensor (e.g., a submerged float switch) is used to determine whether the contents of the tank have been evacuated, rather than rely on timer...
-
Describe multiple interfaces and explain why or when they are needed.
-
Early in 2011, the Excalibur Company began developing a new software package to be marketed. The project was completed in December 2011 at a cost of $6 million. Of this amount, $4 million was spent...
-
A dataset is given below. Calculate the odds ratio to assess the relationship between visiting a petting zoo and becoming infected by E. coli. Interpret the result. Got Sick (Cases) Did Not Get Sick...
-
Use anonymous FTP to connect to ftp.rfc-editor.org (directory innotes), and retrieve the RFC index. Also retrieve the protocol specifications for TCP, IP, and UDP.
-
1. You buy a pop-up toy from the dollar store. When you push down on it, it sticks to the desk for a moment and then pops into the air. If the toy has a mass of 0.100 kg and leaps 1.20 m off the...
-
The draft statement of profit or loss for Harris Ltd for the 9 months ending 30 September 2022 is given below: Sales Cost of sales Gross profit Administration salaries Insurance Rent Advertising...
-
We have a loan with monthly payments, an annual interest rate of 6%, paying off the $70,000 loan completely in a 10 year period. Payments are scheduled at the end of the period. Using Excel's PMT...
-
At September 30, the end of Beijing Company's third quarter, the following stockholders' equity accounts are reported. Common stock, $12 par value Paid-in capital in excess of par value, common stock...
-
The risk-free interest rate is 3% annualized and continuously compounded. Assume the market is frictionless. When you plot the forward curves below, you may choose to either (i) use the analytical...
-
For the given open-loop transfer function, design a PD controller using root-locus (angle and magnitude conditions) to shape the closed-loop step response with a settling time of 1 second and a 10%...
-
What is net sales if net income = $75,000, cost of goods sold = $30,000, and the gross profit percentage is 40%?
-
Derive Eq. (18.33) from Eq. (18.32).
-
Jamel and Jennifer have been married 30 years and have filed a joint return every year of their marriage. Their three daughters, Jade, Lindsay, and Abbi, are ages 12, 17, and 22, respectively, and...
-
Virginia Corporation is a calendar-year corporation. At the beginning of 2018, its election to be taxed as an S corporation became effective. Virginia Corp.s balance sheet at the end of 2017...
-
Sylvester files as a single taxpayer during 2018. He itemizes deductions for regular tax purposes. He paid charitable contributions of $7,000, real estate taxes of $1,000, state income taxes of...
-
A stock price is governed by \[\frac{\mathrm{d} S}{S}=\mu \mathrm{d} t+\sigma \mathrm{d} z\] where \(z\) is a standardized Wiener process. Interest is constant at rate \(r\). An investor wishes to...
-
At the beginning of April one year, the silver forward prices (in cents per troy ounce) were as follows: The carrying cost of silver is about 20 cents per ounce per year, paid at the beginning of...
-
Suppose that a forward contract on an asset is written at time zero and there are \(M\) periods until delivery. Suppose that the proportional carrying charge in period \(k\) is \(q S(k)\), where...

Study smarter with the SolutionInn App