

An evaluation was recently performed on brands and data were collected that classified each brand as...
Fantastic news! We've Found the answer you've been seeking!
Question:
Transcribed Image Text:
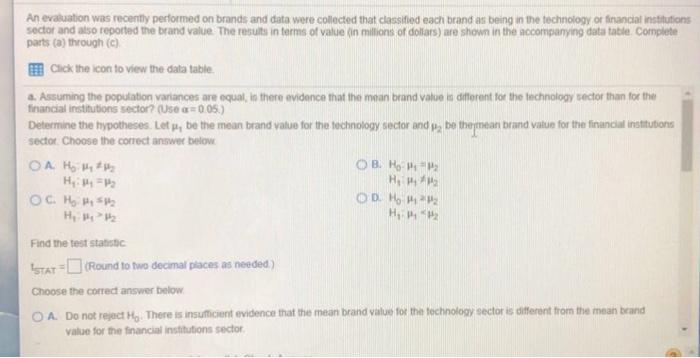
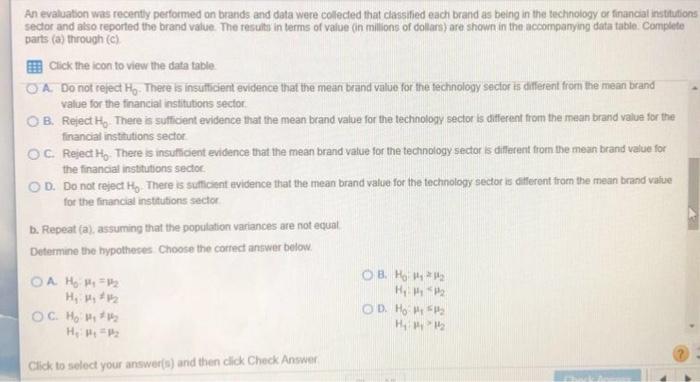
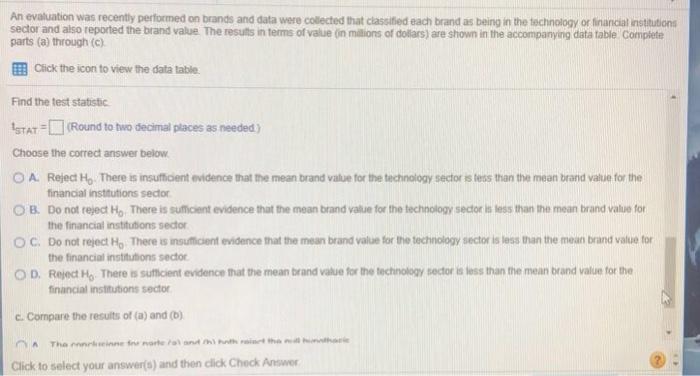
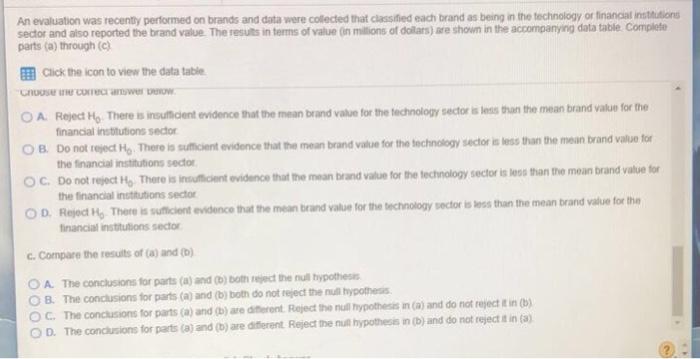
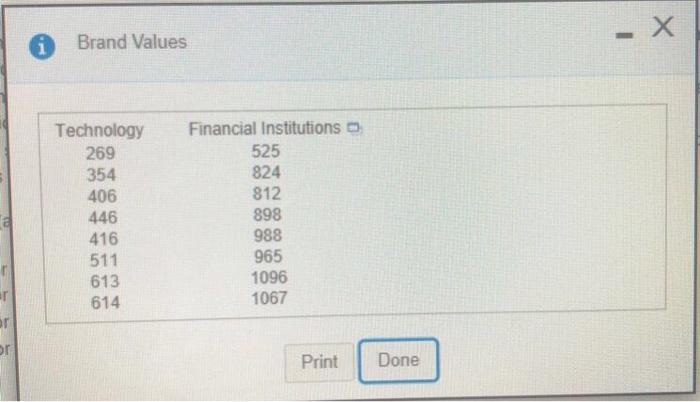
An evaluation was recently performed on brands and data were collected that classified each brand as being in the technology or financial institutions sector and also reported the brand value. The results in terms of value (in millions of dollars) are shown in the accompanying data table. Complete parts (a) through (c) Click the icon to view the data table. a. Assuming the population variances are equal, is there evidence that the mean brand value is different for the technology sector than for the financial institutions sector? (Use a 0.05.) Determine the hypotheses. Let u, be the mean brand value for the technology sector and p, be the mean brand value for the financial institutions sector. Choose the correct answer below OA H₂ #4₂ #1₂ H₁: Py = P₂ OC. H₂ Hy $1₂ H₂: PyP₂ Find the test statistic ISTAT (Round to two decimal places as needed.) Choose the correct answer below OB. HP P₂ H₂ P OD. H₂ ₂ H₂ P P₂ OA. Do not reject H. There is insufficient evidence that the mean brand value for the technology sector is different from the mean brand value for the financial institutions sector. An evaluation was recently performed on brands and data were collected that classified each brand as being in the technology or financial institutions sector and also reported the brand value. The results in terms of value (in millions of dollars) are shown in the accompanying datatable. Complete parts (a) through (c) Click the icon to view the data table A. Do not reject H.. There is insufficient evidence that the mean brand value for the technology sector is different from the mean brand value for the financial institutions sector B. Reject H. There is sufficient evidence that the mean brand value for the technology sector is different from the mean brand value for the financial institutions sector OC OD. Do not reject H, There is sufficient evidence that the mean brand value for the technology sector is different from the mean brand value for the financial institutions sector Reject Ho. There is insufficient evidence that the mean brand value for the technology sector is different from the mean brand value for the financial institutions sector. b. Repeat (a), assuming that the population variances are not equal Determine the hypotheses Choose the correct answer below. OA H₂ P₁ P₂ H₁ H₂ ##₂ OC. H₂ #₁ #₂ H₂ P₁ P₂ Click to select your answer(s) and then click Check Answer OB. H ₂ H₂ P P₂ OD. Ho: P H₂ 1 5₂ 1/₂ An evaluation was recently performed on brands and data were collected that classified each brand as being in the technology or financial institutions sector and also reported the brand value. The results in terms of value (in millions of dollars) are shown in the accompanying data table Complete parts (a) through (c). Click the icon to view the data table. Find the test statistic ISTAT (Round to two decimal places as needed.) Choose the correct answer below. OA. Reject Ho. There is insufficient evidence that the mean brand value for the technology sector is less than the mean brand value for the financial institutions sector. OB. Do not reject Ho. There is sufficient evidence that the mean brand value for the technology sector is less than the mean brand value for the financial institutions sector OC. Do not reject Ho There is insufficient evidence that the mean brand value for the technology sector is less than the mean brand value for the financial institutions sector OD. Reject H, There is sufficient evidence that the mean brand value for the technology sector is less than the mean brand value for the financial institutions sector c. Compare the results of (a) and (b) The moncleinne for norte /al and thi hoth raiart the hunthar Click to select your answer(s) and then click Check Answer An evaluation was recently performed on brands and data were collected that classified each brand as being in the technology or financial institutions sector and also reported the brand value. The results in terms of value (in millions of dollars) are shown in the accompanying data table Complete parts (a) through (c) Click the icon to view the data table Choose the correct answer below. OA Reject H₂ There is insufficient evidence that the mean brand value for the technology sector is less than the mean brand value for the financial institutions sector OB. Do not reject Ho. There is sufficient evidence that the mean brand value for the technology sector is less than the mean brand value for the financial institutions sector OC. Do not reject H, There is insufficient evidence that the mean brand value for the technology sector is less than the mean brand value for the financial institutions sector OD. Reject H, There is sufficient evidence that the mean brand value for the technology sector is less than the mean brand value for the financial institutions sector c. Compare the results of (a) and (b) A. The conclusions for parts (a) and (b) both reject the null hypothesis OB. The conclusions for parts (a) and (b) both do not reject the null hypothesis OC. The conclusions for parts (a) and (b) are different. Reject the null hypothesis in (a) and do not reject it in (b) OD. The conclusions for parts (a) and (b) are different Reject the null hypothesis in (b) and do not reject it in (a) or por Brand Values Technology Financial Institutions 269 354 406 446 416 511 613 614 525 824 812 898 988 965 1096 1067 Print Done - X An evaluation was recently performed on brands and data were collected that classified each brand as being in the technology or financial institutions sector and also reported the brand value. The results in terms of value (in millions of dollars) are shown in the accompanying data table. Complete parts (a) through (c) Click the icon to view the data table. a. Assuming the population variances are equal, is there evidence that the mean brand value is different for the technology sector than for the financial institutions sector? (Use a 0.05.) Determine the hypotheses. Let u, be the mean brand value for the technology sector and p, be the mean brand value for the financial institutions sector. Choose the correct answer below OA H₂ #4₂ #1₂ H₁: Py = P₂ OC. H₂ Hy $1₂ H₂: PyP₂ Find the test statistic ISTAT (Round to two decimal places as needed.) Choose the correct answer below OB. HP P₂ H₂ P OD. H₂ ₂ H₂ P P₂ OA. Do not reject H. There is insufficient evidence that the mean brand value for the technology sector is different from the mean brand value for the financial institutions sector. An evaluation was recently performed on brands and data were collected that classified each brand as being in the technology or financial institutions sector and also reported the brand value. The results in terms of value (in millions of dollars) are shown in the accompanying datatable. Complete parts (a) through (c) Click the icon to view the data table A. Do not reject H.. There is insufficient evidence that the mean brand value for the technology sector is different from the mean brand value for the financial institutions sector B. Reject H. There is sufficient evidence that the mean brand value for the technology sector is different from the mean brand value for the financial institutions sector OC OD. Do not reject H, There is sufficient evidence that the mean brand value for the technology sector is different from the mean brand value for the financial institutions sector Reject Ho. There is insufficient evidence that the mean brand value for the technology sector is different from the mean brand value for the financial institutions sector. b. Repeat (a), assuming that the population variances are not equal Determine the hypotheses Choose the correct answer below. OA H₂ P₁ P₂ H₁ H₂ ##₂ OC. H₂ #₁ #₂ H₂ P₁ P₂ Click to select your answer(s) and then click Check Answer OB. H ₂ H₂ P P₂ OD. Ho: P H₂ 1 5₂ 1/₂ An evaluation was recently performed on brands and data were collected that classified each brand as being in the technology or financial institutions sector and also reported the brand value. The results in terms of value (in millions of dollars) are shown in the accompanying data table Complete parts (a) through (c). Click the icon to view the data table. Find the test statistic ISTAT (Round to two decimal places as needed.) Choose the correct answer below. OA. Reject Ho. There is insufficient evidence that the mean brand value for the technology sector is less than the mean brand value for the financial institutions sector. OB. Do not reject Ho. There is sufficient evidence that the mean brand value for the technology sector is less than the mean brand value for the financial institutions sector OC. Do not reject Ho There is insufficient evidence that the mean brand value for the technology sector is less than the mean brand value for the financial institutions sector OD. Reject H, There is sufficient evidence that the mean brand value for the technology sector is less than the mean brand value for the financial institutions sector c. Compare the results of (a) and (b) The moncleinne for norte /al and thi hoth raiart the hunthar Click to select your answer(s) and then click Check Answer An evaluation was recently performed on brands and data were collected that classified each brand as being in the technology or financial institutions sector and also reported the brand value. The results in terms of value (in millions of dollars) are shown in the accompanying data table Complete parts (a) through (c) Click the icon to view the data table Choose the correct answer below. OA Reject H₂ There is insufficient evidence that the mean brand value for the technology sector is less than the mean brand value for the financial institutions sector OB. Do not reject Ho. There is sufficient evidence that the mean brand value for the technology sector is less than the mean brand value for the financial institutions sector OC. Do not reject H, There is insufficient evidence that the mean brand value for the technology sector is less than the mean brand value for the financial institutions sector OD. Reject H, There is sufficient evidence that the mean brand value for the technology sector is less than the mean brand value for the financial institutions sector c. Compare the results of (a) and (b) A. The conclusions for parts (a) and (b) both reject the null hypothesis OB. The conclusions for parts (a) and (b) both do not reject the null hypothesis OC. The conclusions for parts (a) and (b) are different. Reject the null hypothesis in (a) and do not reject it in (b) OD. The conclusions for parts (a) and (b) are different Reject the null hypothesis in (b) and do not reject it in (a) or por Brand Values Technology Financial Institutions 269 354 406 446 416 511 613 614 525 824 812 898 988 965 1096 1067 Print Done - X
Expert Answer:

Related Book For 

Introductory Statistics Exploring the World Through Data
ISBN: 978-0321978271
2nd edition
Authors: Robert Gould, Colleen Ryan
Posted Date:
Students also viewed these accounting questions
-
Complete parts a through c below for the continuous data in the accompanying table. Click the icon to view the data table. a) Construct a frequency distribution using the 2" zn rule. Select the...
-
Data were collected that included information on the weight of the trash (in pounds) on the street one week and the number of people who live in the house. The figure shows a scatterplot with the...
-
The data shown in the Table 8E.8 were collected in an experiment to optimize crystal growth as a function of three variables . Large values of y (yield in grams) are desirable. Fit a second-order...
-
Provide the appropriate statute for your answer (format style - IRAC - Issue, Rule, Application and Conclusion.) what are your thought? Problem Scenario- Earnest is married to Janice. Earnest and...
-
What are the five risks associated with distributed data processing?
-
How are computations carried in the three layers of multilayer perceptrons?
-
Do larger butterflies live longer? The wingspan (in millimeters) and the lifespan in the adult state (in days) were measured for 22 species of butterfly. Following are the results. a. Compute the...
-
A mining company is considering a new project. Because the mine has received a permit, the project would be legal; but it would cause significant harm to a nearby river. The firm could spend an...
-
As an investor, how would you characterise riskiness of Woolworths? If the risk- free rate is 4.1% and the expected return on market portfolio (i.e., the ASX index) is 6.1%, using the CAPM, what will...
-
The trial balance of Garvey, Inc., at September 30, 2012, does not balance: The accounting records hold the following errors: a. Recorded a $100 cash revenue transaction by debiting Accounts...
-
Due to major works (mainly additions) at Dandenong (not at BS's caf) during 2016-17, BS's caf suffered an economic downturn for the year (like other shops in the centre). In response to the economic...
-
What are the limitations of using IRR as a sole criterion for investment decision-making? 6. How does the timing of cash flows impact the calculation and interpretation of IRR? 7. Can IRR be used for...
-
According to a study, the probability that a smoker will quit smoking increases with the smoker's educational level. The probability (expressed as a percent) that a smoker with x years of education...
-
Consider the initial value problem for function y. y"-y-2y=-2 et, y(0) = 0, y'(0) = 0. (a) Find the Laplace Transform F(s) = L[f(t)], where f(t) is the right-hand side of the differential equation....
-
4. (30 points) Given two distinct constant vectors a := (a1, a2, 3) and b := (b1, b2, b3), consider the set of all position vectors r := (x, y, z) satisfying 15 (r a) (r b) = | |a b|. - (1) (a) The...
-
Heidi says that Camp Bow Wow needs to have a very strong culture. A strong organizational culture is made up of different components, both visible and invisible. When analyzing the fit between an...
-
If the discount rate is 10% what is the present value for the cash flows? 2. The discount rate is 8%, what is the future value of these cash flows in year 4? 3. For each of the following annuities...
-
Solve for the equilibria of the following discrete-time dynamical systems Pr pt+1 = Pr+2.0(I-Pr)
-
The graph shows ages of females (labeled 1) and males (labeled 0) who are majoring in psychology in a four year college. a. Is this a histogram or a bar graph? How do you know? b. What type(s) of...
-
Refer to Exercise 12.10. "We randomly assigned adults undergoing clean-contaminated surgery in six hospitals to preoperative skin preparation with either chlorhexidine-alcohol scrub or...
-
Refer to Exercise 12.45. How could you find out whether iron caused the higher death rates associated in this study with its use? Describe the design of a study assuming you had 200 women to work...
-
True or False. The Euler-Bernoulli beam theory is more accurate than the Timoshenko theory.
-
Find the free-vibration solution of a cord fixed at both ends when its initial conditions are given by \[w(x, 0)=0, \quad \frac{\partial w}{\partial t}(x, 0)=\frac{2 a x}{l} \quad \text { for } \quad...
-
What is the main difference in the nature of the frequency equations of a discrete system and a continuous system?

Study smarter with the SolutionInn App