

Question: Analysis To the right is a graph showing sin 01 versus sin 02 for your data. 1. Use a curve fit to help determine
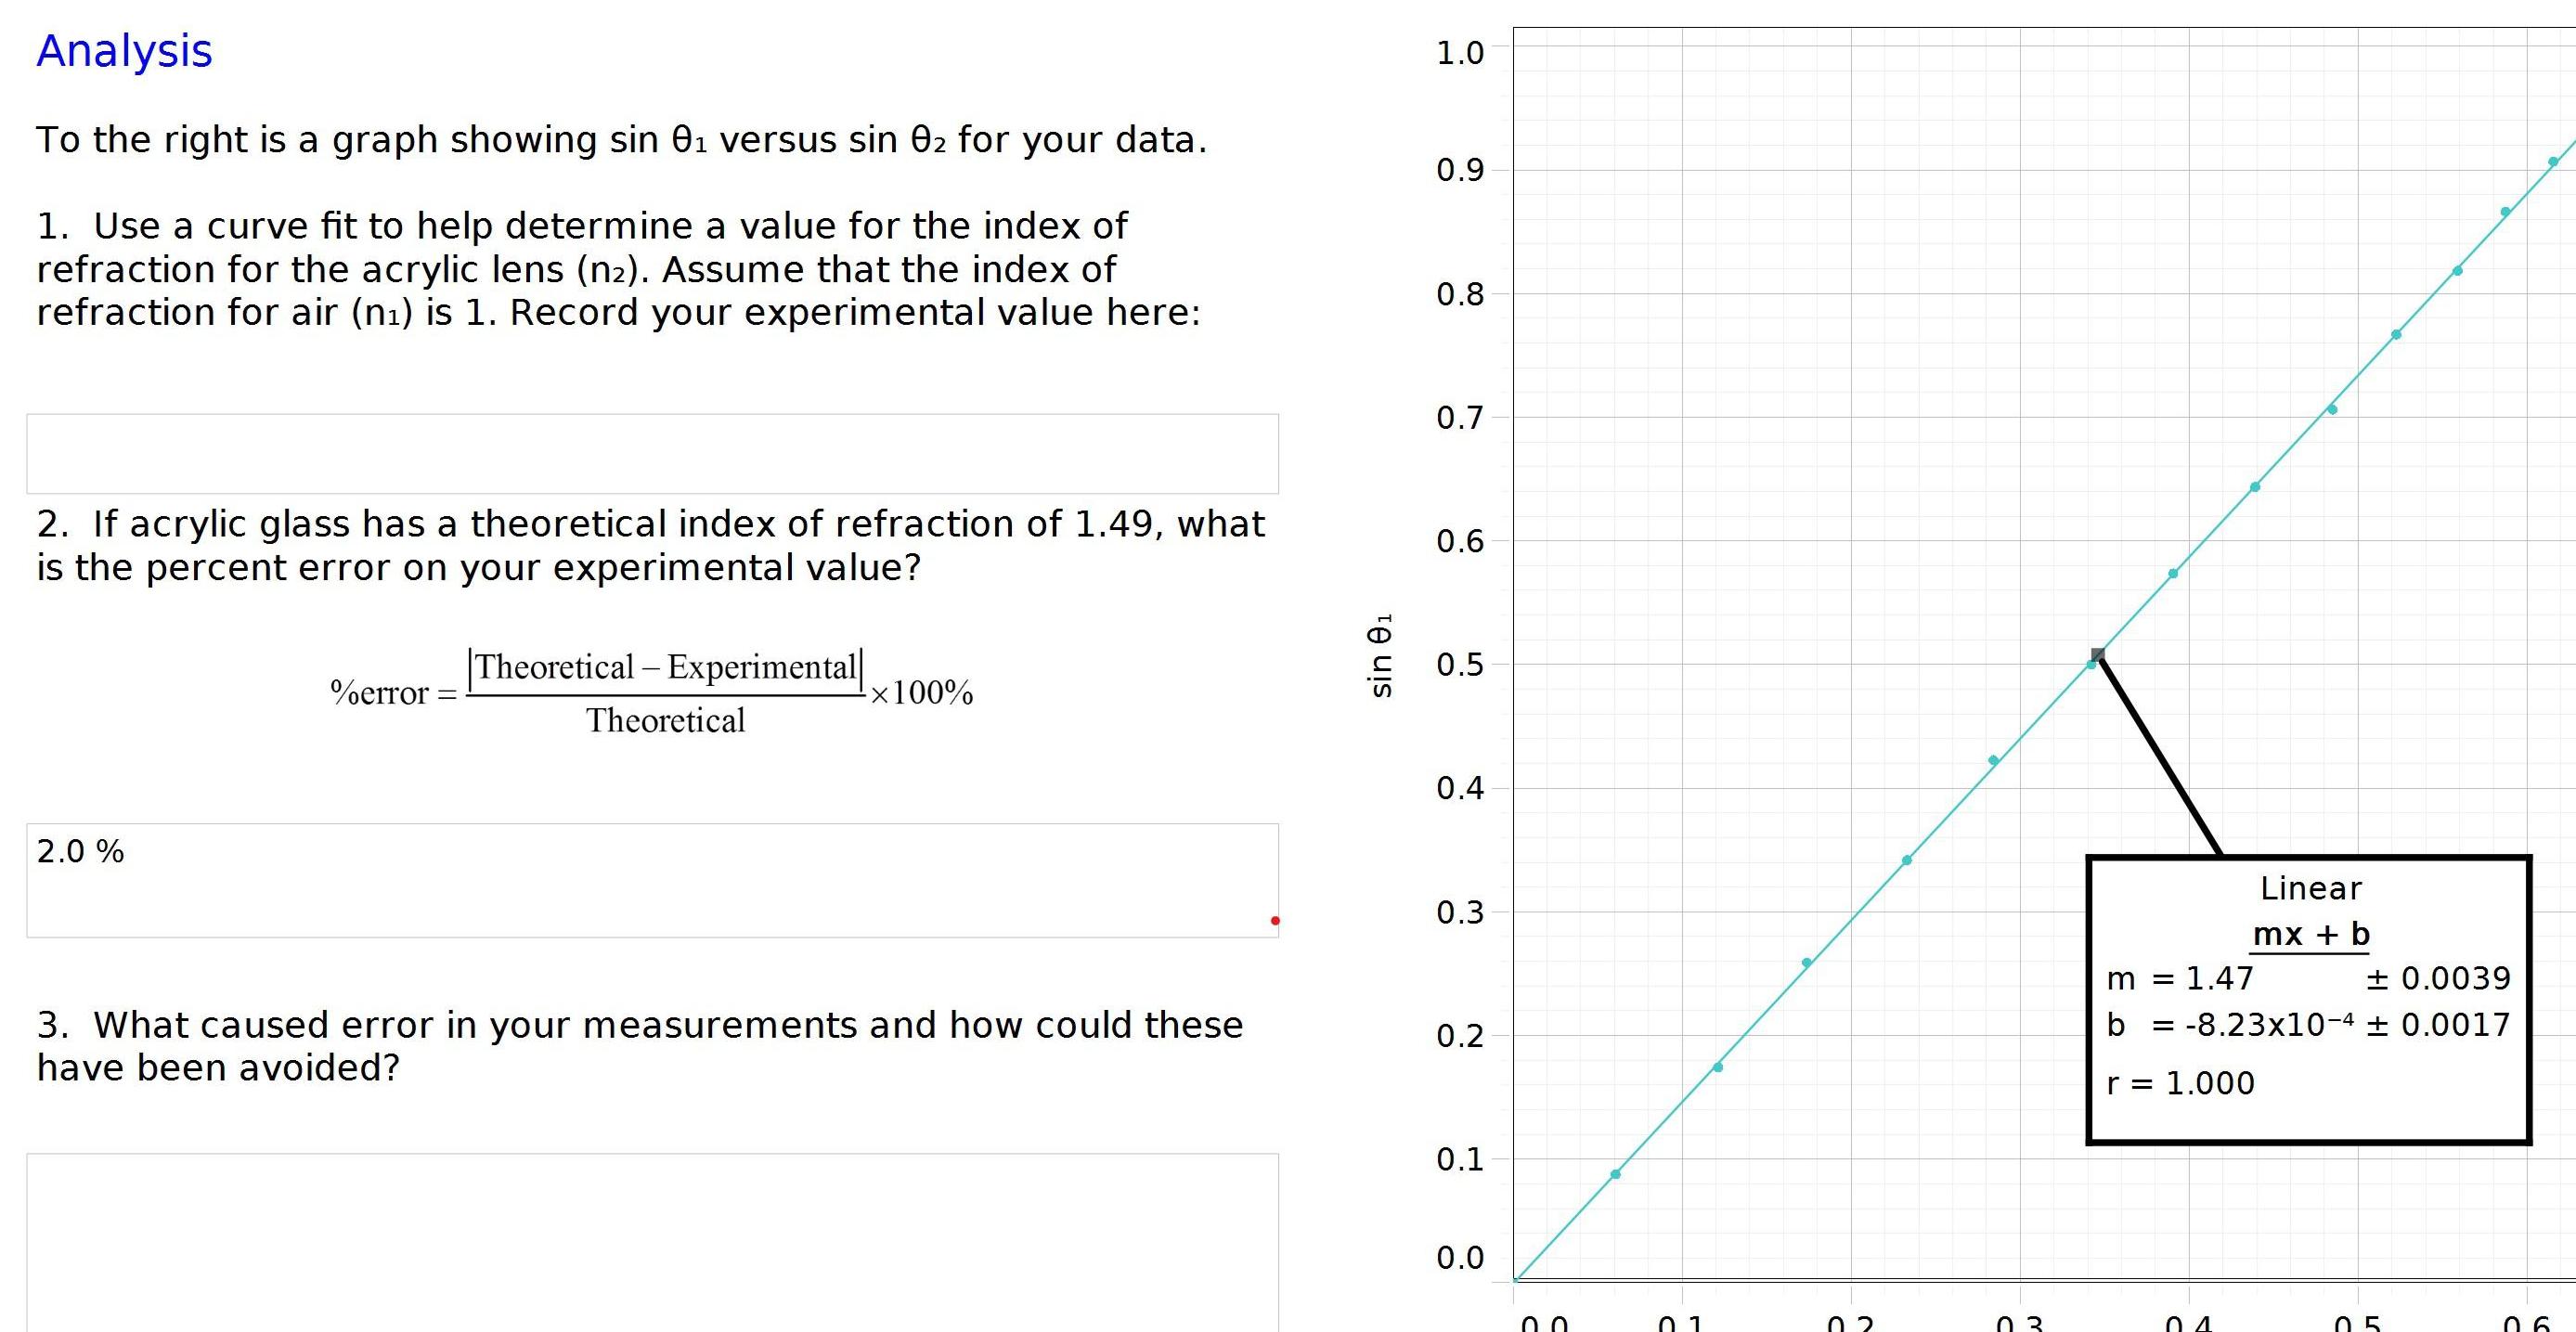
Analysis To the right is a graph showing sin 01 versus sin 02 for your data. 1. Use a curve fit to help determine a value for the index of refraction for the acrylic lens (n2). Assume that the index of refraction for air (ni) is 1. Record your experimental value here: 2. If acrylic glass has a theoretical index of refraction of 1.49, what is the percent error on your experimental value? 2.0 % Theoretical - Experimental| %error = -100% Theoretical sin 01 1.0 0.9 0.8 0.7 0.6 0.5 0.4 0.3 3. What caused error in your measurements and how could these have been avoided? 0.2 0.1 0.0 0 01 . = 1.47 m = Linear mx + b 0.0039 b = -8.23x10⁻⁴ 0.0017 r = 1.000 03 01 05 06
Step by Step Solution
There are 3 Steps involved in it

Get step-by-step solutions from verified subject matter experts