

Analyze firm performance in the past five years: 1. Trends in revenue, EBITDA, or net income growth
Fantastic news! We've Found the answer you've been seeking!
Question:
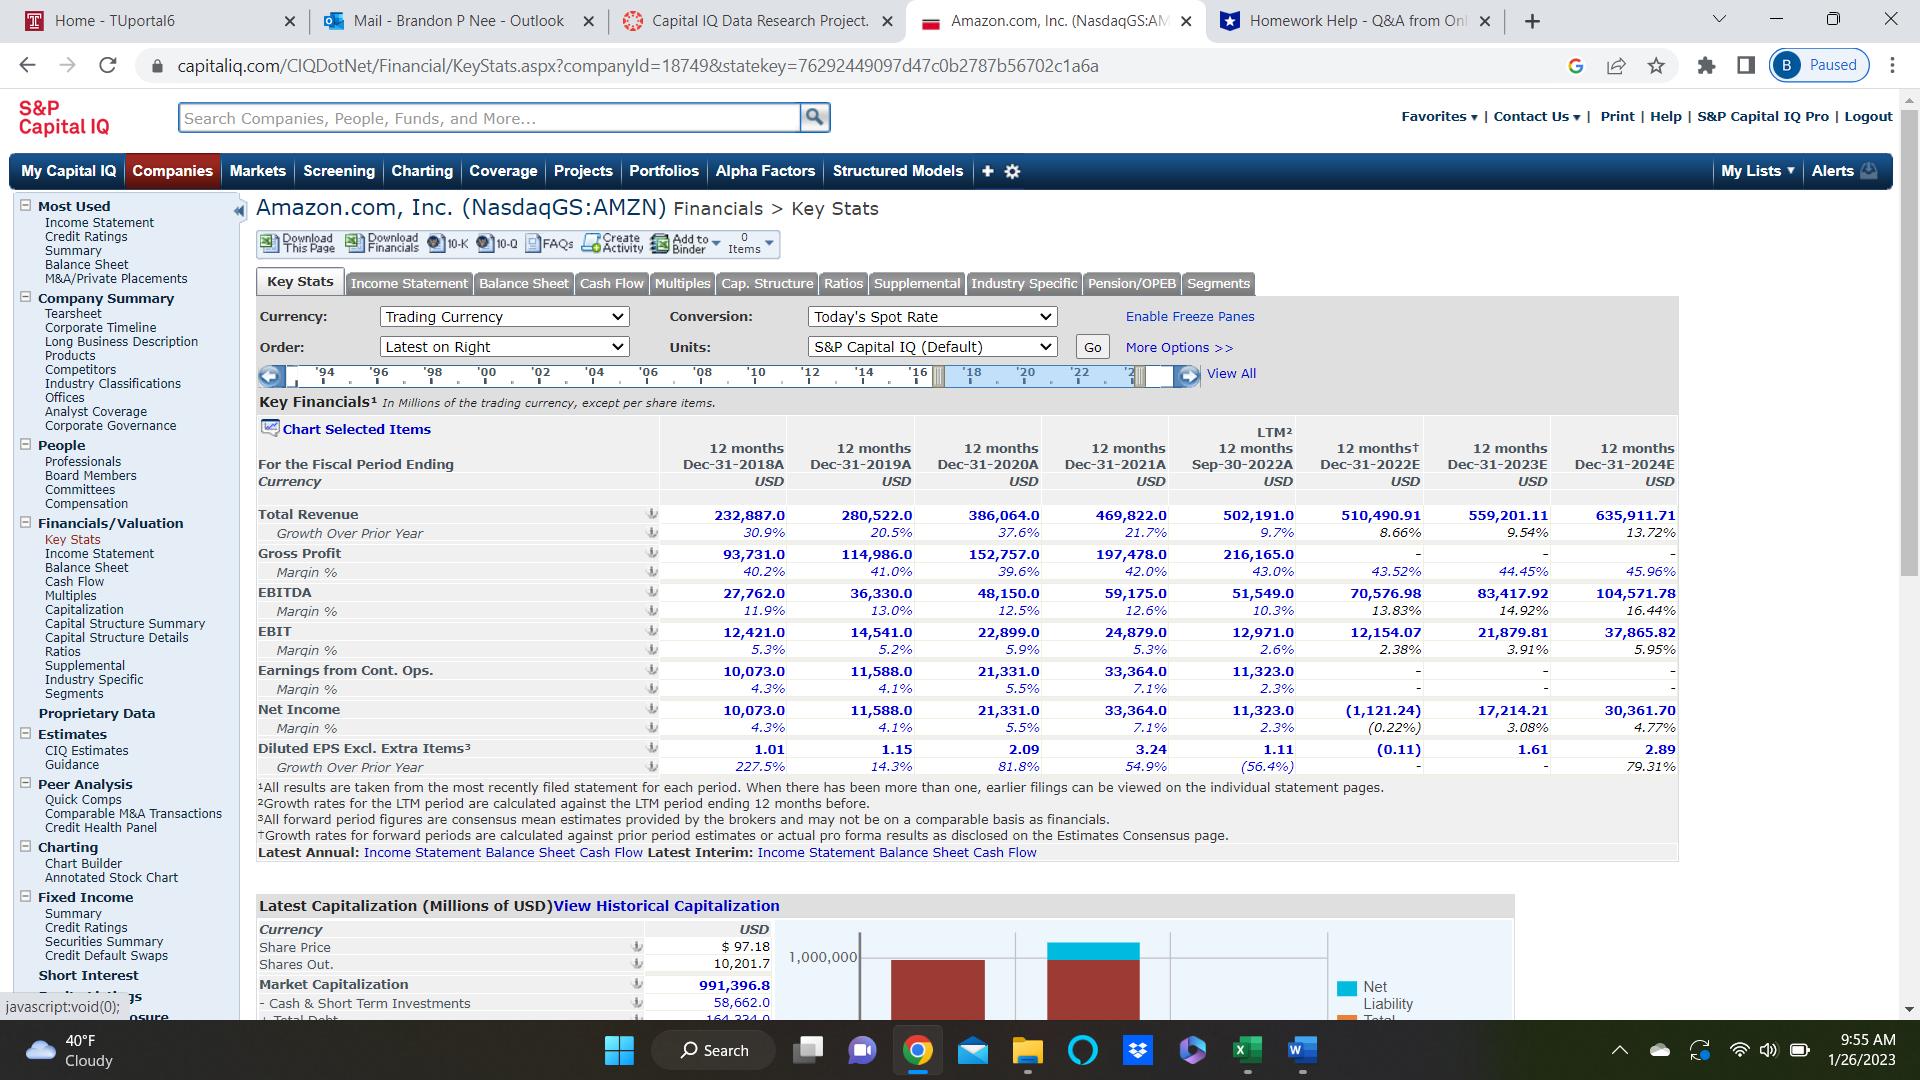
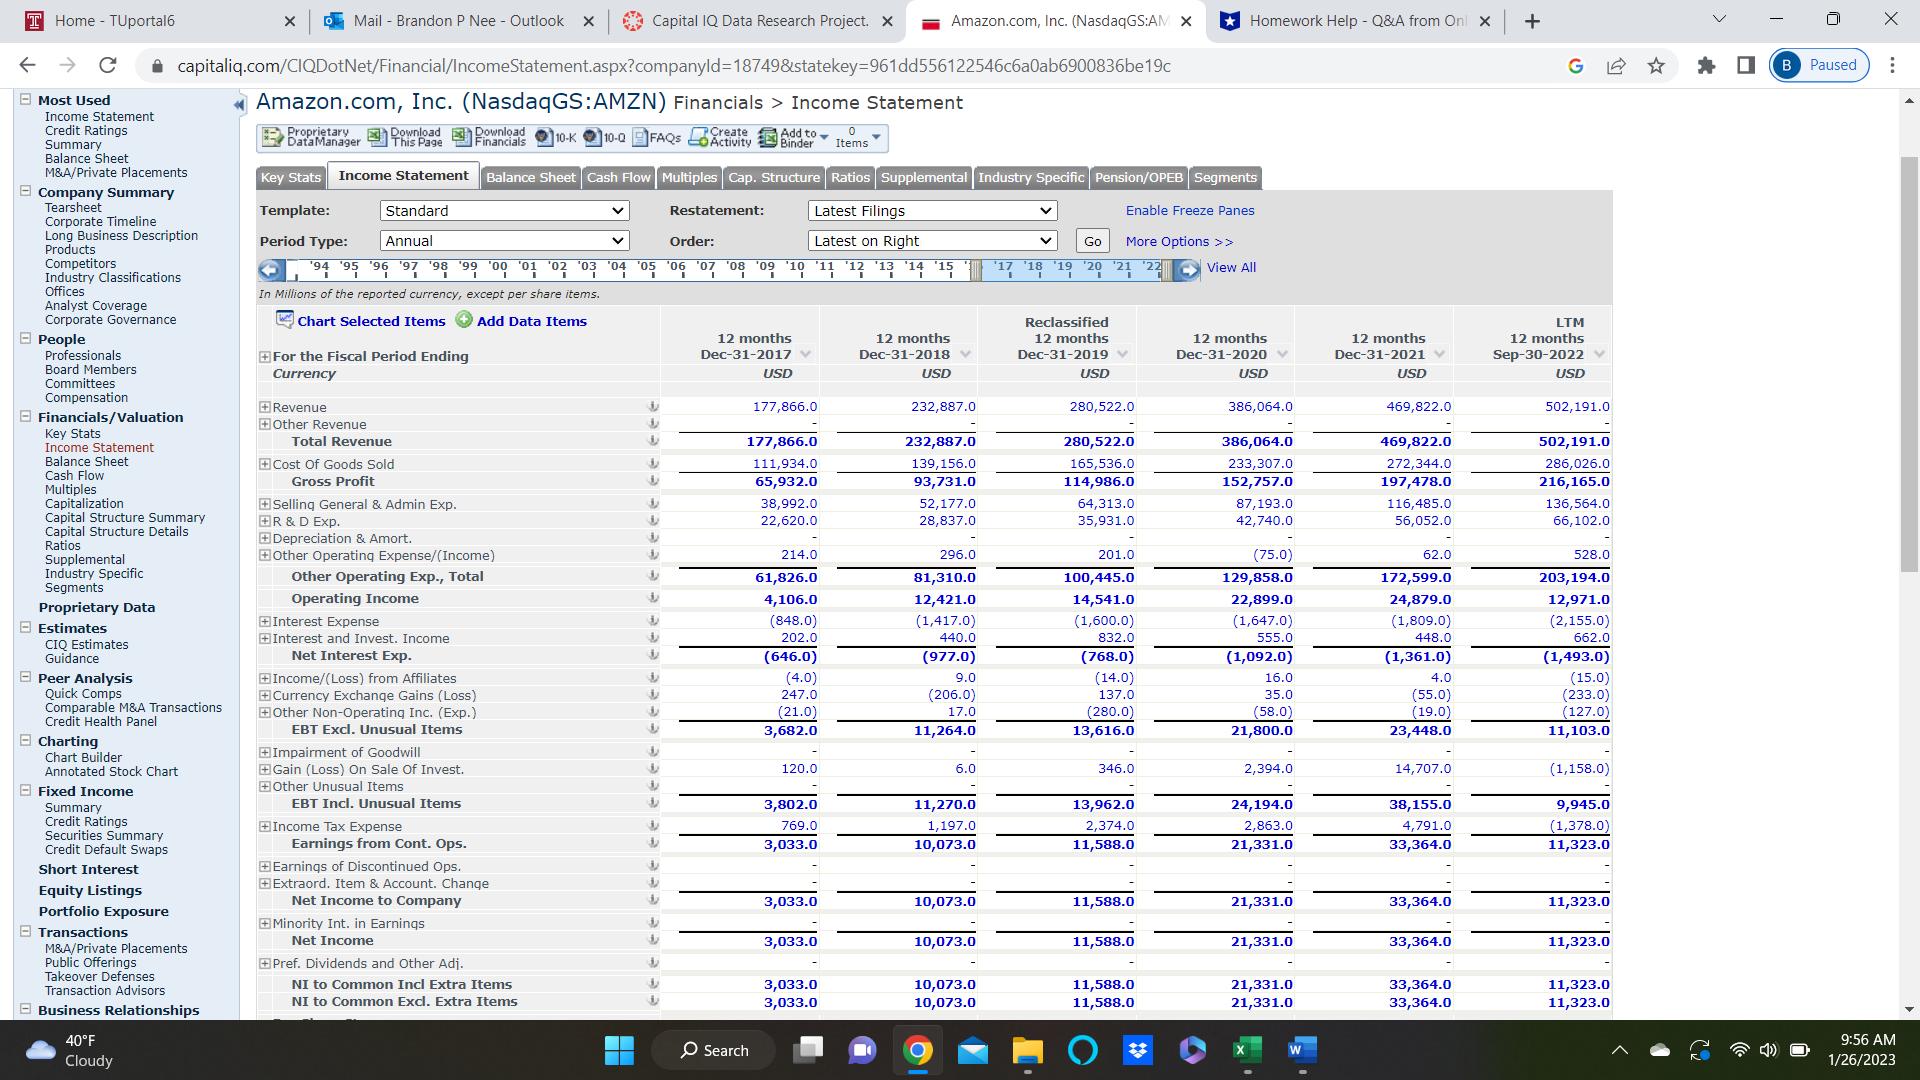
Analyze firm performance in the past five years:
1. Trends in revenue, EBITDA, or net income growth and explain significant difference in the trend, if any?
2.Trends in the firm's profitability, efficiency and leverage and explain significant difference in the trend, if any?
3. Use a DuPont analysis framework to explain why ROE increased or decreased or flatted during the past five years?


Expert Answer:
Based on the images you provided which show financial data for Amazoncom Inc NASDAQ AMZN Ill analyze the firms performance in the past five years to answer your questions 1 Trends in revenue EBITDA or ... View the full answer

Related Book For 

Financial Reporting Financial Statement Analysis and Valuation a strategic perspective
ISBN: 978-1337614689
9th edition
Authors: James M. Wahlen, Stephen P. Baginski, Mark Bradshaw
Posted Date:
